
Studies on Gender and Intersecting Identities
Portrait of Women by the Relative Remoteness of their Communities, Series 4: Labour Characteristics
by Tia Carpino
Skip to text
Text begins
Start of text boxHighlights
- Women in Canada live in communities with varying degrees of remoteness (based on proximity to service availability), namely: easily accessible; accessible; less accessible; remote; and, very remote areas. Overall, the labour characteristics of women varied according to the level of remoteness of their communities.
- Women’s employment rate was higher in more accessible areas, compared to more remote areas. This pattern held true for Indigenous women, but not for immigrant and racialized women, for whom the employment rate was higher in remote areas, compared to more accessible areas. Further, the unemployment rates of immigrant and racialized women were lower in remote areas, compared to more accessible areas.
- Most women who worked in 2015 worked on a full-time basis. However, the proportion of working women who worked full time varied according to the level of remoteness of their communities. The most accessible areas (easily accessible areas) and the most remote areas (very remote areas) were the areas with the highest proportions of working women who worked full time: about 4 in 5 women in these areas who worked in 2015 worked on a full-time basis, compared to about three-quarters of working women in the other remoteness areas.
- At the national level, the top three industries in which women were over-represented were: health care and social assistance; educational services; and, finance and insurance. The top three occupations in which women were over-represented were: health occupations; business, finance and administration occupations; and, occupations in education, law and social, community and government services. Although women were over-represented in these industries and occupations across all remoteness area categories, their over-representation was generally less pronounced in more accessible areas.
- The median annual employment income of women in Canada was highest in easily accessible areas and lowest in very remote areas. There were, however, variations depending on different characteristics. While the median annual employment income of Indigenous women followed the same pattern as all women in Canada (i.e., it was higher in easily accessible areas than it was in very remote areas), this was not the case for racialized women, for whom the median annual employment income was highest in very remote areas. For immigrant women, the median annual employment income of those in easily accessible areas was comparable to that of their counterparts in very remote areas.
Acknowledgments
This study is funded by Women and Gender Equality Canada.
Introduction
Over the past decades, significant progress has been made with respect to the economic participation and prosperity of women in Canada. For example, between 1950 and 2015, core working age (i.e., ages 25 to 54) women’s labour force participation increased by 60.4 percentage points (from 21.6% to 82.0%; Moyser, 2017). The gender wage gap—the difference between the earnings of women and men—has also decreased considerably over the past decades (Moyser, 2017; Pelletier et al., 2019). In 2022, when comparing the average hourly wages of women and men aged 15 years and older working full- and part-time, women made 88 cents for every dollar earned by men, compared to 82 cents two decades earlier (Statistics Canada, 2023).
Nonetheless, the equal and full participation of women in the economy has not yet been fully realized in Canada. Women (and men) continue to be employed in industries and occupations that tend to mirror traditional gender roles (Moyser, 2017). Further, the majority of those working part time are women, and caring for children is the reason most cited by women for working part time (Moyser, 2017). And, despite progress, a gender pay gap persists (Statistics Canada, 2023).
Labour characteristics vary for women of diverse backgrounds, such as Indigenous women, immigrant women, racialized women, and women with disabilities (Arriagada, 2016; Burlock, 2017; Hudon, 2015, 2016), as well as women living in rural and remote areas. Indeed, certain challenges related to living in rural and remote communities may affect the economic participation and prosperity of women (and people more generally) living in these communities. Barriers and access to telecommunication infrastructure (Internet access and broadband) in more remote areas may preclude women (and men) from certain employment opportunities (FEWO, 2021). Limited education options in more remote communities, as well as challenges related to transportation (e.g., lack of public transportation in more remote communities; FEWO, 2021), may also prevent people from seeking certain jobs—or working at all.
One notable consequence of the COVID-19 pandemic is the surge in telework in Canada (Mehdi & Morissette, 2021), which, for some people, has provided them with the flexibility to work in more remote areas, and, as a result, may provide new economic opportunities. However, it remains to be seen whether telework opportunities will continue to exist after the pandemic.
Using data from the 2016 Census of Population and the updated Remoteness Index Classification, this is the fourth and final article of a series on the socioeconomic and sociodemographic profile of women living in communities with varying levels of remoteness. The Remoteness Index (RI) assigns a relative remoteness value to each census subdivision, based on proximity to census agglomerations as a proxy for service accessibility (Alasia et al., 2017).Note Paired with the new RI classification, this tool allows the grouping of census subdivisions by their relative remoteness into five categories: easily accessible; accessible; less accessible; remote; and, very remote areas (Subedi et al., 2020). These refined categories have the potential for a better differentiation and description of the labour characteristics of diverse groups of women in communities with varying levels of remoteness.
This article focuses on the labour characteristics of women by the relative remoteness of their communities. Specifically, it examines women’s employment and unemployment rates, employment in full-time jobs, their representation in industries and occupations, as well as their employment income, according to the type of area (i.e., easily accessible, accessible, less accessible, remote, or very remote) in which they reside. Where possible, these indicators are also examined by various characteristics, including Indigenous identity, immigrant status, and racialized group.
Employment and unemployment
Women’s employment rate decreases, while their unemployment rate increases, as the areas become more remote
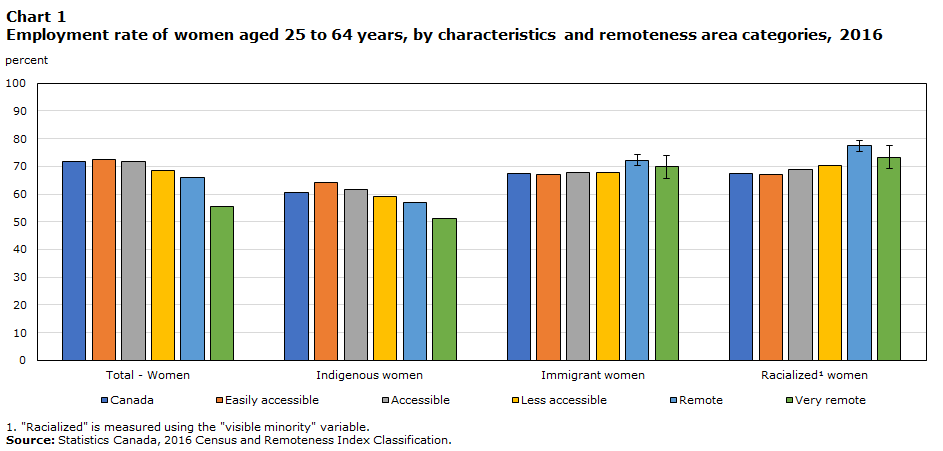
In 2016, more than 7 in 10 (71.6%) women aged 25 to 64 yearsNote were employedNote Note in Canada. The employment rate of women varied according to the level of remoteness of their communities. Specifically, the employment rate was highest in easily accessible areas and gradually decreased as the areas became more remote, ranging from 72.3% in easily accessible areas to 55.5% in very remote areas (Chart 1).
Data table for Chart 1
| Canada | Easily accessible | Accessible | Less accessible | Remote | Very remote | |||||||||||||
|---|---|---|---|---|---|---|---|---|---|---|---|---|---|---|---|---|---|---|
| Percent | 95% confidence interval | Percent | 95% confidence interval | Percent | 95% confidence interval | Percent | 95% confidence interval | Percent | 95% confidence interval | Percent | 95% confidence interval | |||||||
| lower | upper | lower | upper | lower | upper | lower | upper | lower | upper | lower | upper | |||||||
| percent | ||||||||||||||||||
| Total - Women | 71.6 | 71.6 | 71.6 | 72.3 | 72.3 | 72.3 | 71.7 | 71.7 | 71.7 | 68.5 | 68.5 | 68.5 | 66.1 | 66.1 | 66.1 | 55.5 | 55.5 | 55.5 |
| Indigenous women | 60.4 | 60.4 | 60.4 | 64.1 | 64.1 | 64.1 | 61.8 | 61.8 | 61.8 | 59.1 | 59.1 | 59.1 | 57.1 | 57.1 | 57.1 | 51.2 | 51.2 | 51.2 |
| Immigrant women | 67.3 | 67.3 | 67.3 | 67.2 | 67.2 | 67.2 | 67.9 | 67.9 | 67.9 | 67.6 | 67.6 | 67.6 | 72.2 | 70.2 | 74.2 | 69.8 | 65.7 | 73.9 |
| RacializedData table for chart 1 Note 1 women | 67.4 | 67.4 | 67.4 | 67.2 | 67.2 | 67.2 | 68.7 | 68.7 | 68.7 | 70.2 | 70.2 | 70.2 | 77.4 | 75.4 | 79.4 | 73.3 | 69.2 | 77.4 |
|
||||||||||||||||||
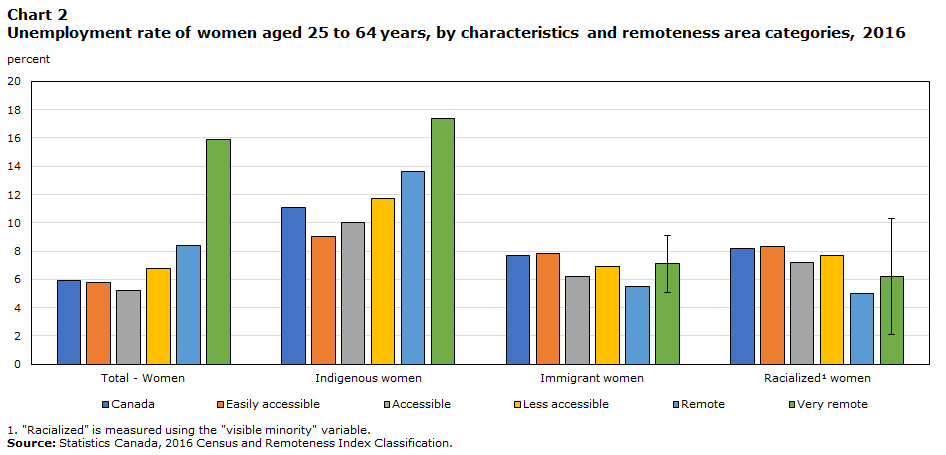
At the national level, the unemployment rateNote Note of women was 5.9% in 2016. Like the employment rate, the unemployment rate of women varied according to the level of remoteness of their communities, with lower unemployment rates observed in more accessible areas than in more remote areas. Of note, the unemployment rate was markedly higher in very remote areas, at 15.9%—a rate that was approximately three times greater than the rate in easily accessible (5.8%) and accessible (5.2%) areas (Chart 2).
Data table for Chart 2
| Canada | Easily accessible | Accessible | Less accessible | Remote | Very remote | |||||||||||||
|---|---|---|---|---|---|---|---|---|---|---|---|---|---|---|---|---|---|---|
| Percent | 95% confidence interval | Percent | 95% confidence interval | Percent | 95% confidence interval | Percent | 95% confidence interval | Percent | 95% confidence interval | Percent | 95% confidence interval | |||||||
| lower | upper | lower | upper | lower | upper | lower | upper | lower | upper | lower | upper | |||||||
| percent | ||||||||||||||||||
| Total - Women | 5.9 | 5.9 | 5.9 | 5.8 | 5.8 | 5.8 | 5.2 | 5.2 | 5.2 | 6.8 | 6.8 | 6.8 | 8.4 | 8.4 | 8.4 | 15.9 | 15.9 | 15.9 |
| Indigenous women | 11.1 | 11.1 | 11.1 | 9.0 | 9.0 | 9.0 | 10.0 | 10.0 | 10.0 | 11.7 | 11.7 | 11.7 | 13.6 | 13.6 | 13.6 | 17.4 | 17.4 | 17.4 |
| Immigrant women | 7.7 | 7.7 | 7.7 | 7.8 | 7.8 | 7.8 | 6.2 | 6.2 | 6.2 | 6.9 | 6.9 | 6.9 | 5.5 | 5.5 | 5.5 | 7.1 | 5.1 | 9.1 |
| RacializedData table for chart 2 Note 1 women | 8.2 | 8.2 | 8.2 | 8.3 | 8.3 | 8.3 | 7.2 | 7.2 | 7.2 | 7.7 | 7.7 | 7.7 | 5.0 | 5.0 | 5.0 | 6.2 | 2.1 | 10.3 |
|
||||||||||||||||||
That the employment rate was higher for women in more accessible areas, while the unemployment rate was lower in these areas, is consistent with previous research that has shown that women in rural areas have lower employment rates and higher unemployment rates than their counterparts in more accessible areas (Status of Women Canada, 2016).
The employment rate is higher and the unemployment rate is lower in more accessible areas for Indigenous women, but not for racialized and immigrant women
Like for all women in Canada, the employment rate of Indigenous women gradually decreased as the areas became more remote: almost two-thirds (64.1%) of Indigenous women in easily accessible areas were employed in 2016, compared to about half (51.2%) of Indigenous women in very remote areas (Chart 1). Similarly, the unemployment rate of Indigenous women increased as the areas became more remote. Notably, the unemployment rate of Indigenous women in very remote areas was almost double that of Indigenous women in easily accessible areas (17.4% vs. 9.0%, respectively; Chart 2).
Start of text boxIn this report, data on racialized women are measured using the “visible minority” variable. “Visible minority” refers to whether or not a person belongs to one of the visible minority groups defined by the Employment Equity Act. The Employment Equity Act defines visible minorities as “persons, other than Aboriginal peoples, who are non-Caucasian in race or non-white in colour.” The visible minority population consists mainly of the following groups: South Asian, Chinese, Black, Filipino, Latin American, Arab, Southeast Asian, West Asian, Korean, and Japanese. For the purpose of this study, Indigenous women are analyzed separately from racialized women.
Although the employment rate was higher and the unemployment rate was lower in more accessible areas for all women in Canada, as well as for Indigenous women, this was not the case for racialized and immigrant women.Note Rather, the employment rates of racialized women in remote and very remote areas—particularly the former—were higher than the employment rates of their counterparts living in more accessible (i.e., easily accessible and accessible) areas, while the employment rate of immigrant women in remote areas was higher than the employment rates of immigrant women in more accessible areas (Chart 1).
Further, the unemployment rates of racialized and immigrant women were lower in remote areas, compared to more accessible areas, particularly easily accessible areas (Chart 2). It is worth highlighting, nonetheless, that the vast majority of immigrant women and racialized women resided in more accessible areas in 2016 (Leclerc, 2021). As such, these patterns do not significantly affect the patterns in employment and unemployment rates across remoteness area categories observed for all women in Canada.
South Asian, Chinese, and Black women in remote areas have higher employment rates than their counterparts in more accessible areas
In 2016, South Asian women accounted for almost one-quarter (23.5%) of all racialized women aged 25 to 64 years in Canada, while 21.6% were Chinese, 14.0% were Black, and 12.2% were Filipino. At the national level, more than 4 in 5 (84.5%) Filipino women were employed in 2016, compared to 7 in 10 (70.2%) Black women and less than two-thirds of Chinese (65.8%) and South Asian (63.8%) women.
The pattern that was observed for all racialized women, wherein the employment rate was higher in remote and very remote areas than in more accessible areas, held true for Black women. Specifically, 83.3% of Black women in very remote areas and 78.1% in remote areas were employed in 2016, compared to 70.4% and 68.1% in easily accessible and accessible areas, respectively. Similarly, for South Asian and Chinese women, the employment rate was higher in remote areas than in more accessible areas: almost 3 in 4 (74.2%) South Asian women and 4 in 5 (78.3%) Chinese women in remote areas were employed in 2016, compared to less than two-thirds of South Asian (63.7%) and Chinese (65.7%) women in easily accessible areas. For Filipino women, the employment rates in easily accessible (84.6%) and accessible (84.3%) areas were comparable to the rate observed in remote areas (84.4%), but higher than the rate in very remote areas (75.5%).
In more remote areas, the employment rate of very recent immigrant women is comparable to more established immigrant women
Previous research has highlighted the diverse labour market experiences of immigrant women according to the number of years since they first obtained landed immigrant or permanent resident status in Canada. Newly arrived immigrants may experience a host of challenges that can impact their ability to obtain employment, including their foreign education credentials not being recognized in Canada and linguistic barriers, among others (Houle & Yssaad, 2010). In line with this, at the national level, the employment rate of immigrant women increased with the amount of time since they first obtained landed immigrant or permanent resident status (Table 1).
| Immigrant status | Remoteness area category | Percent | 95% confidence interval | |
|---|---|---|---|---|
| lower | upper | |||
| percent | ||||
| Very recent (2011-2016) | Canada | 56.8 | 56.8 | 56.8 |
| Easily accessible | 55.3 | 55.3 | 55.3 | |
| Accessible | 63.8 | 63.8 | 63.8 | |
| Less accessible | 67.3 | 65.3 | 69.3 | |
| Remote | 74.6 | 72.6 | 76.6 | |
| Very remote | 69.1 | 61.0 | 77.2 | |
| Recent (2006-2010) | Canada | 65.8 | 65.8 | 65.8 |
| Easily accessible | 65.3 | 65.3 | 65.3 | |
| Accessible | 68.9 | 68.9 | 68.9 | |
| Less accessible | 69.8 | 67.8 | 71.8 | |
| Remote | 74.6 | 70.5 | 78.7 | |
| Very remote | 70.5 | 60.3 | 80.7 | |
| Established before 2006 | Canada | 70.2 | 70.2 | 70.2 |
| Easily accessible | 70.3 | 70.3 | 70.3 | |
| Accessible | 69.0 | 69.0 | 69.0 | |
| Less accessible | 67.2 | 67.2 | 67.2 | |
| Remote | 70.9 | 68.9 | 72.9 | |
| Very remote | 69.3 | 65.2 | 73.4 | |
| Source: Statistics Canada, 2016 Census and Remoteness Index Classification. | ||||
Notably, this pattern did not hold across all remoteness area categories. In easily accessible areas (where most immigrant women lived in 2016; Leclerc, 2021), the employment rate was higher for established immigrant women, compared to recent and very recent immigrant women, mirroring what was observed at the national level. However, in more remote areas, the employment rates of very recent, recent, and established immigrant women were more comparable (Table 1).
As was observed for all immigrant women, for very recent immigrant women, the employment rate was higher in remote areas, compared to more accessible areas, especially easily accessible areas. Indeed, the employment rate of very recent immigrant women in remote areas was almost 20 percentage points higher than their counterparts living in easily accessible areas (74.6% vs. 55.3%, respectively). Similarly, the employment rate was higher for recent immigrant women in remote areas, compared to those in easily accessible areas. Unlike very recent and recent immigrant women, the employment rates of established immigrant women in easily accessible and remote areas were comparable (Table 1).
The divergent patterns in employment rates across remoteness area categories for these groups of women may be partially explained by differences in educational attainment. Previous research has highlighted the fact that education and employment are intricately connected (e.g., Frank et al., 2015; Reid et al., 2020). Indigenous women in more accessible areas had higher levels of educational attainment than Indigenous women in more remote areas in 2016. Conversely, immigrant women and racialized women in remote areas were more highly educated than their counterparts in more accessible areas (Leclerc, 2022).
Work activity
Full-time employment is associated with several positive outcomes, including, for example, job stability and higher employment income (Drolet, 2020; Statistics Canada, 2017b). At the national level, the majority (77.4%) of women who reported work activityNote in 2015 worked on a full-time basis, while 22.6% worked part time (Chart 3).

Data table for Chart 3
| Canada | Easily accessible | Accessible | Less accessible | Remote | Very remote | |||||||||||||
|---|---|---|---|---|---|---|---|---|---|---|---|---|---|---|---|---|---|---|
| Percent | 95% confidence interval | Percent | 95% confidence interval | Percent | 95% confidence interval | Percent | 95% confidence interval | Percent | 95% confidence interval | Percent | 95% confidence interval | |||||||
| lower | upper | lower | upper | lower | upper | lower | upper | lower | upper | lower | upper | |||||||
| percent | ||||||||||||||||||
| Full time | 77.4 | 77.4 | 77.4 | 78.4 | 78.4 | 78.4 | 75.2 | 75.0 | 75.4 | 75.4 | 75.2 | 75.6 | 74.7 | 74.5 | 74.9 | 79.3 | 78.9 | 79.7 |
| Part time | 22.6 | 22.6 | 22.6 | 21.7 | 21.7 | 21.7 | 24.8 | 24.6 | 25.0 | 24.6 | 24.4 | 24.8 | 25.3 | 25.1 | 25.5 | 20.7 | 20.3 | 21.1 |
| Source: Statistics Canada, 2016 Census and Remoteness Index Classification. | ||||||||||||||||||
There was little variation at the national level across characteristics. Specifically, more than three-quarters of Indigenous women (76.8%), immigrant women (76.5%), and racialized women (77.2%) who reported work activity in 2015 worked on a full-time basis (Chart 4). Further disaggregation revealed that the proportion of working racialized women who worked on a full-time basis was highest for Filipino women, with more than 4 in 5 (82.4%) working full time in 2015, followed by Chinese women, at 78.6%. About three-quarters of South Asian (76.7%) and Black (76.0%) women with work activity in 2015 worked full time.
Indigenous and racialized (especially Black) women with work activity in very remote areas are more likely than all women to work full time
The highest levels of full-time work were observed in very remote and easily accessible areas, where almost 4 in 5 women with work activity worked on a full-time basis. About three-quarters of working women in accessible, less accessible, and remote areas worked full time (Chart 3).
Like all women in Canada, the proportion of working women who worked full time was highest in very remote areas for both Indigenous and racialized women. Of note, Indigenous (81.5%) and racialized (86.1%) women in very remote areas who reported work activity in 2015 were more likely than all women in very remote areas (79.3%) to work on a full-time basis. What’s more, the gap between the proportion of working women who worked on a full-time basis in very remote areas and the other remoteness areas was even more pronounced for Indigenous and racialized women than it was for all women. For example, 79.3% of all women in very remote areas who worked in 2015 worked full time, compared to 78.4% in easily accessible areas, yielding a gap of about 1 percentage point. This gap widened to about 5 and 9 percentage points for Indigenous and racialized women, respectively (Chart 4).

Data table for Chart 4
| Canada | Easily accessible | Accessible | Less accessible | Remote | Very remote | |||||||||||||
|---|---|---|---|---|---|---|---|---|---|---|---|---|---|---|---|---|---|---|
| Percent | 95% confidence interval | Percent | 95% confidence interval | Percent | 95% confidence interval | Percent | 95% confidence interval | Percent | 95% confidence interval | Percent | 95% confidence interval | |||||||
| lower | upper | lower | upper | lower | upper | lower | upper | lower | upper | lower | upper | |||||||
| percent | ||||||||||||||||||
| Total - Women | 77.4 | 77.4 | 77.4 | 78.4 | 78.4 | 78.4 | 75.2 | 75.0 | 75.4 | 75.4 | 75.2 | 75.6 | 74.7 | 74.5 | 74.9 | 79.3 | 78.9 | 79.7 |
| Indigenous women | 76.8 | 76.4 | 77.2 | 76.7 | 76.1 | 77.3 | 75.2 | 74.6 | 75.8 | 76.2 | 75.4 | 77.0 | 77.5 | 76.9 | 78.1 | 81.5 | 81.1 | 81.9 |
| Immigrant women | 76.5 | 76.2 | 76.7 | 76.9 | 76.9 | 76.9 | 72.5 | 72.1 | 72.9 | 73.4 | 72.8 | 74.0 | 72.7 | 71.5 | 73.9 | 76.3 | 72.9 | 79.8 |
| RacializedData table for chart 4 Note 1 women | 77.2 | 77.0 | 77.4 | 77.3 | 77.1 | 77.5 | 75.2 | 74.8 | 75.6 | 77.7 | 76.9 | 78.5 | 79.3 | 77.4 | 81.1 | 86.1 | 82.6 | 89.5 |
|
||||||||||||||||||
Disaggregation by racialized group revealed a large gap in the proportions of working Black women who worked full time in very remote areas and the other remoteness area categories. The vast majority (96.2%) of Black women in very remote areas who reported work activity in 2015 worked on a full-time basis, compared to 76.2% of their counterparts in easily accessible areas, for example.
Although immigrant women in remote areas had a higher employment rate than immigrant women in easily accessible areas, they were less likely to work on a full-time basis (72.7% vs. 76.9%, respectively; Chart 4). Further disaggregation indicated that the proportion of very recent immigrant women with work activity who worked full time was higher in more remote areas (especially very remote areas) than it was in more accessible areas. In contrast, the proportion of working established immigrant women who worked on a full-time basis was lower in remote areas than in easily accessible areas (71.0% vs. 78.8%, respectively; Table 2).
| Immigrant status | Remoteness area category | Percent | 95% confidence interval | |
|---|---|---|---|---|
| lower | upper | |||
| percent | ||||
| Very recent (2011-2016) | Canada | 72.0 | 71.6 | 72.4 |
| Easily accessible | 71.7 | 71.3 | 72.1 | |
| Accessible | 72.7 | 71.7 | 73.7 | |
| Less accessible | 76.9 | 75.3 | 78.6 | |
| Remote | 76.7 | 73.9 | 79.6 | |
| Very remote | 84.6 | 77.5 | 91.7 | |
| Recent (2006-2010) | Canada | 72.5 | 72.3 | 72.7 |
| Easily accessible | 72.5 | 72.3 | 72.7 | |
| Accessible | 72.6 | 71.6 | 73.6 | |
| Less accessible | 72.4 | 69.9 | 74.8 | |
| Remote | 74.9 | 71.8 | 77.9 | |
| Very remote | 69.7 | 57.5 | 81.9 | |
| Established before 2006 | Canada | 78.2 | 78.0 | 78.4 |
| Easily accessible | 78.8 | 78.6 | 79.0 | |
| Accessible | 72.5 | 72.0 | 72.9 | |
| Less accessible | 72.2 | 71.0 | 73.4 | |
| Remote | 71.0 | 69.6 | 72.4 | |
| Very remote | 75.0 | 70.1 | 79.9 | |
| Source: Statistics Canada, 2016 Census and Remoteness Index Classification. | ||||
Industrial and occupational representation
Women’s over-representation in certain industries and occupations is generally less pronounced in more accessible areas
Women have historically been over-represented in industries and occupations that mirror traditional gender roles in the private sphere (Moyser, 2017). For example, women account for the majority of paid workers in jobs that involve the provision of care, which parallels the disproportionate share of unpaid care work shouldered by women (Khanam et al., 2022; Moyser & Burlock, 2018). At the same time, women have been—and continue to be—under-represented in certain industries and occupations, such as jobs in science, technology, engineering, and mathematics (STEM), as well as some leadership and decision-making positions (Moyser, 2017). Ensuring that women and men are equally represented in all industries and occupations not only allows all people to benefit from the positive outcomes afforded by certain industries and occupations, but also that industries and occupations traditionally over- and under-represented by women and men are enriched by diverse perspectives and skillsets.
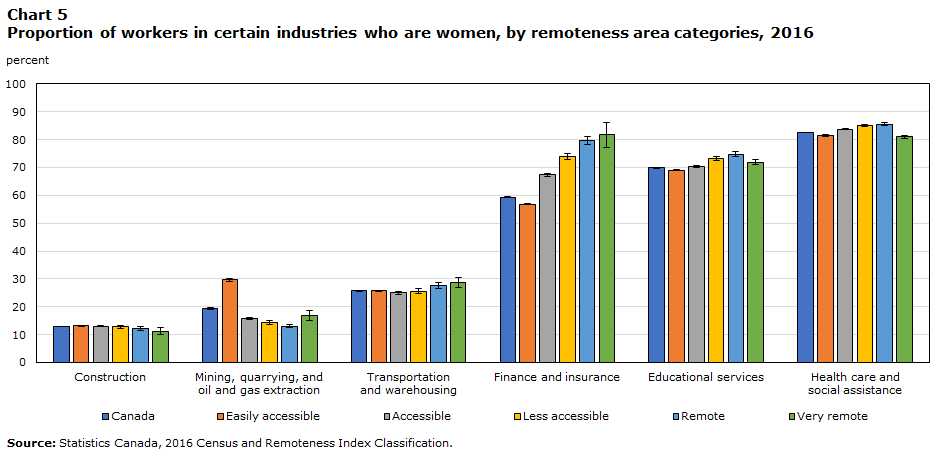
In 2016, the top three industries in which women were over-represented (i.e., women comprised more than half of those employed in those industries) at the national level were: health care and social assistance (82.4%); educational services (69.8%); and, finance and insurance (59.4%). In contrast, the top three industries in which women were under-represented (i.e., women comprised less than half of those employed in those industries) were: construction (13.0%); mining, quarrying, and oil and gas extraction (19.4%); and, transportation and warehousing (25.7%; Chart 5).
Data table for Chart 5
| Canada | Easily accessible | Accessible | Less accessible | Remote | Very remote | |||||||||||||
|---|---|---|---|---|---|---|---|---|---|---|---|---|---|---|---|---|---|---|
| Percent | 95% confidence interval | Percent | 95% confidence interval | Percent | 95% confidence interval | Percent | 95% confidence interval | Percent | 95% confidence interval | Percent | 95% confidence interval | |||||||
| lower | upper | lower | upper | lower | upper | lower | upper | lower | upper | lower | upper | |||||||
| percent | ||||||||||||||||||
| Construction | 13.0 | 13.0 | 13.0 | 13.1 | 12.9 | 13.3 | 13.0 | 12.8 | 13.2 | 12.8 | 12.3 | 13.2 | 12.2 | 11.6 | 12.8 | 11.2 | 10.0 | 12.4 |
| Mining, quarrying, and oil and gas extraction | 19.4 | 19.2 | 19.6 | 29.6 | 29.0 | 30.2 | 15.7 | 15.3 | 16.1 | 14.3 | 13.6 | 14.9 | 13.0 | 12.4 | 13.6 | 16.8 | 14.9 | 18.6 |
| Transportation and warehousing | 25.7 | 25.5 | 25.9 | 25.8 | 25.5 | 26.0 | 24.9 | 24.5 | 25.3 | 25.6 | 24.8 | 26.4 | 27.7 | 26.7 | 28.7 | 28.8 | 27.0 | 30.6 |
| Finance and insurance | 59.4 | 59.1 | 59.6 | 56.8 | 56.6 | 57.0 | 67.3 | 66.9 | 67.7 | 73.9 | 72.7 | 75.1 | 79.7 | 78.3 | 81.2 | 81.8 | 77.3 | 86.3 |
| Educational services | 69.8 | 69.6 | 70.0 | 69.1 | 68.9 | 69.3 | 70.3 | 69.9 | 70.7 | 73.3 | 72.7 | 73.9 | 74.8 | 73.9 | 75.6 | 71.9 | 71.1 | 72.7 |
| Health care and social assistance | 82.4 | 82.4 | 82.4 | 81.5 | 81.3 | 81.7 | 83.8 | 83.6 | 84.0 | 85.1 | 84.7 | 85.5 | 85.6 | 85.2 | 86.0 | 81.0 | 80.4 | 81.6 |
| Source: Statistics Canada, 2016 Census and Remoteness Index Classification. | ||||||||||||||||||
Women were over- and under-represented in these industries across all remoteness area categories (see Table A.1 in Appendix A). Notably, women’s representation in finance and insurance was considerably higher in more remote areas, compared to more accessible areas: whereas women comprised 56.8% of those employed in this industry in easily accessible areas, more than 4 in 5 (81.8%) people employed in the industry in very remote areas were women. Similarly, women’s representation in both educational services and health care and social assistance was higher in remote areas, compared to easily accessible areas (Chart 5).
Conversely, women’s representation in mining, quarrying, and oil and gas extraction was markedly higher in easily accessible areas (29.6%) than in the other remoteness area categories (Chart 5). It should be noted that this study did not examine the types of occupations held by women within the industries in which they were over- and under-represented. As such, it is not possible to ascertain whether women’s higher representation in the mining, quarrying, and oil and gas extraction industry in easily accessible areas is attributable to greater representation in manual labour, or, conversely, administrative occupations, for example.
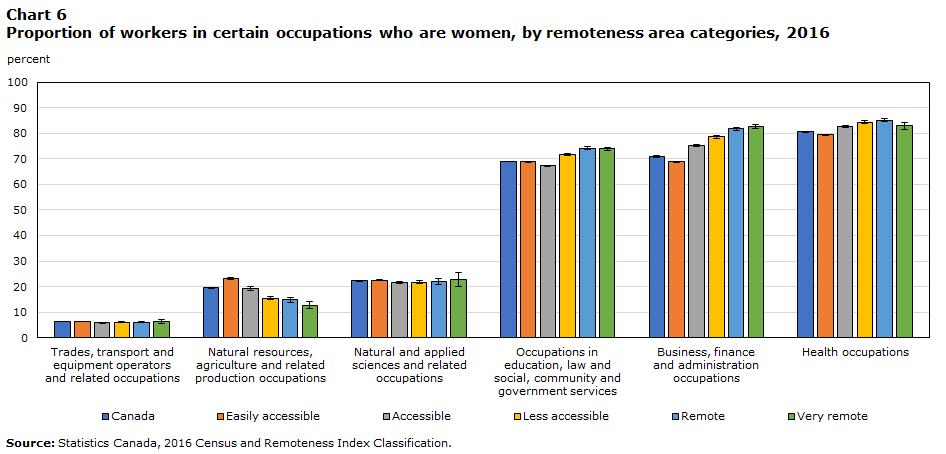
In 2016, the top three occupational categories in which women were over-represented were: health occupations (80.7%); business, finance and administration occupations (70.9%); and, occupations in education, law and social, community and government services (69.0%). In contrast, the top three occupational categories in which women were under-represented were: trades, transport and equipment operators and related occupations (6.2%); natural resources, agriculture and related production occupations (19.5%); and, natural and applied sciences and related occupations (22.3%; Chart 6).
Data table for Chart 6
| Canada | Easily accessible | Accessible | Less accessible | Remote | Very remote | |||||||||||||
|---|---|---|---|---|---|---|---|---|---|---|---|---|---|---|---|---|---|---|
| Percent | 95% confidence interval | Percent | 95% confidence interval | Percent | 95% confidence interval | Percent | 95% confidence interval | Percent | 95% confidence interval | Percent | 95% confidence interval | |||||||
| lower | upper | lower | upper | lower | upper | lower | upper | lower | upper | lower | upper | |||||||
| percent | ||||||||||||||||||
| Trades, transport and equipment operators and related occupations | 6.2 | 6.2 | 6.2 | 6.4 | 6.4 | 6.4 | 5.8 | 5.6 | 6.0 | 6.1 | 5.9 | 6.3 | 6.0 | 5.8 | 6.2 | 6.4 | 5.7 | 7.0 |
| Natural resources, agriculture and related production occupations | 19.5 | 19.3 | 19.7 | 23.2 | 22.8 | 23.6 | 19.3 | 18.7 | 19.9 | 15.5 | 14.9 | 16.1 | 14.8 | 13.9 | 15.6 | 12.8 | 11.3 | 14.2 |
| Natural and applied sciences and related occupations | 22.3 | 22.1 | 22.5 | 22.6 | 22.3 | 22.8 | 21.5 | 21.1 | 21.9 | 21.7 | 21.1 | 22.3 | 22.0 | 20.8 | 23.3 | 22.8 | 20.1 | 25.4 |
| Occupations in education, law and social, community and government services | 69.0 | 69.0 | 69.0 | 68.9 | 68.6 | 69.1 | 67.3 | 67.1 | 67.5 | 71.8 | 71.4 | 72.2 | 74.2 | 73.6 | 74.8 | 74.0 | 73.4 | 74.6 |
| Business, finance and administration occupations | 70.9 | 70.7 | 71.1 | 68.8 | 68.6 | 69.0 | 75.2 | 75.0 | 75.4 | 78.6 | 78.2 | 79.0 | 81.7 | 81.1 | 82.3 | 82.8 | 82.0 | 83.6 |
| Health occupations | 80.7 | 80.5 | 80.9 | 79.4 | 79.2 | 79.6 | 82.5 | 82.1 | 82.9 | 84.4 | 84.0 | 84.8 | 85.1 | 84.4 | 85.7 | 82.9 | 81.5 | 84.4 |
| Source: Statistics Canada, 2016 Census and Remoteness Index Classification. | ||||||||||||||||||
Women were over- and under-represented in these occupational categories across all remoteness areas (see Table A.2 in Appendix A), although their representation in these occupational categories sometimes varied according to the remoteness area. For example, women’s over-representation in occupations in education, law and social, community and government services, business, finance and administration occupations, and health occupations was generally more pronounced in more remote areas than in more accessible areas. Conversely, women's representation in natural resources, agriculture and related production occupations was lower in more remote areas than in more accessible areas (Chart 6).
Despite the proportion of women who had an apprenticeship, trades certificate or diploma as their highest level of education being higher in more remote areas than in more accessible areas (Leclerc, 2022), this did not translate into increased representation of women in trades, transport and equipment operators and related occupations in more remote areas. Rather, the proportions of people employed in trades, transport and equipment operators and related occupations who were women were comparable in easily accessible and very remote areas (6.4% in each).
Women’s representation in management occupations is highest in very remote areas
In recent years, particular attention has been given to women’s (under-)representation in STEM occupations, and, by consequence, increasing their representation in these occupations. Indeed, increasing women’s representation in STEM occupations not only serves to diversify these jobs that have traditionally been dominated by men, but also to increase women’s economic prosperity, given that science and technology occupations, especially those in engineering and computer science, are among the highest-paying occupations (Wall, 2019).
In 2016, more than 1 in 5 (22.3%) of those employed in natural and applied sciences and related occupationsNote in Canada were women. Notably, the share of women with a postsecondary qualification in STEM was highest in easily accessible areas (11.6%), whereas it was lowest in very remote areas (5.4%; Leclerc, 2022). This, however, did not translate into greater representation of women in STEM occupations in easily accessible areas, compared to very remote areas. Rather, women’s representation in natural and applied sciences and related occupations was comparable in easily accessible (22.6%) and very remote (22.8%) areas (Chart 6).
Like women’s representation in STEM occupations, particular attention has been given in recent years to increasing women’s representation in leadership and decision-making positions, including management positions. In 2016, women were under-represented in management occupations in Canada, representing almost 2 in 5 (38.3%) of those employed in these occupations. Of note, however, women’s representation in these occupations was highest in very remote areas, where 44.5% of those employed in these occupations were women (compared to, for example, 38.5% in easily accessible areas; see Table A.2 in Appendix A).
Employment income
Women’s median annual employment income is higher in more accessible areas than in more remote areas
In 2015, the median annual employment incomeNote of women who reported work activityNote was $37,600. The median annual employment income of women gradually decreased as the areas became more remote: in easily accessible areas, the median annual employment income was $38,800, compared to $29,200 in very remote areas (Chart 7). That the median annual employment income was lowest in very remote areas is particularly notable, given that the proportion of working women who worked on a full-time basis was highest in very remote areas.

Data table for Chart 7
| Canada | Easily accessible | Accessible | Less accessible | Remote | Very remote | |||||||||||||
|---|---|---|---|---|---|---|---|---|---|---|---|---|---|---|---|---|---|---|
| Dollars | 95% confidence interval | Dollars | 95% confidence interval | Dollars | 95% confidence interval | Dollars | 95% confidence interval | Dollars | 95% confidence interval | Dollars | 95% confidence interval | |||||||
| lower | upper | lower | upper | lower | upper | lower | upper | lower | upper | lower | upper | |||||||
| dollars | ||||||||||||||||||
| Total - Women | 37,600 | 37,557 | 37,643 | 38,800 | 38,745 | 38,855 | 36,800 | 36,710 | 36,890 | 33,200 | 33,070 | 33,330 | 31,000 | 30,849 | 31,151 | 29,200 | 28,723 | 29,677 |
| Indigenous women | 32,800 | 32,570 | 33,030 | 36,400 | 35,960 | 36,840 | 32,800 | 32,295 | 33,305 | 30,600 | 29,875 | 31,325 | 30,800 | 30,389 | 31,211 | 29,600 | 29,168 | 30,032 |
| Immigrant women | 33,600 | 33,523 | 33,677 | 33,600 | 33,521 | 33,679 | 32,800 | 32,476 | 33,124 | 31,600 | 30,997 | 32,203 | 31,200 | 30,361 | 32,039 | 34,800 | 32,396 | 37,204 |
| RacializedData table for chart 7 Note 1 women | 32,400 | 32,331 | 32,469 | 32,800 | 32,723 | 32,877 | 31,000 | 30,678 | 31,322 | 30,600 | 29,899 | 31,301 | 31,000 | 30,039 | 31,961 | 40,400 | 34,126 | 46,674 |
|
||||||||||||||||||
Unlike Indigenous women, the median annual employment income of racialized women is highest in very remote areas
The median annual employment income of Indigenous women across remoteness area categories followed a similar pattern as what was observed for all women in Canada, with higher median annual employment incomes observed in more accessible areas than in more remote areas. For example, the median annual employment income was higher for Indigenous women in easily accessible areas than for those in very remote areas ($36,400 vs. $29,600, respectively). In contrast, the median annual employment income of racialized womenNote in very remote areas ($40,400) was higher than that of their counterparts in the other remoteness areas.
For immigrant women, the median annual employment income of those in easily accessible areas was comparable to that of their counterparts in very remote areas ($33,600 vs. $34,800, respectively; Chart 7). Although the median annual employment income was higher at the national level for established immigrant women, compared to very recent immigrant women, this gap narrowed as the areas became more remote, due to higher median employment incomes of very recent immigrant women in more remote areas, compared to more accessible areas—a finding that was not observed for established immigrant women. In fact, the opposite was true for established immigrant women, for whom the median annual employment income was higher in easily accessible areas compared to the other remoteness areas, especially remote areas (Table 3).
| Immigrant status | Remoteness area category | Dollars | 95% confidence interval | |
|---|---|---|---|---|
| lower | upper | |||
| dollars | ||||
| Very recent (2011-2016) | Canada | 22,600 | 22,443 | 22,757 |
| Easily accessible | 22,000 | 21,857 | 22,143 | |
| Accessible | 25,600 | 25,107 | 26,093 | |
| Less accessible | 27,600 | 26,704 | 28,496 | |
| Remote | 27,800 | 26,928 | 28,672 | |
| Very remote | 34,800 | 28,689 | 40,911 | |
| Recent (2006-2010) | Canada | 27,400 | 27,180 | 27,620 |
| Easily accessible | 27,000 | 26,784 | 27,216 | |
| Accessible | 30,600 | 29,875 | 31,325 | |
| Less accessible | 31,200 | 29,550 | 32,850 | |
| Remote | 31,600 | 29,033 | 34,167 | |
| Very remote | 28,600 | 16,541 | 40,659 | |
| Established before 2006 | Canada | 38,000 | 37,894 | 38,106 |
| Easily accessible | 38,000 | 37,898 | 38,102 | |
| Accessible | 36,400 | 35,903 | 36,897 | |
| Less accessible | 34,400 | 33,496 | 35,304 | |
| Remote | 33,200 | 32,084 | 34,316 | |
| Very remote | 35,600 | 33,522 | 37,678 | |
| Source: Statistics Canada, 2016 Census and Remoteness Index Classification. | ||||
Conclusion
Overall, women in more accessible areas of Canada generally fared better than their counterparts in more remote areas on a number of labour characteristics. Specifically, the employment rate of women was higher, while their unemployment rate was lower, in more accessible areas than in more remote areas. The median annual employment income of women in more accessible areas was also higher than that of women in more remote areas. What’s more, for many of the industries and occupations in which women were over-represented, this over-representation was generally less pronounced in more accessible areas. Finally, the proportion of working women who worked on a full-time basis was higher in easily accessible areas than the other remoteness areas (except very remote areas).
An intersectional analysis revealed that these patterns held true for some, but not all, of the groups of women that were examined. Like for all women, Indigenous women living in more accessible areas generally fared better than Indigenous women in more remote areas, as evidenced by the higher employment rate, the lower unemployment rate, and the higher median annual employment income in more accessible areas, compared to more remote areas. At the same time, the proportion of working Indigenous women who worked on a full-time basis was highest in very remote areas (as it was for all women).
Unlike all women and Indigenous women, racialized women in more remote areas generally fared better than their counterparts in more accessible areas on the labour characteristics that were studied. In particular, the employment rate was higher in remote and very remote areas, relative to more accessible areas, while the unemployment rate was lower in remote areas than it was in more accessible areas. Further, the proportion of working racialized women, especially Black women, who worked on a full-time basis was higher in very remote areas, compared to more accessible areas, as was the median annual employment income.
For immigrant women, particularly very recent and recent immigrant women, those living in remote areas had a higher employment rate than their immigrant counterparts in more accessible areas. On the other hand, both the proportion of working immigrant women who worked on a full-time basis and the median annual employment income were lower in remote areas than they were in easily accessible areas. This held true for established immigrant women, but not for very recent immigrant women, for whom the proportion of working women who worked full time, as well as the median annual employment income, were higher in more remote areas than more accessible areas.
Certain factors outside the scope of this study may partially explain some of the patterns observed. Research has demonstrated that motherhood, including the age of the youngest child in the household, as well as lone parenthood, are associated with employment. For example, lone mothers have a lower employment rate than mothers in couples (Moyser, 2017). In 2016, very remote areas had the highest proportion of lone parent families, and almost three-quarters (72.2%) of lone parent families in these areas were headed by women (Leclerc, 2021). As such, the lower employment in very remote areas observed for all women in Canada may be partially related to the higher proportion of lone mothers in these areas.
In conclusion, the findings of this research suggest that some groups of women fare better on a number of labour characteristics in easily accessible areas, while other groups of women fare better in more remote areas. Evidently, then, to fully and accurately understand the labour characteristics of women in Canada, it is necessary to not only examine how these characteristics vary according to the areas in which they reside, but also how these experiences differ for diverse groups of women. In so doing, local, provincial/territorial, and federal policies and programs can be developed and refined to support the economic participation and prosperity of all women in Canada—irrespective of where they live.
Data sources, methods, and definitions
Data sources
Using the 2016 Long-Form Census of Population and the updated Remoteness Index Classification, this fourth paper of the series examines the labour characteristics of women by the relative remoteness of their communities.
Definitions and Measure
Census of Population
Statistics Canada conducts the Census of Population every five years. It is designed to provide information about people and housing units in Canada by their demographic, social and economic characteristics. The census is the primary source of socioeconomic data for specific population groups and for detailed or small geographies. A sample of approximately 25% of Canadian households received a long-form questionnaire. All other households received a short-form questionnaire. It means that while demographic information is collected from 100% of the population,Note a random sample of 1 in 4 private dwellings in Canada is selected systematically for the long-form questionnaire. For more information about the 2016 Census and the long-form and short-form questionnaire, please consult the Census of Population documentation.
Remoteness area categories definition and measure
The concepts of urban and rural areas are not clearly defined as several alternative definitions of “urban” and “rural” exist – depending on a country’s geopolitical and sociodemographic composition, but also on the questions or issues being studied (du Plessis et al., 2001). In Canada, population centres (POPCTRs) or census metropolitan influenced zones (MIZs) have been widely used to distinguish urban and rural communities. POPCTRs classify all communities with a population of less than 1,000 and with a density of less than 400 people per square kilometer as rural (Statistics Canada, 2017c). MIZs subdivide statistical area classifications according to the degree of influence of a census metropolitan area or census agglomeration based on the percentage of the population that commutes to work in one or more of these areas (Statistics Canada, 2016).
However, neither of these classifications clearly distinguish Canadian communities into urban, rural and remote areas. The concept of POPCTRs takes into account population size and density, but ignores proximity to large urban centres that may provide goods and services to small towns (Subedi et al., 2020). The concept of MIZ does not precisely measure the access to goods and services available within or in proximity to a community and, furthermore, it groups together all Canadian census subdivisions (CSDs) within the territories, despite the fact that some areas are more accessible than others (Subedi et al., 2020).
Proximity to centres of economic activity and population agglomerations have long been recognized as important determinants of socioeconomic opportunities and outcomes of regions (Alasia et al., 2017). In Canada, which is a large country with urban, rural, remote and very remote areas, the urban, rural and remote classification becomes even more important to better describe and understand the specific and very different realities of diverse communities.
Statistics Canada recently developed a new remoteness index (RI) which assigns a relative remoteness value to each CSD, based on proximity to agglomerations, and which also captures the dimension of the accessibility of services in these communities (Alasia et al., 2017; Subedi et al., 2020). The RI was developed by combining data from official statistical sources like the Census of Population with data from non-official statistical sources such as Google Map API (Alasia et al., 2017). The RI took a CSD as the geographic unit of analysis, and the index value was computed by combining the geographic layers of the CSD and the POPCTR (Alasia et al., 2017; Subedi et al., 2020). Each CSD’s RI value was determined based on the CSD’s relative proximity to all surrounding POPCTRs (Subedi et al., 2020). The population size of each POPCTR was used as a proxy for service availability. The RI calculation accounts for all POPCTRs that could be potential locations for goods, services and economic activities for the reference CSD (Alasia et al., 2017; Subedi et al., 2020). For this study, we use the updated RI, which includes index values for all CSDs in Canada that reported a population in 2016.
Although the RI is a continuous scale (from 0 to 1, where 0 is the most accessible (easily accessible) area and 1 is the least accessible (very remote) area), the new RI classification allows the grouping of CSDs by their relative remoteness into five categories: easily accessible; accessible; less accessible; remote; and, very remote areas (Subedi et al., 2020).
Appendix A
| Industry | Remoteness area category | Percent | 95% confidence interval | |
|---|---|---|---|---|
| lower | upper | |||
| percent | ||||
| Agriculture, forestry, fishing and hunting | Canada | 31.0 | 30.8 | 31.2 |
| Easily accessible | 36.6 | 36.2 | 37.0 | |
| Accessible | 31.1 | 30.7 | 31.5 | |
| Less accessible | 27.1 | 26.4 | 27.7 | |
| Remote | 24.1 | 23.3 | 24.9 | |
| Very remote | 21.2 | 18.9 | 23.4 | |
| Mining, quarrying, and oil and gas extraction | Canada | 19.4 | 19.2 | 19.6 |
| Easily accessible | 29.6 | 29.0 | 30.2 | |
| Accessible | 15.7 | 15.3 | 16.1 | |
| Less accessible | 14.3 | 13.6 | 14.9 | |
| Remote | 13.0 | 12.4 | 13.6 | |
| Very remote | 16.8 | 14.9 | 18.6 | |
| Utilities | Canada | 26.7 | 26.0 | 27.3 |
| Easily accessible | 29.4 | 28.6 | 30.2 | |
| Accessible | 24.5 | 23.7 | 25.3 | |
| Less accessible | 20.6 | 19.1 | 22.0 | |
| Remote | 14.6 | 13.2 | 16.0 | |
| Very remote | 15.0 | 12.8 | 17.3 | |
| Construction | Canada | 13.0 | 13.0 | 13.0 |
| Easily accessible | 13.1 | 12.9 | 13.3 | |
| Accessible | 13.0 | 12.8 | 13.2 | |
| Less accessible | 12.8 | 12.3 | 13.2 | |
| Remote | 12.2 | 11.6 | 12.8 | |
| Very remote | 11.2 | 10.0 | 12.4 | |
| Manufacturing | Canada | 28.2 | 28.0 | 28.4 |
| Easily accessible | 29.7 | 29.5 | 29.9 | |
| Accessible | 24.6 | 24.4 | 24.8 | |
| Less accessible | 21.7 | 21.1 | 22.3 | |
| Remote | 24.5 | 23.7 | 25.3 | |
| Very remote | 28.2 | 25.7 | 30.6 | |
| Wholesale trade | Canada | 32.8 | 32.5 | 33.0 |
| Easily accessible | 34.5 | 34.3 | 34.7 | |
| Accessible | 27.1 | 26.4 | 27.7 | |
| Less accessible | 25.8 | 24.8 | 26.9 | |
| Remote | 26.8 | 25.1 | 28.4 | |
| Very remote | 30.1 | 23.2 | 37.0 | |
| Retail trade | Canada | 53.5 | 53.3 | 53.7 |
| Easily accessible | 52.4 | 52.2 | 52.6 | |
| Accessible | 55.0 | 54.6 | 55.4 | |
| Less accessible | 57.1 | 56.5 | 57.7 | |
| Remote | 58.7 | 57.9 | 59.6 | |
| Very remote | 58.9 | 57.2 | 60.5 | |
| Transportation and warehousing | Canada | 25.7 | 25.5 | 25.9 |
| Easily accessible | 25.8 | 25.5 | 26.0 | |
| Accessible | 24.9 | 24.5 | 25.3 | |
| Less accessible | 25.6 | 24.8 | 26.4 | |
| Remote | 27.7 | 26.7 | 28.7 | |
| Very remote | 28.8 | 27.0 | 30.6 | |
| Information and cultural industries | Canada | 41.2 | 41.0 | 41.4 |
| Easily accessible | 40.3 | 40.1 | 40.5 | |
| Accessible | 44.1 | 43.5 | 44.8 | |
| Less accessible | 46.7 | 45.3 | 48.2 | |
| Remote | 49.5 | 46.8 | 52.1 | |
| Very remote | 55.5 | 49.1 | 61.8 | |
| Finance and insurance | Canada | 59.4 | 59.1 | 59.6 |
| Easily accessible | 56.8 | 56.6 | 57.0 | |
| Accessible | 67.3 | 66.9 | 67.7 | |
| Less accessible | 73.9 | 72.7 | 75.1 | |
| Remote | 79.7 | 78.3 | 81.2 | |
| Very remote | 81.8 | 77.3 | 86.3 | |
| Real estate and rental and leasing | Canada | 46.0 | 45.5 | 46.4 |
| Easily accessible | 45.8 | 45.4 | 46.2 | |
| Accessible | 47.4 | 46.4 | 48.4 | |
| Less accessible | 44.9 | 43.0 | 46.7 | |
| Remote | 46.2 | 43.2 | 49.3 | |
| Very remote | 36.1 | 33.5 | 38.8 | |
| Professional, scientific and technical services | Canada | 44.9 | 44.7 | 45.1 |
| Easily accessible | 44.0 | 43.8 | 44.2 | |
| Accessible | 47.2 | 46.6 | 47.8 | |
| Less accessible | 51.6 | 50.8 | 52.4 | |
| Remote | 55.3 | 54.0 | 56.5 | |
| Very remote | 47.2 | 43.5 | 50.9 | |
| Management of companies and enterprises | Canada | 56.3 | 55.0 | 57.5 |
| Easily accessible | 56.8 | 55.6 | 58.0 | |
| Accessible | 53.3 | 50.7 | 56.0 | |
| Less accessible | 59.4 | 53.3 | 65.5 | |
| Remote | 47.1 | 37.9 | 56.2 | |
| Very remote | 83.3 | 69.9 | 96.8 | |
| Administrative and support, waste management and remediation services | Canada | 44.9 | 44.7 | 45.1 |
| Easily accessible | 44.4 | 44.2 | 44.6 | |
| Accessible | 46.0 | 45.6 | 46.4 | |
| Less accessible | 46.8 | 45.8 | 47.8 | |
| Remote | 48.7 | 46.8 | 50.5 | |
| Very remote | 43.1 | 40.3 | 46.0 | |
| Educational services | Canada | 69.8 | 69.6 | 70.0 |
| Easily accessible | 69.1 | 68.9 | 69.3 | |
| Accessible | 70.3 | 69.9 | 70.7 | |
| Less accessible | 73.3 | 72.7 | 73.9 | |
| Remote | 74.8 | 73.9 | 75.6 | |
| Very remote | 71.9 | 71.1 | 72.7 | |
| Health care and social assistance | Canada | 82.4 | 82.4 | 82.4 |
| Easily accessible | 81.5 | 81.3 | 81.7 | |
| Accessible | 83.8 | 83.6 | 84.0 | |
| Less accessible | 85.1 | 84.7 | 85.5 | |
| Remote | 85.6 | 85.2 | 86.0 | |
| Very remote | 81.0 | 80.4 | 81.6 | |
| Arts, entertainment and recreation | Canada | 49.4 | 49.0 | 49.8 |
| Easily accessible | 48.7 | 48.3 | 49.1 | |
| Accessible | 51.5 | 50.6 | 52.3 | |
| Less accessible | 52.6 | 50.9 | 54.2 | |
| Remote | 48.8 | 46.9 | 50.6 | |
| Very remote | 43.6 | 40.5 | 46.6 | |
| Accommodation and food services | Canada | 58.0 | 57.8 | 58.2 |
| Easily accessible | 55.2 | 55.0 | 55.4 | |
| Accessible | 61.9 | 61.4 | 62.3 | |
| Less accessible | 68.6 | 67.7 | 69.4 | |
| Remote | 69.7 | 68.5 | 71.0 | |
| Very remote | 69.0 | 66.5 | 71.4 | |
| Other services (except public administration) | Canada | 55.5 | 55.3 | 55.7 |
| Easily accessible | 56.9 | 56.7 | 57.1 | |
| Accessible | 52.9 | 52.4 | 53.3 | |
| Less accessible | 51.8 | 51.0 | 52.6 | |
| Remote | 51.8 | 50.8 | 52.8 | |
| Very remote | 48.7 | 45.6 | 51.7 | |
| Public administration | Canada | 48.1 | 47.9 | 48.3 |
| Easily accessible | 49.0 | 48.8 | 49.2 | |
| Accessible | 45.5 | 45.3 | 45.7 | |
| Less accessible | 48.4 | 47.8 | 49.0 | |
| Remote | 47.7 | 47.1 | 48.3 | |
| Very remote | 46.0 | 45.1 | 46.8 | |
| Source: Statistics Canada, 2016 Census and Remoteness Index Classification. | ||||
| Occupation | Remoteness area category | Percent | 95% confidence interval | |
|---|---|---|---|---|
| lower | upper | |||
| percent | ||||
| Management occupations | Canada | 38.3 | 38.1 | 38.5 |
| Easily accessible | 38.5 | 38.3 | 38.7 | |
| Accessible | 37.6 | 37.3 | 37.8 | |
| Less accessible | 38.3 | 37.9 | 38.7 | |
| Remote | 39.2 | 38.6 | 39.8 | |
| Very remote | 44.5 | 42.9 | 46.1 | |
| Business, finance and administration occupations | Canada | 70.9 | 70.7 | 71.1 |
| Easily accessible | 68.8 | 68.6 | 69.0 | |
| Accessible | 75.2 | 75.0 | 75.4 | |
| Less accessible | 78.6 | 78.2 | 79.0 | |
| Remote | 81.7 | 81.1 | 82.3 | |
| Very remote | 82.8 | 82.0 | 83.6 | |
| Natural and applied sciences and related occupations | Canada | 22.3 | 22.1 | 22.5 |
| Easily accessible | 22.6 | 22.3 | 22.8 | |
| Accessible | 21.5 | 21.1 | 21.9 | |
| Less accessible | 21.7 | 21.1 | 22.3 | |
| Remote | 22.0 | 20.8 | 23.3 | |
| Very remote | 22.8 | 20.1 | 25.4 | |
| Health occupations | Canada | 80.7 | 80.5 | 80.9 |
| Easily accessible | 79.4 | 79.2 | 79.6 | |
| Accessible | 82.5 | 82.1 | 82.9 | |
| Less accessible | 84.4 | 84.0 | 84.8 | |
| Remote | 85.1 | 84.4 | 85.7 | |
| Very remote | 82.9 | 81.5 | 84.4 | |
| Occupations in education, law and social, community and government services | Canada | 69.0 | 69.0 | 69.0 |
| Easily accessible | 68.9 | 68.6 | 69.1 | |
| Accessible | 67.3 | 67.1 | 67.5 | |
| Less accessible | 71.8 | 71.4 | 72.2 | |
| Remote | 74.2 | 73.6 | 74.8 | |
| Very remote | 74.0 | 73.4 | 74.6 | |
| Occupations in art, culture, recreation and sport | Canada | 53.8 | 53.6 | 54.0 |
| Easily accessible | 52.1 | 51.7 | 52.5 | |
| Accessible | 59.2 | 58.3 | 60.0 | |
| Less accessible | 63.8 | 62.6 | 65.0 | |
| Remote | 63.3 | 61.2 | 65.3 | |
| Very remote | 59.0 | 56.0 | 62.1 | |
| Sales and service occupations | Canada | 57.7 | 57.7 | 57.7 |
| Easily accessible | 55.7 | 55.5 | 55.9 | |
| Accessible | 60.8 | 60.6 | 61.0 | |
| Less accessible | 65.0 | 64.5 | 65.4 | |
| Remote | 67.5 | 66.6 | 68.3 | |
| Very remote | 57.6 | 56.8 | 58.4 | |
| Trades, transport and equipment operators and related occupations | Canada | 6.2 | 6.2 | 6.2 |
| Easily accessible | 6.4 | 6.4 | 6.4 | |
| Accessible | 5.8 | 5.6 | 6.0 | |
| Less accessible | 6.1 | 5.9 | 6.3 | |
| Remote | 6.0 | 5.8 | 6.2 | |
| Very remote | 6.4 | 5.7 | 7.0 | |
| Natural resources, agriculture and related production occupations | Canada | 19.5 | 19.3 | 19.7 |
| Easily accessible | 23.2 | 22.8 | 23.6 | |
| Accessible | 19.3 | 18.7 | 19.9 | |
| Less accessible | 15.5 | 14.9 | 16.1 | |
| Remote | 14.8 | 13.9 | 15.6 | |
| Very remote | 12.8 | 11.3 | 14.2 | |
| Occupations in manufacturing and utilities | Canada | 29.9 | 29.7 | 30.1 |
| Easily accessible | 32.8 | 32.5 | 33.0 | |
| Accessible | 24.0 | 23.4 | 24.6 | |
| Less accessible | 19.8 | 19.0 | 20.6 | |
| Remote | 23.3 | 22.3 | 24.3 | |
| Very remote | 22.5 | 20.0 | 24.9 | |
| Source: Statistics Canada, 2016 Census and Remoteness Index Classification. | ||||
References
Alasia, A., Bédard, F., Bélanger, J., Guimond, E., & Penney, C. (2017). Measuring remoteness and accessibility: A set of indices for Canadian communities. Reports on Special Business Products (Catalogue No. 18-001-X). https://www150.statcan.gc.ca/n1/pub/18-001-x/18-001-x2017002-eng.htm
Arriagada, P. (2016). First Nations, Métis and Inuit women. Women in Canada: A Gender-based Statistical Report (Catalogue No. 89-503-X). https://www150.statcan.gc.ca/n1/pub/89-503-x/2015001/article/14313-eng.htm
Bérard-Chagnon, J., & Parent, M. (2021). Coverage of the 2016 Census: Levels and trends. Demographic Documents (Catalogue No. 91F0015M). https://www150.statcan.gc.ca/n1/pub/91f0015m/91f0015m2020003-eng.htm
Bleakney, A., & Melvin, A. (2022). Indigenous women and girls: Socioeconomic conditions in remote communities compared with more accessible areas. Insights on Canadian Society (Catalogue No. 75-006-x). https://www150.statcan.gc.ca/n1/pub/75-006-x/2022001/article/00005-eng.htm
Burlock, A. (2017). Women with disabilities. Women in Canada: A Gender-based Statistical Report (Catalogue No. 89-503-X). https://www150.statcan.gc.ca/n1/pub/89-503-x/2015001/article/14695-eng.htm
Drolet, M. (2020). Equally mobile, equally stable: Gender convergence in labour mobility and job stability in Canada. Labour Statistics: Research Papers (Catalogue No. 75-004-M). https://www150.statcan.gc.ca/n1/pub/75-004-m/75-004-m2020001-eng.htm
du Plessis, V., Beshiri, R., Bollman, R. D., & Clemenson, H. (2001). Definitions of rural. Rural and Small Town Canada Analysis Bulletin (Catalogue No. 21-006-XIE). https://www150.statcan.gc.ca/n1/en/pub/21-006-x/21-006-x2001003-eng.pdf?st=Y6mdCS3-
Frank, K., Frenette, M., & Morissette, R. (2015). Labour market outcomes of young postsecondary graduates, 2005 to 2012. Economic Insights (Catalogue No. 11-626-X). https://www150.statcan.gc.ca/n1/pub/11-626-x/11-626-x2015050-eng.htm
Houle, R., & Yssaad, L. (2010). Recognition of newcomers’ foreign credentials and work experience. Perspectives on Labour and Income (Catalogue No. 75-001-X). https://www150.statcan.gc.ca/n1/pub/75-001-x/2010109/article/11342-eng.htm
Hudon, T. (2015). Immigrant women. Women in Canada: A Gender-based Statistical Report (Catalogue No. 89-503-X). https://www150.statcan.gc.ca/n1/pub/89-503-x/2015001/article/14217-eng.htm
Hudon, T. (2016). Visible minority women. Women in Canada: A Gender-based Statistical Report (Catalogue No. 89-503-X). https://www150.statcan.gc.ca/n1/pub/89-503-x/2015001/article/14315-eng.htm
Khanam, F., Langevin, M., Savage, K., & Uppal, S. (2022). Women working in paid care occupations. Insights on Canadian Society (Catalogue No. 75-006-x). https://www150.statcan.gc.ca/n1/pub/75-006-x/2022001/article/00001-eng.htm
Leclerc, K. (2021). Portrait of women by the relative remoteness of their communities, series 1: Sociodemographic profile. Studies on Gender and Intersecting Identities (Catalogue No. 45-20-0002). https://www150.statcan.gc.ca/n1/pub/45-20-0002/452000022021001-eng.htm
Leclerc, K. (2022). Portrait of women by the relative remoteness of their communities, series 2: Educational attainment. Studies on Gender and Intersecting Identities (Catalogue No. 45-20-0002). https://www150.statcan.gc.ca/n1/pub/45-20-0002/452000022022001-eng.htm
Medhi, T., & Morissette, R. (2021). Working from home in Canada: What have we learned so far? Economic and Social Reports (Catalogue No. 36-28-0001). https://doi.org/10.25318/36280001202101000001-eng
Moyser, M. (2017). Women and paid work. Women in Canada: A Gender-based Statistical Report (Catalogue No. 89-503-X). https://www150.statcan.gc.ca/n1/pub/89-503-x/2015001/article/14694-eng.htm
Moyser, M., & Burlock, A. (2018). Time use: Total work burden, unpaid work, and leisure. Women in Canada: A Gender-based Statistical Report (Catalogue No. 89-503-X). https://www150.statcan.gc.ca/n1/pub/89-503-x/2015001/article/54931-eng.htm
Pelletier, R., Patterson, M., & Moyser, M. (2019). The gender wage gap in Canada: 1998 to 2018. Labour Statistics: Research Papers (Catalogue No. 75-004-M). https://www150.statcan.gc.ca/n1/pub/75-004-m/75-004-m2019004-eng.htm
Reid, A., Chen, H., & Guertin, R. (2020). Labour market outcomes of postsecondary graduates, class of 2015. Education, learning and training: Research Paper Series (Catalogue No. 81-595-M). https://www150.statcan.gc.ca/n1/pub/81-595-m/81-595-m2020002-eng.htm
Standing Committee on the Status of Women (FEWO). (2021). Challenges faced by women living in rural, remote and northern communities in Canada. https://www.ourcommons.ca/DocumentViewer/en/43-2/FEWO/report-9/
Statistics Canada. (2016). Census metropolitan influenced zone (MIZ). Dictionary, Census of Population, 2016. https://www12.statcan.gc.ca/census-recensement/2016/ref/dict/geo010-eng.cfm
Statistics Canada. (2017a). Visible minority (15), immigrant status and period of immigration (11), age (12) and sex (3) for the population in private households of Canada, provinces and territories, census metropolitan areas and census agglomerations, 2016 census - 25% sample data (Catalogue No. 98-400-X2016191) [Data table]. https://www12.statcan.gc.ca/census-recensement/2016/dp-pd/dt-td/Rp-eng.cfm?TABID=2&LANG=E&A=R&APATH=3&DETAIL=0&DIM=0&FL=A&FREE
=0&GC=01&GL=-1&GID=1341679&GK=1&GRP=1&O=D&PID=110532&PRID=10&PTYPE=109445
&S=0&SHOWALL=0&SUB=0&Temporal=2017&THEME=120&VID=0&VNAMEE
=&VNAMEF=&D1=0&D2=0&D3=0&D4=0&D5=0&D6=0
Statistics Canada. (2017b). Employment income statistics (7), occupation - national occupational classification (NOC) 2016 (193A), work activity during the reference year (9) and sex (3) for the population aged 15 years and over in private households of Canada, provinces and territories and census metropolitan areas, 2016 census - 25% sample data (Catalogue No. 98-400-X2016304) [Data table]. https://www12.statcan.gc.ca/census-recensement/2016/dp-pd/dt-td/Rp-eng.cfm?TABID=2&LANG=E&A=R&APATH=3&DETAIL=0&DIM=0&FL=A&FREE
=0&GC=01&GL=-1&GID=1325190&GK=1&GRP=1&O=D&PID=110698&PRID=10&PTYPE=109445
&S=0&SHOWALL=0&SUB=0&Temporal=2017&THEME=124&VID=0&VNAMEE
=&VNAMEF=&D1=0&D2=0&D3=0&D4=0&D5=0&D6=0
Statistics Canada. (2017c). Population centre (POPCTR). Dictionary, Census of Population, 2016. https://www12.statcan.gc.ca/census-recensement/2016/ref/dict/geo049a-eng.cfm
Statistics Canada. (2023). Table 14-10-0340-02 Average and median gender wage ratio, annual [Data table]. https://www150.statcan.gc.ca/t1/tbl1/en/tv.action?pid=1410034002
Status of Women Canada. (2016). A profile of Canadian women in rural, remote and northern communities. https://cfc-swc.gc.ca/abu-ans/wwad-cqnf/wnc-fcn/profile-eng.pdf
Subedi, R., Roshanafshar, S., & Greenberg, T. L. (2020). Developing meaningful categories for distinguishing levels of remoteness in Canada. Analytical Studies: Methods and References (Catalogue No. 11-633-X). https://www150.statcan.gc.ca/n1/pub/11-633-x/11-633-x2020002-eng.htm
Wall, K. (2019). Persistence and representation of women in STEM programs. Insights on Canadian Society (Catalogue No. 75-006-X). https://www150.statcan.gc.ca/n1/pub/75-006-x/2019001/article/00006-eng.htm
- Date modified: