
Studies on Gender and Intersecting Identities
Portrait of Women by the Relative Remoteness of their Communities, Series 2: Educational Attainment
Skip to text
Text begins
Start of text boxHighlights
- Women in Canada are highly educated overall (Statistics Canada, 2017a). However, their level of educational attainment differed across the remoteness of the communities where they lived; the more remote a community was, the lower the proportions of women to have high school and postsecondary education completion were. For example, in 2016, the high school graduation rate of women aged 25 to 64 years was the highest in easily accessible areas (89.3%) and steadily decreased to the lowest high school completion rate in very remote areas (57.4%).
- Women’s educational attainment also varied by characteristics, such as Indigenous identity, immigration background and ethnocultural characteristics. Among women aged 25 to 64 years, Indigenous women had the lowest educational attainment of all groups studied – especially those living in very remote areas, where, for example, 32.3% of them held a postsecondary qualification, compared to 81.1% for women designated as visible minorities, and 73.2% for immigrant women living in these very remote areas.
- Among women who held a postsecondary qualification, the type of postsecondary credential (e.g. apprenticeship or trades, college or CEGEP, or university degree at the bachelor level or higher) varied by remoteness and by characteristics. While a bachelor’s degree or higher was the most common postsecondary qualification for women living in easily accessible areas (50.4%), a college or CEGEP certificate or diploma ranked as the most common postsecondary qualification in accessible (45.2%), less accessible (48.9%), remote (49.1%) and very remote (48.7%) areas. As well, women designated as visible minorities – especially South Asian women – were the most likely of all groups studied to hold a bachelor’s degree or above, regardless of the remoteness areas categories.
- Business and administration and health care were the most common fields of study for women aged 25 to 64 years with a postsecondary qualification – and that held true across all remoteness area categories.
- While the likelihood of having chosen a STEM (science, technology, engineering and mathematics and computer sciences) field of study was low among women, it varied from one remoteness area to another (from 11.6% for those living in easily accessible areas to 6.5% and 5.4% for those living in remote and very remote communities, respectively). It also varied by characteristics and age groups.
- Women designated as visible minorities – especially Chinese women – and immigrant women were more likely to hold a STEM postsecondary qualification than any other groups studied, across all remoteness area categories. For example, 17.0% of women designated as visible minorities (and 22.5% for Chinese women) held a postsecondary qualification in STEM in 2016 in Canada, compared with 5.8% for Indigenous women and 10.6% for all women in Canada. While the likelihood of having chosen a STEM field of study decreased as their communities were more remote, the proportions of visible minority women (12.8%) and immigrant women (12.4%) having a postsecondary qualification in STEM in very remote areas remained higher than the national average of all women in Canada (10.6%).
- Younger women (aged 25 to 34 years) were more likely to hold a STEM postsecondary qualification than women aged 25 to 64 years – especially those holding a bachelor’s degree or above, and that held true across all remoteness areas. For example, at the national level, about one in six (16.3%) women aged 25 to 34 years holding a university qualification at the bachelor level or above had their credential in STEM vs 10.6% for those who were aged 25 to 64 years and had any types of postsecondary qualification.
Acknowledgments
This study is funded by the Department for Women and Gender Equality.
Introduction
Canadians are among the most educated people in the world: 91% of adults aged 25 to 64 years had completed at least a high school diploma or postsecondary credential in Canada in 2016, compared to an OECD average of 78% (Statistics Canada, 2017b).
Women in Canada have made substantial gains in their educational attainment over the past decades by increasingly acquiring high school and postsecondary education. Today, they are among the most educated in the world and are even more likely than men to hold a high school or postsecondary qualification (Statistics Canada, 2017a). Indeed, the proportion of women aged 25 to 64 years with a university certificate or degree grew from 15% in 1991 to 35% in 2015 (Ferguson, 2016). The proportion of men with a university qualification also grew during that time period, but to a lesser extent than that of women (from 19% in 1991 to 30% in 2015) (Ferguson, 2016).
Despite this progress, academic segregation (women in female-dominated fields of study and men in male-dominated fields of study) is still observed,Note which leads to less gender diversity across educational paths. For example, young women remain less likely to choose an engineering or computer science field of study – which are associated with higher-paying jobs that contribute to a country’s competitiveness and economic prosperity. This gender segregation in education results in less gender diversity across occupations and limits career opportunities for women (and men) in certain disciplines. Note
Moreover, the educational attainment of adults in Canada appears to be uneven across the country. Women and men residing in rural areas have lower educational attainment than their urban counterparts (SWC, 2016). The rural/urban education gap is a long-persisting issue (Carr, 2011; Wallin, 2009; Cartwright, 2002). Addressing this gap would be an important step to not only ensure better equity among youth across Canada, but also to generate the skills needed for the economic development and growth of rural communities, which increasingly require high-skilled labour (Carr, 2011). Indeed, in rural areas higher unemployment rates coexist with significant labour shortages – particularly for skilled workers. The shortage of skilled workers is likely not unrelated to the fact that the more remote a community is, the more the education levels drop (Infrastructure Canada, 2019).
Using data from the 2016 Census of Population and the updated Remoteness Index Classification, this paper is the second of a series of four papers on the socioeconomic and sociodemographic profile of women living in communities at varying levels of remoteness. Specifically, this report focuses on the educational attainment, type of postsecondary qualification (e.g. apprenticeship or trades, college or CEGEP, or university degree at the bachelor level or higher), and the fields of study of women by the relative remoteness of their communities. The Remoteness Index (RI) assigns a relative remoteness value to each census subdivision – based on proximity to census agglomerations as a proxy for services accessibility (Alasia et al., 2017).Note Paired with the new RI classification, this tool allows the grouping of census subdivisions by their relative remoteness into five categories: easily accessible; accessible; less accessible; remote; and, very remote areas (Subedi et al., 2020). These refined categories have the potential for a better differentiation and description of the different educational attainments of women across diverse communities in Canada.
Educational attainment of women
High school completion is considered as an essential means for acquiring the basic skills to participate actively in society as well as being the key prerequisite for postsecondary education – which is now widely perceived as an important determinant of success in the labour market (Conference Board of Canada, 2013a; Statistics Canada, 2017c; Frank et al., 2015; Reid et al., 2020). Obtaining a postsecondary degree is, indeed, associated with a number of individual and social benefits such as better-paying jobs and a wider range of labour market opportunities, but also better health and greater social participation (Turcotte, 2020; OECD, 2014). In Canada, those who do not earn a high school diploma (and, to a lesser extent, those who do not obtain a postsecondary qualification) are more likely to face difficulties with labour market integration, often have higher unemployment rates, lower labour market participation rates and lower employment income than those who have a higher level of education (Uppal, 2017; Turcotte, 2020; Statistics Canada, 2017a).
High school and postsecondary completion rates of women aged 25 to 64 yearsNote in Canada have steadily increased over the past decade (Statistics Canada, 2001, 2006, 2011a, 2017a). They reached 88.4% in 2016 for high schoolNote Note and 66.7% for postsecondary educationNote Note (Statistics Canada, Table 37-10-0170-01; Statistics Canada, 2019a; see also Charts 2 and 3).
In fact, a majority of women aged 25 to 64 years held a postsecondary qualification in 2016; meaning that women in Canada were more likely to hold a postsecondary qualification (66.7%) than having a high school diploma as their highest qualification (23.3%), or having no certificate, diploma or degree (10.0%) (Chart 1).

Data table for Chart 1
| No certificate, diploma or degree | Secondary (high) school diploma or equivalency certificate | Postsecondary certificate, diploma or degree | |
|---|---|---|---|
| percent | |||
| Canada | 10.0 | 23.3 | 66.7 |
| Easily accessible | 9.3 | 21.9 | 68.8 |
| Accessible | 9.5 | 26.0 | 64.5 |
| Less accessible | 12.3 | 27.1 | 60.5 |
| Remote | 17.2 | 26.7 | 56.0 |
| Very remote | 37.5 | 22.9 | 39.6 |
| Source: Statistics Canada, 2016 Census and Remoteness Index Classification. | |||
Women’s educational attainment, however, varied by remoteness area categories and by other characteristics studied, namely Indigenous identity, immigration background and ethnocultural characteristics.
Women’s educational attainment is, by far, the lowest in very remote areas
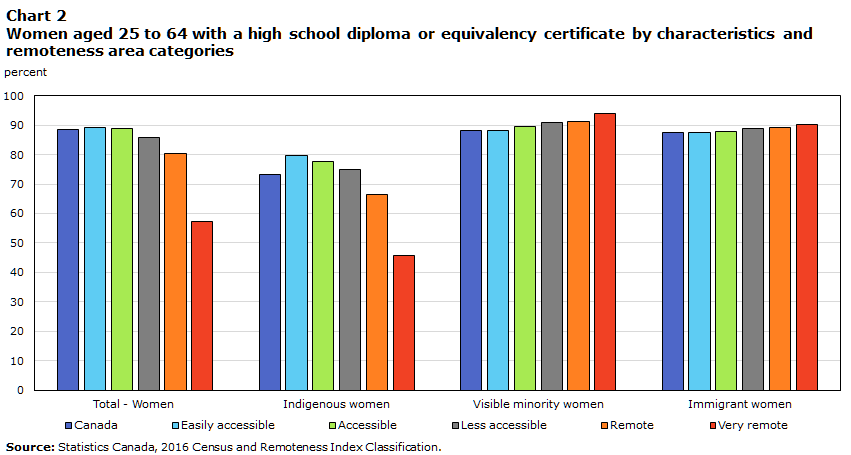
In Canada, education is compulsory until the age of 16 or 18 years (depending on the specific province or territory) or until a high school diploma has been achieved. Despite these compulsory school laws across the country, the high school graduation rate of women was uneven across the remoteness area categories. The more remote a community was, the lower the high school completion rate was. In 2016, the high school graduation rate of women aged 25 to 64 years was the highest in easily accessible areas (89.3%) and steadily decreased to the lowest high school completion rate in very remote areas (57.4%) (Chart 2).Note Note
Data table for Chart 2
| Canada | Easily accessible | Accessible | Less accessible | Remote | Very Remote | |
|---|---|---|---|---|---|---|
| percent | ||||||
| Total - Women | 88.4 | 89.3 | 88.7 | 85.7 | 80.3 | 57.4 |
| Indigenous women | 73.2 | 79.6 | 77.8 | 75.0 | 66.3 | 45.8 |
| Visible minority women | 88.2 | 88.1 | 89.4 | 90.8 | 91.3 | 93.9 |
| Immigrant women | 87.5 | 87.5 | 88.0 | 88.8 | 89.1 | 90.3 |
| Source: Statistics Canada, 2016 Census and Remoteness Index Classification. | ||||||
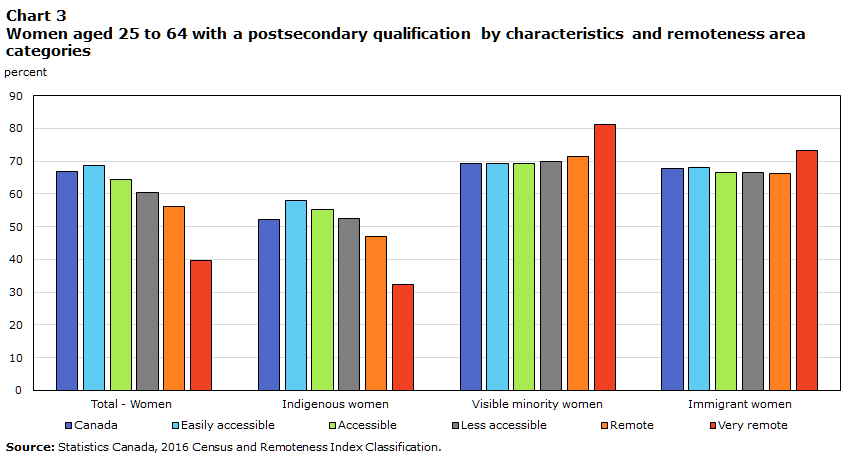
Similarly, the percentage of women aged 25 to 64 years with a postsecondary qualification decreased as the remoteness index increased.Note More than two-thirds (68.8%) of women had a postsecondary certificate, diploma or degree in easily accessible areas, and this percentage gradually declined to 39.6% in very remote areas (Chart 3).
Data table for Chart 3
| Canada | Easily accessible | Accessible | Less accessible | Remote | Very remote | |
|---|---|---|---|---|---|---|
| percent | ||||||
| Total - Women | 66.7 | 68.8 | 64.5 | 60.5 | 56.0 | 39.6 |
| Indigenous women | 52.2 | 57.9 | 55.2 | 52.4 | 47.1 | 32.3 |
| Visible minority women | 69.2 | 69.2 | 69.3 | 69.9 | 71.5 | 81.1 |
| Immigrant women | 67.7 | 67.9 | 66.4 | 66.4 | 66.3 | 73.2 |
| Source: Statistics Canada, 2016 Census and Remoteness Index Classification. | ||||||
Indigenous women have the lowest educational attainment of all groups studied, especially those living in very remote areas
Women’s educational attainment also varied by the specific characteristics of the groups studied. Indigenous
While Indigenous women had the lowest proportion of postsecondary qualification holders, it must be noted that, when postsecondary education is disaggregated by type of qualification (apprenticeship, college or CEGEP, or university diploma), Indigenous women had the highest proportions of apprenticeship and college or CEGEP qualifications of all groups studied.Note However, this did not apply to all remoteness areas – the proportions of Indigenous women who had an apprenticeship or a college or CEGEP qualification were the highest in easily accessible and accessible areas only (and on average in Canada) (results not shown). Despite these high completion rates, the overall postsecondary completion rate of Indigenous women remained below that of the other groups.
The high school and postsecondary completion rates of Indigenous women followed a similar pattern to the overall completion rate of women in Canada, i.e. they decreased as the remoteness index increased, albeit starting from a lower level. Specifically, the high school completion rate of Indigenous women was the highest in easily accessible areas (79.6%) and decreased to the lowest completion rate (45.8%) in very remote areas (Chart 2).Note The percentage of Indigenous women holding a postsecondary qualification was also the highest in easily accessible areas (57.9%) and the lowest in very remote areas (32.3%) (Chart 3). In every remoteness area category, the completion rates of Indigenous women, for high school or postsecondary credentials, remained below those of the other groups studied. Previous research has shown that the educational attainment of Indigenous peoples has historically been lower than the general population in Canada (Gordon and White, 2014; OECD, 2020). In the past decades, however, the proportion of Indigenous peoples with less than a high school qualification has declined and the proportion of those with a postsecondary education has risen, leading to a greater number of highly educated Indigenous peoples (Gordon and White, 2014). Despite these gains in educational attainment among Indigenous peoples, the overall number of Indigenous peoples without a high school diploma has remained high and, as a result, the educational gap between Indigenous and non-Indigenous peoples has persisted (Gordon and White, 2014; White and Peters, 2013).
The fact that the high school and postsecondary completion rates of Indigenous women (and women in general) increased when the remoteness index decreased, suggests that the geographic isolation combined with low density populations of more remote areas likely do not set the ideal conditions for the continuation of studies. Time away from family and community, which has been identified as an important factor among Indigenous peoples when deciding to attend or not a postsecondary institution, may also explain the lower educational attainment in more remote areas (Restoule et al., 2013; Gordon and White, 2014). However, these factors – except perhaps time away from family – do not explain the lower educational attainment of Indigenous women compared to all other groups studied in every remoteness area, especially in easily accessible and accessible areas. Other sociocultural, socioeconomic and historic factors likely explain portions of this disparity. For example, it has been shown that residential schools have had an impact on the educational attainment of not only those who attended, but also those who had a family member who had attended these residential schools (Truth and Reconciliation Commission of Canada, 2015; Arriagada, 2015). Colonialism, forced assimilation, discrimination and socioeconomic marginalization, for example, are also other identified factors that can affect learning and the educational attainment of Indigenous peoples (National Collaborating Centre for Aboriginal Health, 2017; Gordon and White, 2014).
The educational attainment of women designated as visible minorities and immigrant women increases as their communities are more remote
In contrast to the patterns among women overall, the high school and postsecondary graduation rates of women designated as visible minorities and immigrant women increased as their communities’ remoteness index grew. For the high school completion rate, it increased from 88.1% in easily accessible areas to 93.9% in very remote areas for women designated as visible minorities, and from 87.5% to 90.3% for immigrant women (Chart 2). With respect to the postsecondary completion rate, it increased from 69.2% in easily accessible areas to 81.1% in very remote areas for women designated as visible minorities and from 67.9% in easily accessible areas to 73.2% in very remote areas for immigrant women (Chart 3). However, given the large underrepresentation of visible minority and immigrant women in more remote areas, it should be noted that this trend does not significantly affect the national average.
The growing high school and postsecondary completion rates of visible minority and immigrant women as the remoteness of their communities increased may be partially attributed to the population variations within these groups. Indeed, for women designated as visible minorities, as studied in the sections below, a part of this increase could be explained, first, by the fact that the educational attainment of women designated as visible minorities varied by their ethnocultural background. Second, it could be explained by the variations in the distribution of these visible minority groups across remoteness area categories, i.e. the make-up of the female population designated as visible minorities varied by community remoteness.
Filipino women are the most likely of all women designated as visible minorities to hold a high school diploma and a postsecondary qualification
In Canada, the six largest female population groups designated as visible minorities in 2016 were South Asian (24.0%), Chinese (21.0%), Black (15.7%), Filipino (11.1%), Arab (6.3%), and Latin American (5.9%) (Leclerc, 2021). The distribution of these visible minority groups, however, varied by the relative remoteness of the communities (Leclerc, 2021). While the South Asian female population was the largest female population group designated as visible minorities in easily accessible and accessible areas, the Filipino female population was the largest female population group designated as visible minorities in less accessible areas, remote areas and very remote areas (Leclerc, 2021).
The high school completion rate of women designated as visible minorities as well as the percentage of postsecondary qualification holders varied by ethnocultural background (Table 1). Filipino women had the highest likelihood of having a high school diploma or equivalency certificate (97.3%), and the highest likelihood of having a postsecondary qualification (80.3%) of the six largest female population groups designated as visible minorities (Table 1).
| South Asian | Chinese | Black | Filipino | Latin American | Arab | |
|---|---|---|---|---|---|---|
| percent | ||||||
| High school or equivalency certificate | 87.2 | 89.1 | 86.5 | 97.3 | 86.6 | 84.9 |
| Postsecondary qualification | 65.9 | 69.7 | 70.0 | 80.3 | 66.6 | 69.8 |
| Source: Statistics Canada, 2016 Census and Remoteness Index Classification. | ||||||
The fact that Filipino women had the highest high school and postsecondary completion rates and that they represented the largest female population group designated as visible minorities in more remote communities may partially explain why the educational attainment of visible minority women increased with remoteness index.
Very recent immigrant women are more likely to hold a high school diploma and a postsecondary qualification than more established immigrant women
With respect to immigrant women, very recent and recent immigrant womenNote were slightly more likely to hold a high school diploma or equivalency certificate than established immigrant women (89.4%, 89.1%, and 86.8%, respectively) (Table 2.A). Similarly, very recent immigrant women were more likely than recent and established immigrant women to hold a postsecondary qualification (74.5%, 72.5%, and 65.0%, respectively) (Table 2.B).
Given that very recent immigrant women were slightly more likely than recent and established female immigrants to be living outside easily accessible areas (Leclerc, 2021), this may partially explain the higher high school and postsecondary completion rates in more remote areas.Note
| Canada | Easily accessible | Accessible | Less accessible | Remote | Very remote | |
|---|---|---|---|---|---|---|
| percent | ||||||
| Very recent (2011-2016) | 89.4 | 89.1 | 90.1 | 92.7 | 94.2 | 96.4 |
| Recent (2006-2010) | 89.1 | 89.0 | 89.3 | 90.6 | 92.9 | 95.3 |
| Established before 2006 | 86.8 | 86.7 | 87.0 | 86.6 | 86.7 | 87.0 |
| Source: Statistics Canada, 2016 Census and Remoteness Index Classification. | ||||||
| Canada | Easily accessible | Accessible | Less accessible | Remote | Very remote | |
|---|---|---|---|---|---|---|
| percent | ||||||
| Very recent 2011 to 2016 | 74.5 | 74.6 | 73.2 | 75.6 | 77.1 | 85.5 |
| Recent 2006 to 2010 | 72.5 | 72.8 | 69.6 | 70.8 | 76.3 | 76.7 |
| Established before 2006 | 65.0 | 65.3 | 63.3 | 61.3 | 60.8 | 68.5 |
| Source: Statistics Canada, 2016 Census and Remoteness Index Classification. | ||||||
However, the distribution of immigrant women across the remoteness areas did not explain the overall increase of the higher completion rates of immigrant women in more remote communities as, even for very recent immigrant women, their average completion rates were always lower in easily accessible than in very remote areas (Tables 2.A and 2.B). Very recent and recent immigrant women living in more remote areas were more likely than those living in more accessible areas to hold a high school diploma or equivalent certificate or a postsecondary qualification. It should be noted, moreover, that while visible minority and immigrant women were more likely to have a higher educational attainment in more remote areas, this does not necessarily mean that they received their high school or postsecondary credentials in these areas.
Given the large underrepresentation of visible minority and immigrant women in more remote areas and the overrepresentation of Indigenous women in these areas (Leclerc, 2021), the higher high school and postsecondary completion rates of visible minority and immigrant women in these areas likely do not significantly affect the average for all women – especially not in very remote areas.
Overall, these results show that while the female population is highly educated in Canada, the educational gap among different levels of remoteness still exists and is worse for some female population groups. These results suggest, on the one hand, that geographic isolation combined with low density populations of more remote areas likely make it challenging for some communities to provide their population with high-quality educational services and supports. On the other hand, the lower high school and postsecondary completion rates of Indigenous women when compared to the other groups studied, even in more accessible areas, also suggest that the education completion rates may likely not be only tied to the remoteness of their communities. They are likely connected with a wide range of factors such as the historic and contemporary impacts of colonialism, including residential schools and socioeconomic marginalization, culturally inappropriate educational supports, unconscious bias and discrimination, and inequitable funding for education – which are all recognized as important factors associated with poorer educational attainment (Truth and Reconciliation Commission of Canada, 2015; National Collaborating Centre for Aboriginal Health, 2017; Battiste, 2013; Sisco et al., 2013).
Types of postsecondary qualification
Among women who held a postsecondary qualification, the type of postsecondary credential (e.g. apprenticeship or trades, college or CEGEP, or university degree at the bachelor level or higher) also varied by remoteness and by characteristics.
A bachelor’s degree or higher is the most common postsecondary qualification among women living in easily accessible areas
In Canada, university certificate, diploma or degree at the bachelor level or above (46.3%) was the most common qualification among women aged 25 to 64 years who held a postsecondary certificate or diploma in 2016 – compared with an apprenticeship or trades certificate or diploma (10.3%), and college, CEGEP or other non-university certificate or diploma (38.1%) (Chart 4).
However, as the remoteness index increased, the likelihood of having a bachelor’s degree or higher decreased. Among women who held a postsecondary qualification, half of them (50.4%) in easily accessible areas held a bachelor’s degree or above. This proportion continuously decreased and reached the lowest level in very remote areas at 27.9% for women aged 25 to 64 years (Chart 4).
Conversely, the likelihood of having a college, CEGEP, or other non-university certificate or diploma as the highest credential increased with the remoteness and became the most common highest postsecondary qualification in accessible, less accessible, remote and very remote areas (Chart 4).

Data table for Chart 4
| Apprenticeship or trades certificate or diploma | College, CEGEP or other non-university certificate or diploma | University certificate, diploma or degree at bachelor level or above | |
|---|---|---|---|
| percent | |||
| Canada | 10.3 | 38.1 | 46.3 |
| Easily accessible | 9.6 | 34.7 | 50.4 |
| Accessible | 10.6 | 45.2 | 39.0 |
| Less accessible | 14.2 | 48.9 | 31.6 |
| Remote | 15.5 | 49.1 | 29.0 |
| Very remote | 15.9 | 48.7 | 27.9 |
| Source: Statistics Canada, 2016 Census and Remoteness Index Classification. | |||
Women designated as visible minorities, especially South Asian women, have the highest proportion of bachelor’s degree (or above) holders of all groups studied
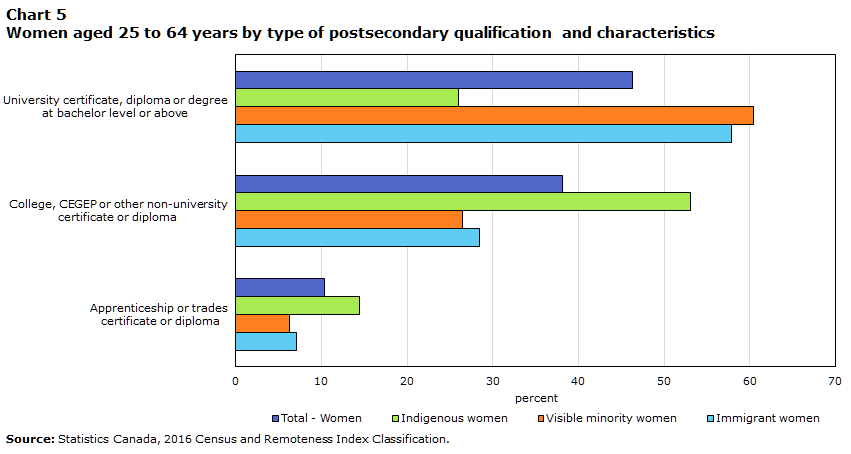
The type of postsecondary qualification also varied by characteristics. Women designated as visible minorities were the most likely of all groups studied to hold a bachelor’s degree or above (Chart 5), regardless of the remoteness category (results not shown).
Data table for Chart 5
| University certificate, diploma or degree at bachelor level or above |
College, CEGEP or other non-university certificate or diploma |
Apprenticeship or trades certificate or diploma |
|
|---|---|---|---|
| percent | |||
| Total - Women | 46.3 | 38.1 | 10.3 |
| Indigenous women | 26.0 | 53.1 | 14.4 |
| Visible minority women | 60.4 | 26.5 | 6.3 |
| Immigrant women | 57.8 | 28.4 | 7.1 |
| Source: Statistics Canada, 2016 Census and Remoteness Index Classification. | |||
In fact, all the six largest female population groups designated as visible minorities – except Black women – were more likely to hold a bachelor degree or above than the national average of the female population (46.3%), especially South Asian women (70.2%) (Table 3).
| Total - Women designated as visible minorities | South Asian | Chinese | Black | Filipino | Latin American | Arab | |
|---|---|---|---|---|---|---|---|
| percent | |||||||
| University certificate, diploma or degree at bachelor level or above | 60.4 | 70.2 | 68.4 | 38.0 | 59.1 | 48.7 | 63.4 |
| College, CEGEP or other non-university certificate or diploma | 26.5 | 21.6 | 22.3 | 41.0 | 25.7 | 32.5 | 20.2 |
| Apprenticeship or trades certificate or diploma | 6.3 | 3.4 | 2.6 | 14.3 | 4.9 | 11.8 | 8.4 |
| Source: Statistics Canada, 2016 Census and Remoteness Index Classification. | |||||||
While 70.0% of Black women had a postsecondary qualification (Table 1), they had the lowest proportion of postsecondary qualification holders having a bachelor’s degree or above as their highest diploma among women designated as visible minorities (and were also below the average of the overall female population (38.0% vs 46.3%)) (Table 3). However, the proportion of Black women holding a bachelor’s degree or above increased with the remoteness. Among Black women holding a postsecondary qualification, 37.4% of them held a bachelor’s degree or above in easily accessible areas (compared to 50.4% for the overall female population in the same remoteness areas). This proportion reached 72.0% in very remote areas (compared to 27.9% for the overall female population living in the same remoteness areas). Conversely, Black women were the most likely of all of the six largest female population groups designated as visible minorities of having an apprenticeship and college or CEGEP qualification, and this likelihood decreased with the remoteness.
Indigenous women are more likely to hold an apprenticeship or trades qualification than any other groups studied
Skilled trades are an important driver of the Canadian economy and, through apprenticeship programs, tradespeople acquire the skills to support industries that are integral to Canada’s economy (Statistics Canada, 2020; Statistics Canada, 2019b). With Canada’s aging population – which is especially pronounced in less accessible and remote areas (Leclerc, 2021) – there are growing concerns about potential labour shortages of skilled workers, including skilled tradespersons, in the coming years (Statistics Canada, 2020). A recent RBC Thought Leadership Report projected that over 700,000 skilled tradespeople are expected to retire by 2028 (RBC, 2021) and the Canadian Apprenticeship Forum estimated that Canada will face a gap of more than 60,000 registered apprentices by 2025 (CAF-FCA, 2021). This labour shortage of skilled workers has already been noted in rural Canada (Infrastructure Canada, 2019) and some groups, such as the Canadian Chamber of Commerce, have already voiced that “the development and economic success of major projects in the natural resources sector and other industries in remote rural communities depend not only on the accessibility to appropriate infrastructure, but also on the availability of a skilled workforce” (Canadian Chamber of Commerce, 2011; HUMA, 2012). As such, in the past years, diverse initiatives have been launched to attract women and employ a more diverse workforce in trades in order to help fill the imminent labour force gap.
Despite these efforts, women remained underrepresented in trades in all remoteness area categories. In Canada, 10.3% of women aged 25 to 64 years who had a postsecondary qualification had an apprenticeship or trades certificate or diploma in 2016 (Chart 4). The proportion of women who held an apprenticeship or trades certificate or diploma as their highest qualification increased with the remoteness index, raising from 9.6% in easily accessible areas to 15.9% in very remote areas (Chart 4).
Indigenous women, however, were more likely than any other groups studied to hold an apprenticeship or trades certificate or diploma (Chart 5), whatever the remoteness area category (results not shown). Specifically, the proportion of Indigenous women holding a postsecondary qualification who had an apprenticeship or trades diploma was: 13.5% in easily accessible areas (vs 9.6% for the overall female population); 12.9% in accessible areas (vs 10.6% for the overall female population); 16.0% in less accessible areas (vs 14.2% for the overall female population); 16.2% in remote areas (vs 15.5% for the overall female population); and, 18.3% in very remote areas (vs 15.9% for the overall female population).
Nevertheless, the proportion of women who held this type of qualification still remained the lowest of all postsecondary qualifications studied (Chart 5).Note The national average of the female population who had an apprenticeship or trades qualification in 2016 (10.3%) was lower than that of 2011 (12.9%) (Statistics Canada, 2011b). Moreover, women have traditionally been concentrated in few female-dominated apprenticeship or trades programs, such as early childhood educator, hairstylist, esthetician and cook (Frank and Jovic, 2017; CAF-FCA, 2018), which may not fill the projected labour shortage of tradespersons identified by the Canadian Chamber of Commerce in the natural resources sector and other industries in remote rural communities.
Overall, the different levels of educational achievement and the types of qualification are not insignificant as they lead to important differences in terms of labour force participation, labour market conditions and earnings. Previous studies have shown that, across Canada, higher levels of educational attainment result in higher earnings and higher employment rates, both on a yearly basis as well as over a lifetime of employment (Reid et al., 2020; Statistics Canada, 2017c; Frank et al., 2015). For example, in 2015, women holding a bachelor’s degree earned 58% more than women who held a high school diploma, and 41% more than those with college or CEGEP education (Statistics Canada, 2017c). Completing an apprenticeship certificate, however, did not result in higher earnings for women, as it did for
Fields of study
Business and health are the most common fields of study among women holding a postsecondary qualification
In 2016, the most common fields of studyNote for women aged 25 to 64 years with a postsecondary qualification were business and administration (24.1%) and health care (20.3%) (Chart 6). Taken together, these two fields of study accounted for about 44% of postsecondary qualification holders among women in Canada. They were the most common fields of study across all remoteness area categories (for all women in Canada) and for all groups studied, except for immigrant women in very remote areas (where health ranked first and business and administration ranked second ex aequo with education) and for Indigenous women in very remote areas (where business and administration ranked first, trades, services, natural resources and conservationNote ranked second, education ranked third, and health slipped to the fourth rank) (Appendix A).

Data table for Chart 6
| Canada | Easily accessible | Accessible | Less accessible | Remote | Very remote | |
|---|---|---|---|---|---|---|
| percent | ||||||
| Business and administration | 24.1 | 24.0 | 23.9 | 25.5 | 25.2 | 22.1 |
| Health care | 20.3 | 18.6 | 24.4 | 25.8 | 24.7 | 19.1 |
| Social and behavioural sciences | 12.3 | 13.3 | 10.6 | 8.8 | 8.6 | 11.2 |
| Education and teaching | 8.8 | 8.1 | 9.9 | 10.6 | 12.1 | 18.6 |
| Trades, services, natural resources and conservation | 11.5 | 10.4 | 13.1 | 15.6 | 16.6 | 17.4 |
| Source: Statistics Canada, 2016 Census and Remoteness Index Classification. | ||||||
Conversely, the least common fields of study were legal professions and studies, mathematics and computer and information science, and engineering and engineering technology; and these held true across all remoteness area categories for all groups studied – except for Indigenous women for whom science and science technology was equal or almost equal (depending on the remoteness areas) to the other three fields of study mentioned above (Appendix A).
As suggested by these results, women aged 25 to 64 years holding a postsecondary qualification were unlikely to have chosen a STEM (science, technology, engineering and mathematics and computer sciences) field of study. There were, however, some variations by remoteness area categories and, particularly, by characteristics.
Women designated as visible minorities and immigrant women are more likely to hold a postsecondary qualification in STEM than any other groups studied
Among women aged 25 to 64 years who held a postsecondary qualification, those living in easily accessible areas (11.6%) were the most likely to have studied in STEM, and those living in remote and very remote areas were the least likely (6.5% and 5.4%, respectively) (Chart 7).

Data table for Chart 7
| Canada | Easily accessible | Accessible | Less accessible | Remote | Very remote | |
|---|---|---|---|---|---|---|
| percent | ||||||
| STEM | 10.6 | 11.6 | 8.5 | 6.9 | 6.5 | 5.4 |
| BHASE (non-STEM) | 89.4 | 88.4 | 91.5 | 93.1 | 93.5 | 94.6 |
| Source: Statistics Canada, 2016 Census and Remoteness Index Classification. | ||||||
The proportion of women who held a postsecondary qualification in STEM varied more widely by characteristics than by remoteness area categories. In every remoteness category, women designated as visible minorities and immigrant women were largely more likely to hold a STEM diploma or degree than Indigenous women, as well as the average of all women in Canada (Chart 8). For example, 17.0% of women designated as visible minorities and 16.9% of immigrant women held a postsecondary qualification in STEM in 2016 in Canada, compared with 5.8% for Indigenous women and 10.6% for all women in Canada.

Data table for Chart 8
| Canada | Easily accessible | Accessible | Less accessible | Remote | Very remote | |
|---|---|---|---|---|---|---|
| percent | ||||||
| Total - Women | 10.6 | 11.6 | 8.5 | 6.9 | 6.5 | 5.4 |
| Indigenous women | 5.8 | 6.9 | 5.8 | 4.8 | 4.5 | 3.7 |
| Visible minority women | 17.0 | 17.1 | 16.5 | 15.6 | 16.0 | 12.8 |
| Immigrant women | 16.9 | 17.3 | 14.5 | 13.1 | 12.7 | 12.4 |
| Source: Statistics Canada, 2016 Census and Remoteness Index Classification. | ||||||
Among women from the six largest groups designated as visible minorities, Chinese women (22.5%), followed by Arab (21.3%) and South Asian women (19.3%), were more likely to hold a postsecondary qualification in STEM than women from the other groups designated as visible minorities. For example, it was 14.0% for Filipino women, 13.4% for Latin American women, and 8.2% for Black women in 2016 in Canada.
There were also some variations when looking at the highest level of education and different age groups. Women holding a university certificate, diploma or degree at bachelor’s level or above were more likely to have chosen a STEM field of study than those with all levels of postsecondary qualification (Chart 9). Younger women (aged 25 to 34 years) were also more likely to have a postsecondary qualification in STEM than women aged 25 to 64 years. Overall, women aged 25 to 34 years holding a university qualification at the bachelor’s level or above were the most likely to have studied in a STEM field of study. This was true for all groups studied, at all levels of remoteness (results not shown).

Data table for Chart 9
| Total - Women | Indigenous women | Visible minority women | Immigrant women | |
|---|---|---|---|---|
| percent | ||||
| Aged 25-64 with postsecondary | 10.6 | 5.8 | 17.0 | 16.9 |
| Aged 25-34 with postsecondary | 11.4 | 6.1 | 18.1 | 18.0 |
| Aged 25-64 with bachelor’s degree or above |
15.5 | 7.6 | 22.5 | 23.0 |
| Aged 25-34 with bachelor’s degree or above |
16.3 | 10.2 | 23.1 | 22.9 |
| Source: Statistics Canada, 2016 Census and Remoteness Index Classification. | ||||
Despite progress in women’s educational attainment in the past decades, women remained unlikely to have chosen a STEM field of study. However, there were variations by remoteness area categories, characteristics, level of the highest postsecondary qualification, and age groups. The fact that younger women (25 to 34 years) were more likely to hold a qualification in STEM suggests that the proportion of women holding a degree in STEM may increase in the upcoming years.
Conclusion
Previous research has shown that there is a positive relationship between education and employment (Reid et al., 2020; Statistics Canada, 2017a) as well as between education and health (OECD, 2014) and social participation (Turcotte, 2020). Added to the individual benefits, education has also been, and, with the interconnected global economy and the shift toward a knowledge-based economy, will increasingly be, an important determinant of the overall economic success of Canada – and more remote regions are no exception. Canada’s rural employment sectors face an increasing need for high-skilled labour (Carr, 2011). In fact, with the aging population (which is more pronounced in less accessible and remote areas (Leclerc, 2020)), in addition to the urbanized and knowledge-based economy, it is particularly critical for more remote communities to secure the talent and skills needed for their economic development and growth. With the COVID-19 pandemic and its accompanying changes in the work location for many workers who started to work from home, less accessible and less costly regions may become more attractive in the near future – if the possibility of working remotely remains after the pandemic.
Women in Canada are highly educated and, in every remoteness area category, they were more likely to hold a postsecondary qualification than having no diploma or having a high school qualification as their highest level of education.
However, the results showed that an educational gap still exists among women living in more accessible areas and those in more remote areas; the more remote a community was, the lower women’s high school and postsecondary completion rates were.
Among postsecondary graduates, there was a gap in the type of postsecondary credentials depending on the remoteness. Women living in easily accessible areas who had a postsecondary qualification were more likely to have a bachelor’s degree or above – which is associated with higher earnings – while women living in more remote areas were more likely to hold a college or CEGEP certificate or diploma than any other types of postsecondary qualification.
Women’s educational attainment and the type of postsecondary qualification also varied by characteristics. Indigenous women had the lowest educational attainment of all groups studied in all remoteness areas – but especially those living in very remote areas. In contrast, women designated as visible minorities were the most likely of all groups studied to hold a bachelor’s degree or above, and that, whatever the remoteness areas category.
Finally, fields of study varied only very slightly by remoteness area categories. The two most common fields of study, which, taken together, accounted for about 44% of all fields of study, were business and administration and health care, whatever the remoteness category. There were some variations in the top five fields of study across the remoteness areas, but only in the ranking of them, and no major changes such as the emergence of other fields of study in the top five. Similarly, there was no variation across the remoteness categories for the least common fields of study: legal professions and studies, mathematics and computer and information science, and engineering and engineering technology were, across all remoteness areas, the least common fields of study. As suggest by two of the bottom three fields of study, women remained unlikely to have chosen a STEM field of study. There were some variations by remoteness areas (more women in more accessible areas had a STEM postsecondary qualification than those in more remote areas), but the proportion of women who held a postsecondary qualification in STEM varied more widely by characteristics and by age groups than by remoteness area categories. Indeed, women designated as visible minorities – especially Chinese, Arab and South Asian women – as well as immigrant women were largely more likely to hold a STEM diploma or degree than any other groups studied. Women aged 25 to 34 years were also more likely to have a postsecondary qualification in STEM than women aged 25 to 64 years, suggesting that the percentage of women in STEM may increase over time.
Data sources, methods and definitions
Data sources
Using the 2016 Long-Form Census of Population and the updated Remoteness Index Classification, this second paper of the series looks at the educational attainment of women by the relative remoteness of their communities.
Definitions and Measure
Census of Population
Statistics Canada conducts the Census of Population every five years. It is designed to provide information about people and housing units in Canada by their demographic, social and economic characteristics. The census is the primary source of socioeconomic data for specific population groups (e.g., Indigenous peoples, immigrants, seniors) and for detailed or small geographies (Statistics Canada, 2017d). A sample of approximately 25% of Canadian households received a long-form questionnaire. All other households received a short-form questionnaire. It means that while demographic information is collected from 100% of the population, a random sample of 1 in 4 private dwellings in Canada is selected systematically for the long-form questionnaire.Note For more information about the 2016 Census and the long-form and short-form questionnaires, please consult Statistics Canada’s website.
Remoteness area categories definition and measure
The concepts of urban and rural areas are not clearly defined as several alternative definitions of “urban” and “rural” exist – depending on a country’s geopolitical and sociodemographic composition, but also on the questions or issues being studied (Du Plessis et al., 2001). In Canada, population centres (POPCTRs) or census metropolitan influenced zones (MIZs) have been widely used to distinguish urban and rural communities. POPCTRs classify all communities with a population of less than 1,000 and with a density of less than 400 people per square kilometer as rural (Statistics Canada, 2017c). MIZs subdivide statistical area classifications according to the degree of influence of a census metropolitan area or census agglomeration based on the percentage of the population that commutes to work in one or more of these areas (Statistics Canada, 2016b).
However, neither of these classifications clearly distinguish Canadian communities into urban, rural and remote areas. The concept of POPCTRs takes into account population size and density, but ignores proximity to large urban centres that may provide goods and services to small towns (Subedi et al., 2020). The concept of MIZ does not precisely measure the access to goods and services available within or in proximity to a community and, furthermore, it groups together all Canadian census subdivisions within the territories, despite the fact that some areas are more accessible than others (Subedi et al., 2020).
Proximity to centres of economic activity and population agglomerations have long been recognized as important determinants of socioeconomic opportunities and outcomes of regions (Alasia et al., 2017). In Canada, which is a large country with urban, rural, remote and very remote areas, the urban, rural and remote classification becomes even more important to better describe and understand the specific and very different realities of diverse communities.
Statistics Canada recently developed a new remoteness index (RI) which assigns a relative remoteness value to each census subdivision, based on proximity to agglomerations, and which also captures the dimension of the accessibility of services in these communities (Alasia et al., 2017; Subedi et al., 2020). Indeed, the RI was developed by combining data from official statistical sources like the Census of Population with data from non-official statistical sources such as Google Map API (Alasia et al., 2017). The RI takes a census subdivision (CSD) as geographic units of analysis, and the index value was computed by combining the geographic layers of the CSD and the POPCTR (Alasia et al., 2017; Subedi et al., 2020). Each CSD’s RI value was determined based on the CSD’s relative proximity to all surrounding POPCTRs (Subedi et al., 2020). The population size of each POPCTR was used as a proxy for service availability. The RI calculation accounts for all POPCTRs that could be potential locations for goods, services and economic activities for the reference CSD (Alasia et al., 2017; Subedi et al., 2020). For this study, we use the updated RI, which includes index values for all CSDs in Canada that reported a population in 2016.
The RI is a continuous scale from 0 to 1 – where 0 is the most accessible area (easily accessible) and 1 is the least accessible area (very remote). Using the manual classification of remoteness index values based on natural breaks, population count and distribution of census subdivision form the new RI classification, the CSDs were grouped by their relative remoteness into five mutually exclusive categories: easily accessible; accessible; less accessible; remote; and, very remote areas (Subedi et al., 2020).
Appendix A – Fields of Study of women aged 25 to 64 years with a postsecondary qualification, by remoteness area categories and by characteristics
| Canada | Easily accessible | Accessible | Less accessible | Remote | Very remote | |
|---|---|---|---|---|---|---|
| percent | ||||||
| STEM | 10.6 | 11.6 | 8.5 | 6.9 | 6.5 | 5.4 |
| Science and science technology | 5.0 | 5.4 | 4.4 | 3.5 | 3.4 | 2.2 |
| Engineering and engineering technology | 2.8 | 3.1 | 2.1 | 1.7 | 1.6 | 1.9 |
| Mathematics and computer and information science | 2.8 | 3.2 | 2.0 | 1.7 | 1.6 | 1.3 |
| BHASE (non-STEM) | 89.4 | 88.4 | 91.5 | 93.1 | 93.5 | 94.6 |
| Business and administration | 24.1 | 24.0 | 23.9 | 25.5 | 25.2 | 22.1 |
| Arts and humanities | 9.9 | 11.2 | 7.4 | 5.3 | 5.1 | 5.3 |
| Social and behavioural sciences | 12.3 | 13.3 | 10.6 | 8.8 | 8.6 | 11.2 |
| Legal professions and studies | 2.6 | 2.8 | 2.2 | 1.6 | 1.2 | 0.9 |
| Health care | 20.3 | 18.6 | 24.4 | 25.8 | 24.7 | 19.1 |
| Education and teaching | 8.8 | 8.1 | 9.9 | 10.6 | 12.1 | 18.6 |
| Trades, services, natural resources and conservation | 11.5 | 10.4 | 13.1 | 15.6 | 16.6 | 17.4 |
| Source: Statistics Canada, 2016 Census and Remoteness Index Classification. | ||||||
| Canada | Easily accessible | Accessible | Less accessible | Remote | Very remote | |
|---|---|---|---|---|---|---|
| percent | ||||||
| STEM | 5.8 | 6.9 | 5.8 | 4.8 | 4.5 | 3.7 |
| Science and science technology | 2.4 | 3.1 | 2.4 | 2.0 | 1.6 | 0.8 |
| Engineering and engineering technology | 1.7 | 1.9 | 1.7 | 1.5 | 1.6 | 1.7 |
| Mathematics and computer and information science | 1.6 | 2.0 | 1.6 | 1.3 | 1.3 | 1.2 |
| BHASE (non-STEM) | 94.2 | 93.1 | 94.2 | 95.2 | 95.5 | 96.3 |
| Business and administration | 22.6 | 21.5 | 22.2 | 23.3 | 25.9 | 22.0 |
| Arts and humanities | 6.1 | 8.4 | 5.5 | 4.3 | 3.9 | 4.6 |
| Social and behavioural sciences | 12.1 | 13.2 | 11.6 | 10.8 | 11.1 | 13.8 |
| Legal professions and studies | 2.4 | 3.3 | 2.6 | 1.8 | 1.1 | 0.7 |
| Health care | 22.6 | 21.5 | 25.2 | 24.3 | 21.1 | 16.8 |
| Education and teaching | 9.2 | 7.0 | 8.9 | 9.8 | 11.4 | 19.0 |
| Trades, services, natural resources and conservation | 19.1 | 18.2 | 18.3 | 20.8 | 21.0 | 19.3 |
| Source: Statistics Canada, 2016 Census and Remoteness Index Classification. | ||||||
| Canada | Easily accessible | Accessible | Less accessible | Remote | Very remote | |
|---|---|---|---|---|---|---|
| percent | ||||||
| STEM | 17.0 | 17.1 | 16.5 | 15.6 | 16.0 | 12.8 |
| Science and science technology | 6.9 | 6.9 | 6.8 | 5.9 | 6.4 | 5.3 |
| Engineering and engineering technology | 5.0 | 5.0 | 5.1 | 4.9 | 4.1 | 1.5 |
| Mathematics and computer and information science | 5.1 | 5.2 | 4.7 | 4.8 | 5.5 | 6.0 |
| BHASE (non-STEM) | 83.0 | 82.9 | 83.5 | 84.3 | 84.0 | 86.5 |
| Business and administration | 26.8 | 26.9 | 25.4 | 26.4 | 26.8 | 21.8 |
| Arts and humanities | 10.7 | 10.8 | 9.4 | 8.0 | 7.3 | 6.0 |
| Social and behavioural sciences | 11.7 | 11.9 | 10.3 | 8.8 | 8.7 | 8.3 |
| Legal professions and studies | 2.0 | 2.1 | 1.5 | 1.4 | 1.0 | 0.0 |
| Health care | 19.4 | 19.1 | 22.8 | 24.4 | 22.9 | 21.8 |
| Education and teaching | 5.8 | 5.6 | 7.2 | 7.3 | 9.5 | 19.5 |
| Trades, services, natural resources and conservation | 6.6 | 6.6 | 6.9 | 8.2 | 7.9 | 9.0 |
| Source: Statistics Canada, 2016 Census and Remoteness Index Classification. | ||||||
| Canada | Easily accessible | Accessible | Less accessible | Remote | Very remote | |
|---|---|---|---|---|---|---|
| percent | ||||||
| STEM | 16.9 | 17.3 | 14.5 | 13.1 | 12.7 | 12.4 |
| Science and science technology | 6.6 | 6.7 | 6.4 | 5.6 | 5.8 | 6.0 |
| Engineering and engineering technology | 5.4 | 5.5 | 4.5 | 4.0 | 3.6 | 3.2 |
| Mathematics and computer and information science | 5.0 | 5.1 | 3.7 | 3.4 | 3.2 | 3.2 |
| BHASE (non-STEM) | 83.1 | 82.7 | 85.5 | 87.0 | 87.3 | 87.2 |
| Business and administration | 26.0 | 26.3 | 23.5 | 24.5 | 23.8 | 18.3 |
| Arts and humanities | 11.1 | 11.3 | 10.2 | 8.7 | 9.0 | 9.6 |
| Social and behavioural sciences | 11.5 | 11.7 | 10.6 | 9.1 | 9.1 | 8.3 |
| Legal professions and studies | 2.1 | 2.1 | 1.7 | 1.4 | 1.2 | 1.4 |
| Health care | 18.6 | 18.1 | 22.5 | 24.7 | 23.7 | 20.6 |
| Education and teaching | 6.2 | 6.0 | 8.2 | 8.7 | 9.2 | 18.3 |
| Trades, services, natural resources and conservation | 7.5 | 7.2 | 8.8 | 9.8 | 11.2 | 9.6 |
| Source: Statistics Canada, 2016 Census and Remoteness Index Classification. | ||||||
References
Alasia, Alessandro, Bédard, Frédéric, Bélanger, Julie, Guimond, Eric and Christopher Penney. May 2017. “Measuring Remoteness and Accessibility: A Set of Indices for Canadian Communities” in Reports on Special Business Products, Statistics Canada Catalogue no. 18-001-X, Ottawa: Statistics Canada. Online: http://www.statcan.gc.ca/pub/18-001-x/18-001-x2017002-eng.htm
Arriagada, Paula. 2015. “Participation in extracurricular activities and high school completion among off-reserve First Nations people” in Insights on Canadian Society, Statistics Canada Catalogue 75-006-X. Online: https://www150.statcan.gc.ca/n1/pub/75-006-x/2015001/article/14175-eng.htm
Battiste, Marie. 2013. Decolonizing Education: Nourishing the Learning Spirit, UBC Press.
Bérard-Chagnon, Julien and Marie-Noëlle Parent. January 2021. “Coverage of the 2016 Census: Level and trends” in Demographic Documents, Statistics Canada Catalogue no. 91F0015M. Online: https://www150.statcan.gc.ca/n1/pub/91f0015m/91f0015m2020003-eng.htm
Berger, Joseph, Motte, Anne and Andrew Parkin. 2009. The Price of Knowledge; Access and Student Finance in Canada, Canada Millennium Scholarship Foundation. Online: https://qspace.library.queensu.ca/bitstream/handle/1974/5780/POKVol4_EN.pdf;jsessionid=F360CD8F2AABF441AC33A640F355E64A?sequence=1
Beshiri, Roland and Emily Alfred. 2002. “Immigrants in Rural Canada” in Rural and Small Town Canada Analysis Bulletin, Vol. 4, No. 2, Statistics Canada Catalogue no. 21-006-XIE. Online: https://www150.statcan.gc.ca/n1/pub/21-006-x/21-006-x2002002-eng.pdf
Canadian Apprenticeship Forum (CAF-FCA). 2021. Apprentice Demand in Red Seal Trades: A 2021 National Labour Market Information Report. Online: https://caf-fca.org/wp-content/uploads/2021/05/CAF_Report_LMI-2021_EN_National_-FINAL-1.pdf
Canadian Apprenticeship Forum (CAF-FCA). 2018.Apprenticeship in Canada. Research Insights Based on Data, Trends and Observations. Online: https://caf-fca.org/wp-content/uploads/2018/06/Apprenticeship-in-Canada_2018.pdf
Canadian Chamber of Commerce. 2011. The Business Case for Investing in Canada’s Remote Communities. Online: http://ctcg.org/wp-content/uploads/2013/03/The_Business_Case_for_Investing_in_Canadas_Remote_Communities0911.pdf
Carr, Jeffrey. 2011. Increasing the Participation of Rural Canadians in Postsecondary Education, BC : Simon Fraser University. Online: https://core.ac.uk/download/pdf/56376299.pdf
Cartwright, Fernando and Mary K. Allen. 2002. “Understanding the rural-urban reading gapn” in Education, skills and learning Research papers, Statistics Canada Catalogue no. 81-595-MIE2002001. Online: http://publications.gc.ca/Collection/CS81-595-MIE2002001E.pdf
Conference Board of Canada. 2013a. “High-School Completion” in International Ranking. Canada benchmarked against 15 countries. Online: https://www.conferenceboard.ca/hcp/Details/education/high-school-graduation-rate.aspx
Conference Board of Canada. 2013b. Percentage of Graduates in Science, Math, Computer Science, and Engineering. Online: https://www.conferenceboard.ca/hcp/Details/education/graduates-science-math-computer-science-engineerin.aspx
Dionne-Simard, Dominique, Galarneau, Diane, and Sébastien Larochelle-Côté. 2016. “Women in Scientific Occupations in Canada” in Insights on Canadian Society, Statistics Canada Catalogue no. 75-006-X. Online: https://www150.statcan.gc.ca/n1/pub/75-006-x/2016001/article/14643-eng.htm
Du Plessis, Valérie, Beshiri, Roland, Bollman, Ray D., and Heather Clemenson. 2001. “Definitions of Rural” in Rural and Small Town in Canada Analysis Bulletin, Statistics Canada Catalogue no. 21-006-XIE, Vol. 3, No.3. Online: https://www150.statcan.gc.ca/n1/pub/21-006-x/21-006-x2001003-eng.pdf
Federation of Canadian Municipalities (FCM). 2018. Rural challenges, national opportunity. Shaping the future of rural Canada, FCM. Online: https://fcm.ca/sites/default/files/documents/resources/report/rural-challenges-national-opportunities.pdf
Ferguson, Sarah-Jane. 2016. “Women and Education: Qualifications, Skills and Technology” in Women in Canada: A Gender-based Statistical Report, Statistics Canada Catalogue no. 89-503-X. Online: https://www150.statcan.gc.ca/n1/pub/89-503-x/2015001/article/14640-eng.htm
Frank, Kristyn, Frenette, Marc, and René Morissette. 2015. “Labour Market Outcomes of Young Postsecondary Graduates, 2005 to 2012” in Economic Insights, Statistics Canada Catalogue no. 11-626-X. Online: https://www150.statcan.gc.ca/n1/pub/11-626-x/11-626-x2015050-eng.htm
Frank, Kristyn and Emily Jovic. 2017. “Canada Overview Report, 2015” in National Apprenticeship Survey, Statistics Canada Catalogue no. 81-598-X. Online: https://publications.gc.ca/collections/collection_2017/statcan/81-598-x/81-598-x2017001-eng.pdf
Gordon, Catherine E. and Jerry P. White. 2014. “Indigenous Educational Attainment in Canada” in The International Indigenous Policy Journal, Vol. 5, Issue 3. Online: https://ojs.lib.uwo.ca/index.php/iipj/article/view/7438
Hango, Darcy and Patrice de Broucker. 2007. “Education-to-Labour Market Pathways of Canadian Youth: Findings from the Youth in Transition Survey” in Culture, Tourism and the Centre for Education Statistics Research papers. Statistics Canada Catalogue no. 81-595-MIE – No. 054. On line: https://publications.gc.ca/collections/collection_2007/statcan/81-595-M/81-595-MIE2007054.pdf
Infrastructure Canada. 2019. Rural Opportunity, National Prosperity. An Economic Development Strategy for Rural Canada, Infrastructure Canada Catalogue no. T94-13/2019E-PDF. Online: http://www.infrastructure.gc.ca/pub/index-eng.html
Jin, Hyeongsuk, Langevin, Manon, Lebel, André et Michel Haan. 2020. « Factors associated with the completion of apprenticeship training in Canada » in Insights on Canadian Society, Statistics Canada Catalogue no. 75-006-X. Online: https://www150.statcan.gc.ca/n1/pub/75-006-x/2020001/article/00008-eng.htm
Leclerc, Karine. 2021. “Portrait of Women by the Relative Remoteness of their Communities – Series 1: Sociodemographic Profile” in Studies on Gender and Intersecting Identities, Statistics Canada Catalogue no. 45200002. Online: https://www150.statcan.gc.ca/n1/pub/45-20-0002/452000022021001-eng.htm
National Collaborating Centre for Aboriginal Health. 2017. “Education as a Social Determinant of First Nations, Inuit and Métis Health” in Social Determinant of Health, BC : Prince George. Online: https://www.ccnsa-nccah.ca/docs/determinants/FS-Education-SDOH-2017-EN.pdf
Organisation for Economic Co-operation and Development (OECD). 2014. “Indicator A7: What are the incentives to invest in education?” in Education at a Glance 2014: OECD Indicators, OECD Publishing. Online: https://www.oecd-ilibrary.org/docserver/eag-2014-12-en.pdf?expires=1639403345&id=id&accname=guest&checksum=DD897AD8E0881346ED7FD82DB60691B7
Organisation for Economic Co-operation and Development (OECD). 2020. “Chapter 2. Profile of Indigenous Canada: Trends and data needs”, in Linking Indigenous Communities with Regional Development in Canada, OECD Rural Policy Reviews, OECD Publishing, Paris. Online: https://www.oecd-ilibrary.org/sites/e6cc8722-en/index.html?itemId=/content/component/e6cc8722-en
Reid, Alana, Hui (Amy) Chen, and Rebecca Guertin. 2020. “Labour market outcomes of postsecondary graduates, class of 2015”, in Education, learning and training: Research Paper Series,Statistics Canada Catalogue no. 81-595-M. Online: https://www150.statcan.gc.ca/n1/pub/81-595-m/81-595-m2020002-eng.htm
Restoule, Jean-Paul, Mashford-Pringle, Angela, Chacaby, Maya, Smillie, Christine, Brunette, Candace, and Gail Russel. 2013. “Supporting successful transitions to post-secondary education for Indigenous students: Lessons from an institutional ethnography in Ontario, Canada” in The International Indigenous Policy Journal, Vol. 4, Issue 4. Online: https://ir.lib.uwo.ca/iipj/vol4/iss4/4/
Royal Bank of Canada (RBC). 2021. Powering Up: Preparing Canada's skilled trades for a post-pandemic economy, RBC Thought Leadership. Online: https://thoughtleadership.rbc.com/powering-up-preparing-canadas-skilled-trades-for-a-post-pandemic-economy/
Sisco, Ashley, Caron-Vuotari, Margaret, Stonebridge, Carole, Sutherland, Greg and Gilles Rhéaume. 2012. Lessons Learned: Achieving Positive Educational Outcomes in Northern Communities, Conference Board of Canada. Online: https://www.conferenceboard.ca/e-library/abstract.aspx?did=4658
Standing Committee on Human Resources, Skills and Social Development and the Status of Persons with Disabilities (HUMA). 2012. 6th Report: SKILLS DEVELOPMENT IN REMOTE RURAL COMMUNITIES IN AN ERA OF FISCAL RESTRAINT. Online: https://www.ourcommons.ca/Content/Committee/411/HUMA/Reports/RP5686006/humarp06/humarp06-e.pdf
Statistics Canada. 2020. “Study: Completing apprenticeship training in Canada”, in Daily, Statistics Canada Catalogue no. 11-001-X. Online: https://www150.statcan.gc.ca/n1/daily-quotidien/201209/dq201209a-eng.htm
Statistics Canada. 2019a. Canada’s educational portrait, 2016 Census of Population, Statistics Canada Catalogue no. 11-627-M. Online: https://www150.statcan.gc.ca/n1/pub/11-627-m/11-627-m2017036-eng.htm
Statistics Canada. 2019b. “Registered apprenticeship training programs, 2018”, in Daily, Statistics Canada Catalogue no. 11-001-X. Online: https://www150.statcan.gc.ca/n1/daily-quotidien/191211/dq191211c-eng.htm
Statistics Canada. 2019c. Incompletely enumerated Indian reserves and Indian settlements. Statistics Canada. Online: https://www12.statcan.gc.ca/census-recensement/2016/ref/dq-qd/iir-rii-eng.cfm
Statistics Canada. 2017a. “Education in Canada: Key results from the 2016 Census”, in The Daily, Statistics Canada Catalogue no. 11-001-X. Online: https://www150.statcan.gc.ca/n1/daily-quotidien/171129/dq171129a-eng.htm
Statistics Canada. 2017b. “Education indicators in Canada: An international perspective, 2017”, in The Daily, Statistics Canada Catalogue no. 11-001-X. Online: https://www150.statcan.gc.ca/n1/daily-quotidien/171212/dq171212a-eng.htm
Statistics Canada. 2017c. “Does education pay? A comparison of earnings by level of education in Canada and its provinces and territories” in Census in Brief. Statistics Canada Catalogue no. 98-200-X2016024. https://www12.statcan.gc.ca/census-recensement/2016/as-sa/98-200-x/2016024/98-200-x2016024-eng.cfm
Statistics Canada. 2017d. Guide to the Census of Population, 2016. Statistics Canada. Catalogue no. 98-304-X2016001. Online: https://www12.statcan.gc.ca/census-recensement/2016/ref/98-304/index-eng.cfm
Statistics Canada. 2017e. Aboriginal peoples reference guide, Census of Population, 2016, Statistics Canada Catalogue no. 98-500-X2016009. Online: https://www12.statcan.gc.ca/census-recensement/2016/ref/guides/009/98-500-x2016009-eng.cfm
Statistics Canada. 2017f. “Are young bachelor’s degree holders finding jobs that match their studies?” in Census in Brief, Statistics Canada Catalogue no. 98-200-X2016025. Online: https://www12.statcan.gc.ca/census-recensement/2016/as-sa/98-200-x/2016025/98-200-x2016025-eng.cfm
Statistics Canada. 2016 Census of Population, Statistics Canada Catalogue no. 98-400-X2016265.
Statistics Canada. 2011a. National Household Survey, Statistics Canada Catalogue no. 99-012-X2011044.
Statistics Canada. 2011b. National Household Survey, Statistics Canada Catalogue no. 99-012-X2011047.
Statistics Canada. 2006 Census of Population, Statistics Canada Catalogue no. 97-560-XCB2006022.
Statistics Canada. 2001 Census of Population, Statistics Canada Catalogue no. 97F0017XCB2001005.
Status of Women Canada (SWC). 2016. A Profile of Canadian Women in Rural, Remote and Northern Communities. Online: https://cfc-swc.gc.ca/abu-ans/wwad-cqnf/wnc-fcn/profile-eng.pdf
Subedi, Rajendra, Roshanafshar, Shirin and T. Lawson Greenberg. August 2020. “Developing Meaningful Categories for Distinguishing Levels of Remoteness in Canada”, in Analytical Studies: Methods and References, Statistics Canada Catalogue no. 11-633-X, Ottawa: Statistics Canada. Online: https://www150.statcan.gc.ca/n1/pub/11-633-x/11-633-x2020002-eng.htm
Subedi, Rajendra, Greenberg, Lawson and Shirin Roshanafshar. May 2019. “Does geography matter in mortality? An analysis of potentially avoidable mortality by remoteness index in Canada”, in Health Reports, Statistics Canada Catalogue no. 82-003-X, Ottawa: statistics Canada. Online: https://www150.statcan.gc.ca/n1/pub/82-003-x/2019005/article/00001-eng.htm
Turcotte, Martin. 2020. “Results from the 2016 Census: Education and labour market integration of Black youth in Canada”, in Insights on Canadian Society, StatisticsCanada Catalogue no. 75-006-X. Online: https://www150.statcan.gc.ca/n1/pub/75-006-x/2020001/article/00002-eng.htm
Truth and Reconciliation Commission of Canada. 2015. Honouring the truth, reconciling for the future: summary of the final report of the Truth and Reconciliation Commission of Canada, Library and Archives Canada, Catalogue no. IR4-7/2015E-PDF. Online: https://ehprnh2mwo3.exactdn.com/wp-content/uploads/2021/01/Executive_Summary_English_Web.pdf
United Nations Statistics Division (UNSD). 2020. “Canada: female graduates in science, technology, engineering and mathematics (STEM) at the tertiary level of education” in The World’s Women 2020: Trends and Statistics. Online: https://worlds-women-2020-data-undesa.hub.arcgis.com
Uppal, Sharanjit. 2017. “Young men and women without a high school diploma,” in Insights on Canadian Society. Statistics Canada Catalogue no. 75-006-X. Online: https://www150.statcan.gc.ca/n1/pub/75-006-x/2017001/article/14824-eng.htm
Wall, Katherine. 2019. “Persistence and representation of women in STEM programs”, in Insights on Canadian Society, Statistics Canada Catalogue no. 75-006-X. Online: https://www150.statcan.gc.ca/n1/pub/75-006-x/2019001/article/00006-eng.htm
Wallin, Dawn. 2009. Rural Education: A Review of Provincial and Territorial Initiatives, Canadian Council on Learning. Online: https://www.edu.gov.mb.ca/k12/docs/reports/rural_ed/rural_ed_final.pdf
White, Jerry, P. and Julie Peters. 2013. “The Challenges in Improving Indigenous Educational Attainment” in The International Indigenous Policy Journal, Vol. 4, No. 4. Online: https://ojs.lib.uwo.ca/index.php/iipj/article/view/7420
- Date modified: