
Studies on Gender and Intersecting Identities
Portrait of Women by the Relative Remoteness of their Communities, Series 1: Sociodemographic Profile
Skip to text
Text begins
Start of text boxHighlights
- Women and girls in Canada comprised just over half of Canada’s population with over two-thirds living in easily accessible areas (based on proximity to service accessibility). However, the distribution of the female population across communities with varying degrees of remoteness differed greatly from one province or territory to another.
- The distribution of the female population across the remoteness area categories also varied depending on characteristics such as Indigenous identity, immigration background and ethnocultural characteristics.
- The majority of Indigenous women and girls (58.2%) lived in easily accessible or accessible areas. However, they were underrepresented in these areas relative to non-Indigenous women and girls and were increasingly overrepresented as the communities were more remote. For example, while Indigenous women and girls represented 4.9% of the female population in Canada, they accounted for 72.5% of the female population living in very remote areas.
- The vast majority (91.5%) of the female population designated as visible minorities lived in easily accessible areas and only a very small proportion lived in remote and very remote areas.
- While the majority (88.0%) of the female immigrant population lived in easily accessible areas, very recent immigrant women and girls, i.e. those who arrived in Canada as permanent residents between 2011 and 2016, were slightly more likely than more established immigrant women and girls to be living outside these easily accessible areas (14.9% vs 11.6%).
- In 2016, the median age of the female population was 41.6 years. This median age, however, varied by the characteristics of the groups. The Indigenous women and girls population, which was overrepresented in very remote areas, had the youngest median age (30.3 years) of all female populations. The median age of women and girls designated as visible minorities was also lower (34.9 years) than the overall female population (41.6 years). In contrast, the median age of immigrant women and girls was higher (48.7 years).
- Population aging and the aging of the workforce have been evident in Canada’s overall population. However, given that the age structure of the female population differed by varying levels of remoteness, the aging intensity varied from one remoteness area category to another. Less accessible and remote areas had a more pronounced aging phenomenon than the rest of Canada (with higher female median ages and percentages of senior women combined with lower proportions of women in the core working age), while very remote areas had the youngest female median age, the lowest proportion of women aged 65 years and over and were the only areas where the proportion of potential labour force entrants was higher than potential retirees.
- The average number of people per family as well as the distribution of the census family types varied from one region to another – with very remote areas being especially distinct from other areas; very remote areas had the lowest proportion of couples without children, highest proportion of couples with three children or more, and highest percentage of lone-parent families when compared with areas with other levels of remoteness.
Acknowledgments
This study is funded by the Department for Women and Gender Equality.
Introduction
Worldwide, living in a rural area remains one of the most significant drivers of inequality for women (Lévesque, 2018). Women in rural areas experience difficulties in engaging in economic activities, shoulder a disproportionate burden of unpaid care and household work, and are at high risk of experiencing different forms of gender-based violence (UNCSW, 2018; ILO, 2019). Rural women make up over a quarter of the world’s population, but they are disproportionately affected by poverty and exclusion and they fared worse than rural men and urban women in virtually every gender and development indicator for which data were available in 2018, including literacy, education, health and sanitation, and poverty (UNCSW, 2018). Globally, gender inequalities in rural areas are pervasive in every dimension of sustainable development and, in many areas, the progress has been so limited that international bodies assess that these Sustainable Development Goals will likely not be achieved by 2030 (UNCSW, 2018).Note
In Canada, previous studies have shown that women living in rural areas had lower educational attainment than their urban counterparts and had lower labour force participation rates, lower employment rates, and were overrepresented in low-income situations (SWC, 2016). Generally speaking, rural areas play an important role in Canada’s prosperity. They supply food, water and energy, provide important recreational opportunities, and they contribute to nearly 30% of the country’s total gross domestic product (Infrastructure Canada, 2019; FCM, 2018). However, rural incomes tend to lag behind those of urban communities, and unemployment levels tend to be higher (Infrastructure Canada, 2019). Paradoxically, the higher unemployment rate in rural communities coexists with significant labour shortages – particularly for skilled workers (including those with the skill sets needed to work in the digital economy) – which, in turn, limits growth (Infrastructure Canada, 2019). With limited fiscal capacity, rural governments also face important challenges in providing the needed infrastructure and services to their communities. The limited access to the communications infrastructure and the lack of broadband connectivity,Note for example, may impede rural industries and communities from taking full advantage of innovative technologies (to do business and to better run public services) in order to grow or remain competitive (CRTC, 2020).
The overrepresentation of rural women in low-income situations and their lower labour force participation rates are not without effects on their health outcomes. Research suggests that poverty and health are closely connected (Public Health Agency of Canada, 2016 and 2014). Social determinants such as income, education, and gender may impact health outcomes, which, in turn, may impact individuals’ well-being, their capacity to participate in the economy, and their engagement in their communities. Rural women in Canada report poorer health outcomes (Leipert, 2005; Sibley and Weiner, 2011). While rural location in itself does not necessarily lead to poor health, previous research has shown that rural living affects women’s health, not only because of geographic isolation or limited access to health services, but also due to sociocultural characteristics that influence health-seeking behaviours (Lavergne and Kephart, 2012; Centres of Excellence for Women’s Health, 2004). As such, rurality appears as “a powerful determinant of women’s health, as both a geographic and sociocultural influence” (Centres of Excellence for Women’s Health, 2004).
Rural women in Canada are also at higher risk of different forms of gender-based violence. For example, in 2019, women living in rural areas experienced the highest overall rates of intimate partner violence in Canada with rates that were significantly higher than their urban counterparts (860 versus 467 per 100,000 population) (Conroy, 2021). Police-reported data also shows that, in 2017, rates of sexual offences were higher in rural areas than urban areas for girls aged 11 years and younger (303 versus 153 per 100,000 population, respectively) as well as for girls aged 12 to 17 years (1,274 versus 835 per 100,000 population) (Conroy, 2018).
Overall, previous research suggests that women living in rural areas are characterized by different sociocultural, socioeconomic and demographic trajectories that distinguish their experiences from urban women. The experience of all rural women is not the same and there is noticeable heterogeneity within and between rural communities in Canada in terms of population size, density, geographic characteristics and degree of remoteness or proximity to urban centres. Even the definition of “rural” is not clear. While the ideas of distance and density are generally accepted, the precise definition and the standards are widely debated and vary depending on a country’s geopolitical and sociodemographic composition (Subedi et al., 2020). Statistics Canada has defined urban areas as population centres with a population size of at least 1,000 and a density of 400 persons per square kilometre (Statistics Canada, 2016a). With this definition, however, no clear distinction is made between rural and remote areas in Canada.
Recently, Statistics Canada developed a new remoteness index (RI) which refines these categories by further differentiating communities by their remoteness. It assigns a relative remoteness value to each census subdivision – based on proximity to census agglomerations as a proxy for services accessibility (Alasia et al., 2017).Note Paired with the new RI classification, this tool allows the grouping of census subdivisions by their relative remoteness into five categories: easily accessible; accessible; less accessible; remote; and, very remote areas (Subedi et al., 2020). These refined categories have the potential for a better differentiation, description and understanding of the very different realities of diverse rural communities.
Using this new RI classification, this statistical report is the first of a series of four papers on the socioeconomic and sociodemographic profile of women living in communities at varying levels of remoteness. This first report of the series focuses specifically on the distribution and profile (such as age, family type, and identity characteristics) of women and girls by the relative remoteness of their communities. A second report, to be published at a later date, will focus on women’s educational attainment. The third one will study and compare the health and well-being of women. Finally, the last report will be on the economic participation of women. All of these reports will present the results by varying levels of remoteness.
Distribution of the female population in Canada
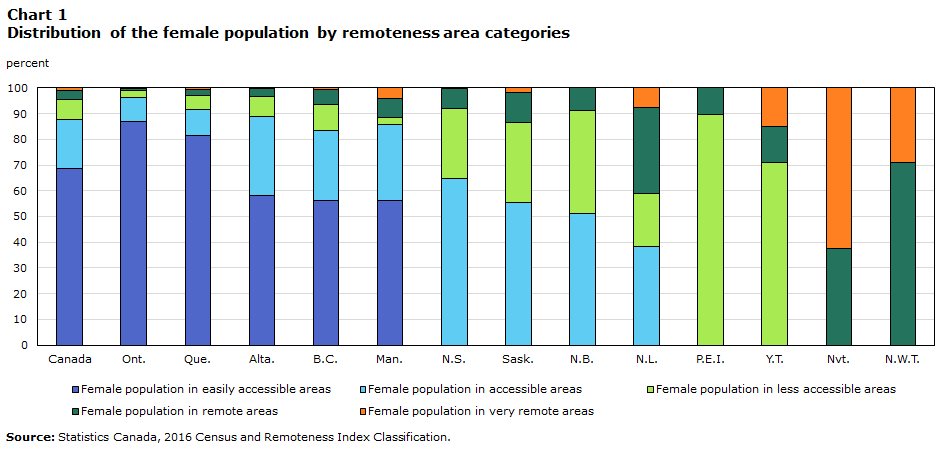
Women and girls in Canada comprised just over half of Canada’s population (50.8%)Note Note in 2016 and they mainly lived in easily accessible areas (68.5%), followed by accessible areas (19.2%), less accessible areas (7.7%), remote areas (3.8%) and very remote areas (0.8%) (Chart 1).Note
Data table for Chart 1
| Female population in easily accessible areas | Female population in accessible areas | Female population in less accessible areas | Female population in remote areas | Female population in very remote areas | |
|---|---|---|---|---|---|
| percent | |||||
| Canada | 68.5 | 19.2 | 7.7 | 3.8 | 0.8 |
| Ont. | 87.0 | 9.3 | 2.6 | 0.9 | 0.3 |
| Que. | 81.7 | 10.1 | 5.2 | 2.5 | 0.5 |
| Alta. | 58.2 | 30.7 | 7.7 | 3.1 | 0.4 |
| B.C. | 56.4 | 27.1 | 9.9 | 6.1 | 0.5 |
| Man. | 56.2 | 29.6 | 2.6 | 7.4 | 4.3 |
| N.S. | 0.0 | 64.9 | 27.2 | 7.8 | 0.0 |
| Sask. | 0.0 | 55.3 | 31.1 | 11.8 | 1.8 |
| N.B. | 0.0 | 51.2 | 40.2 | 8.7 | 0.0 |
| N.L. | 0.0 | 38.4 | 20.5 | 33.7 | 7.4 |
| P.E.I. | 0.0 | 0.0 | 89.5 | 10.5 | 0.0 |
| Y.T. | 0.0 | 0.0 | 71.1 | 13.9 | 15.0 |
| Nvt. | 0.0 | 0.0 | 0.0 | 37.7 | 62.3 |
| N.W.T. | 0.0 | 0.0 | 0.0 | 71.0 | 29.0 |
| Source: Statistics Canada, 2016 Census and Remoteness Index Classification. | |||||
However, the distribution of the female population across the remoteness area categories varied greatly from one province or territory to another. Ontario, Québec and Alberta were the provinces with the highest share of women and girls in easily accessible areas – with very few women and girls in remote and very remote areas (Chart 1). In contrast, Nunavut, Northwest Territories, and Newfoundland and Labrador were the provinces or territories with the highest share of the female population in remote and very remote areas (Chart 1).
The distribution of the female population across the remoteness area categories also varied significantly depending on the specific characteristics of the groups, such as Indigenous, visible minority or immigrant status.
Indigenous women and girls are overrepresented in very remote areas
The distribution of Indigenous women and girlsNote across the remoteness area categories followed a similar pattern, albeit to a lesser extent, to the overall population in Canada. The majority of Indigenous women and girls (58.2%) lived in easily accessible or accessible areas and 26.7% of Indigenous women and girls lived in remote or very remote areas (Table 1).
| Population - Indigenous women and girls | Percentage - Indigenous women and girls | Population - women and girls | Percentage - women and girls | Population - Non-Indigenous women and girls | Percentage - Non-Indigenous women and girls | |
|---|---|---|---|---|---|---|
| number | percent | number | percent | number | percent | |
| Regions | ||||||
| Canada | 860,265 | 100.0 | 17,488,485 | 100.0 | 16,628,225 | 100.0 |
| Easily accessible areas | 278,445 | 32.4 | 11,985,985 | 68.5 | 11,707,540 | 70.4 |
| Accessible areas | 221,870 | 25.8 | 3,352,080 | 19.2 | 3,130,210 | 18.8 |
| Less accessible areas | 129,640 | 15.1 | 1,354,690 | 7.7 | 1,225,055 | 7.4 |
| Remote areas | 134,490 | 15.6 | 663,630 | 3.8 | 529,140 | 3.2 |
| Very remote areas | 95,815 | 11.1 | 132,100 | 0.8 | 36,280 | 0.2 |
| Source: Statistics Canada, 2016 Census and Remoteness Index Classification. | ||||||
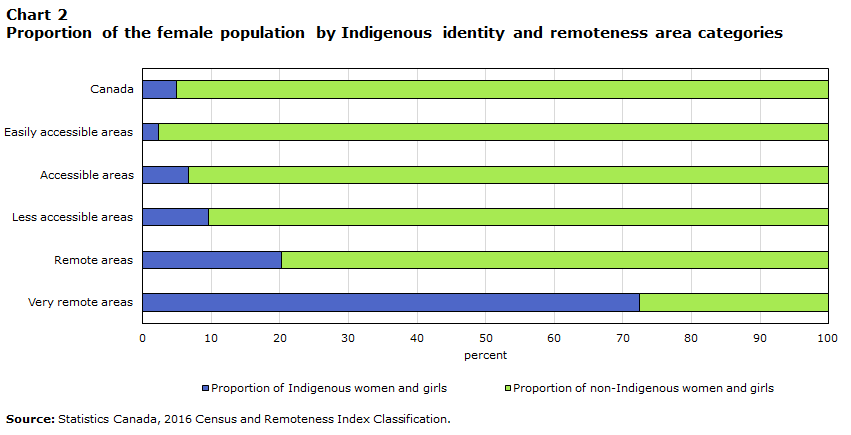
However, the representation of Indigenous women and girls increased with the remoteness of the communities. As a result, while Indigenous women and girls represented 4.9% of the female population in Canada, they were underrepresented in easily accessible areas, where they accounted for only 2.3% of the female population living in these regions, and were increasingly overrepresented as the communities became more remote. Indigenous women and girls accounted for 6.6% of the female population in accessible areas, 9.6% in less accessible areas, 20.3% in remote areas, and 72.5% in very remote areas (Chart 2).Note
Data table for Chart 2
| Proportion of Indigenous women and girls | Proportion of non-Indigenous women and girls | |
|---|---|---|
| percent | ||
| Canada | 4.9 | 95.1 |
| Easily accessible areas | 2.3 | 97.7 |
| Accessible areas | 6.6 | 93.4 |
| Less accessible areas | 9.6 | 90.4 |
| Remote areas | 20.3 | 79.7 |
| Very remote areas | 72.5 | 27.5 |
| Source: Statistics Canada, 2016 Census and Remoteness Index Classification. | ||
Visible minority women and girls are almost absent in remote and very remote areas
According to the 2016 Census, 22.3% of the population in Canada was a member of a population group designated as a visible minority – as defined by the Employment Equity ActNote – and female visible minorities represented close to one quarter (22.6%) of the overall female population.
The vast majority (91.5%) of the female visible minority population lived in easily accessible areas, where they represented 30.2% of the female population. In contrast, less than 1.0% of the total female visible minority population in Canada lived in remote and very remote areas. Their shares of the female population in these areas were much smaller than the national proportion: 2.9% and 1.0%, respectively, for remote and very remote areas as opposed to 22.6% of the overall female population in Canada (Chart 3).Note

Data table for Chart 3
| Distribution of the female visible minority population | Representation of the female visible minority population within the female population | |
|---|---|---|
| percent | ||
| Canada | 100.0 | 22.6 |
| Easily accessible areas | 91.5 | 30.2 |
| Accessible areas | 6.6 | 7.8 |
| Less accessible areas | 1.4 | 4.1 |
| Remote areas | 0.5 | 2.9 |
| Very remote areas | 0.0 | 1.0 |
| Source: Statistics Canada, 2016 Census and Remoteness Index Classification. | ||
The make-up of the female population designated as visible minorities varies by community remoteness
In Canada, the population designated as visible minorities consists mainly of the following groups: South Asian; Chinese; Black; Filipino; Arab; Latin American; Southeast Asian; West Asian; Korean; and, Japanese.
The South Asian, Chinese and Black female populations represented the three largest female population groups designated as visible minorities in 2016 in Canada (Chart 4). However, the distribution of these groups varied by the relative remoteness of the communities.
For example, South Asian women and girls were the largest female population group designated as visible minorities in easily accessible and accessible areas. About one in four (24.1%) visible minority women and girls were South Asian in these communities.
In comparison, in less accessible, remote and very remote areas, Filipino women and girls represented the largest share of the female visible minority population, where they accounted for 27.0%, 32.0% and 26.7% of the female population group designated as visible minorities, respectively (Chart 4).
The Chinese female population, which was the second largest visible minority group in Canada (21.0%) and in easily accessible areas (21.6%), dropped out of the top three largest visible minority groups in less accessible, remote and very remote areas (Chart 4).
Black women were overrepresented among the female visible minority population in very remote areas (20.0%), the second highest visible minority group after Filipino women. A table of the six largest visible minority groups by remoteness area categories can be found in Appendix A.

Data table for Chart 4
| Canada | Easily accessible areas | Accessible areas | Less accessible areas | Remote areas | Very remote areas | |
|---|---|---|---|---|---|---|
| percent | ||||||
| South Asian | 24.0 | 24.5 | 19.1 | 18.9 | 15.7 | 13.6 |
| Chinese | 21.0 | 21.6 | 15.8 | 12.7 | 11.0 | 11.2 |
| Black | 15.7 | 15.6 | 16.3 | 17.7 | 15.6 | 20.0 |
| Filipino | 11.1 | 10.3 | 17.2 | 27.0 | 32.0 | 26.7 |
| Source: Statistics Canada, 2016 Census and Remoteness Index Classification. | ||||||
Very recent immigrant women and girls are more likely than other female immigrants to be living outside easily accessible areas
According to the 2016 Census, immigrants accounted for 21.9% of the population in Canada, and female immigrants accounted for 22.6% of the total female population. The vast majority (88.0%) of the female immigrant population lived in easily accessible areas, followed by accessible areas (8.9%), less accessible areas (2.1%), remote areas (0.9%) and very remote areas (0.1%) (Chart 5).Note
The tendency of immigrants to settle mostly in urban areasNote – even in Canada’s three largest urban centres – has been a long-standing trend in Canada (Statistics Canada, 2018a). As Canada relies on immigration for population growth, the small share of immigrant women in less accessible, remote and very remote areas suggests that these communities benefit less from immigration, leaving these areas to shrink in both population and economic impact (Carter et al., 2008; Ouattara and Tranchant, 2007; Bruce, 2007).
However, recent trends indicate that the settlement patterns of immigrants may be changing. The proportion of immigrants’ settlement in certain medium-size peripheral municipalities (also known as suburbanization) has grown in recent years (Vézina and Houle, 2017). Moreover, likely as a result of efforts and new policy and planning initiatives to attract immigrants outside of major cities,Note some researchers have noted that there are more newcomers that are settling outside of the core areas in favour of small and rural towns (Patel et al., 2019; Carter et al., 2008).
In Canada, in 2016, among immigrant women and girls, 15.9% were very recent immigrants, 14.0% were recent immigrants and 70.0% were established immigrants.Note The distribution of very recent, recent and established female immigrants across the remoteness categories followed the same pattern as all immigrant women; they lived mainly in easily accessible areas and their representation decreased as the remoteness index increased. However, very recent female immigrants were slightly more likely than recent and established female immigrants to be living in other areas – especially in accessible areas (which may correspond to the trend of suburbanization of immigrants), but also in less accessible and remote areas (Chart 5). This slightly higher proportion of very recent immigrant women in other remoteness area categories, nevertheless, is most likely not enough to make a significant impact on population growth and labour force renewal in these areas. The majority of newcomer women and girls still tended to settle in easily accessible areas.

Data table for Chart 5
| Established immigrant women | Recent immigrant women | Very recent immigrant women | Total - Immigrant women | |
|---|---|---|---|---|
| percent | ||||
| Easily accessible areas | 88.5 | 88.4 | 85.2 | 88.0 |
| Accessible areas | 8.6 | 8.7 | 10.9 | 8.9 |
| Less accessible areas | 2.0 | 2.1 | 2.9 | 2.1 |
| Remote areas | 0.9 | 0.7 | 1.0 | 0.9 |
| Very remote areas | 0.1 | 0.1 | 0.1 | 0.1 |
| Source: Statistics Canada, 2016 Census and Remoteness Index Classification. | ||||
Very remote areas have the lowest median age of all areas and less accessible areas the highest
According to the 2016 Census, the female median age (the age at which 50% of the female population is older and 50% is younger) was 41.6 years in Canada (Chart 6). However, it varied significantly by the level of remoteness and by the characteristics of the groups.
The female median age was 40.9 years in easily accessible areas, 42.7 years in accessible areas, 45.3 years in less accessible areas, 44.7 years in remote areas and 31.0 in very remote areas (Chart 6).
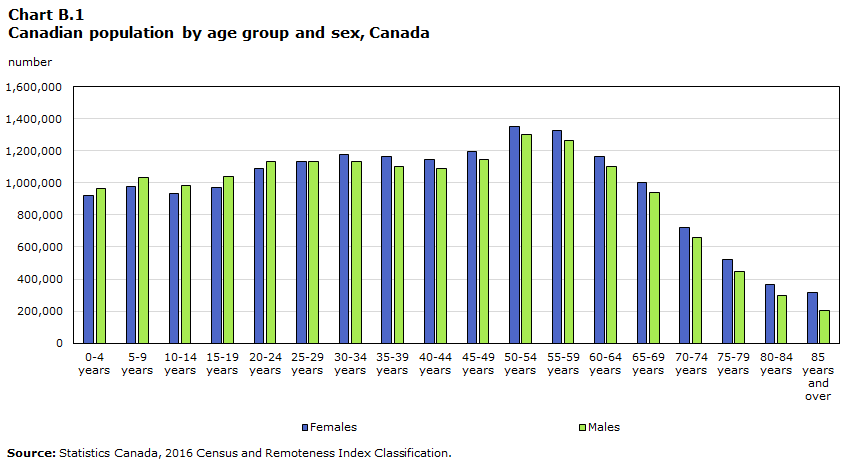
The lower median age of women and girls in very remote areas can be explained, first, by the age composition (the number of persons in each age group) of the female population in these areas, where the two age groups with the highest number of persons were 5 to 9 years and 0 to 4 years (Appendix B). Second, it can also be explained by the overrepresentation of Indigenous women and girls in these areas. Indeed, the median age of Indigenous women and girls was younger than the overall female population in Canada (30.3 years vs 41.6 years, respectively) (Chart 6).

Data table for Chart 6
| Canada | Easily accessible areas | Accessible areas | Less accessible areas | Remote areas | Very remote areas | |
|---|---|---|---|---|---|---|
| percent | ||||||
| Total - Women and girls | 41.6 | 40.9 | 42.7 | 45.3 | 44.7 | 31.0 |
| Indigenous women and girls | 30.3 | 32.3 | 29.6 | 31.5 | 30.1 | 25.0 |
| Visible minority women and girls | 34.9 | 35.2 | 31.8 | 32.1 | 34.0 | 37.3 |
| Immigrant women and girls | 48.7 | 48.4 | 50.3 | 50.9 | 54.2 | 56.7 |
| Source: Statistics Canada, 2016 Census and Remoteness Index Classification. | ||||||
Indigenous women tend to be younger
The median age of Indigenous women and girls in Canada (30.3 years) was the youngest when compared to the total female population (41.6 years), visible minority women (34.9 years) and their immigrant counterparts (48.7 years) (Chart 6).
These median ages also varied by remoteness area categories. The median age of Indigenous women and girls was the lowest in very remote areas (25.0 years) and the highest in easily accessible areas (32.3 years) (Chart 6).
In contrast to the female Indigenous population, the median ages of visible minority and immigrant women and girls living in very remote areas (37.3 and 56.7 years, respectively) were not lower, but rather higher than those living in easily accessible areas (35.2 and 48.4 years, respectively) (Chart 6).
The female population is aging faster in less accessible and remote areas
While population aging and the aging of the workforce are evident in Canada’s overall population, the aging intensity varied from one remoteness area category to another. In addition to the median age, other indicators, such as the proportion of the population in the core working age group (25 to 54 years), the proportion of the population aged 65 years and over, as well as the proportion of potential labour market entrants and retirees, can be used to measure the extent to which a population, including its workforce, is aging.
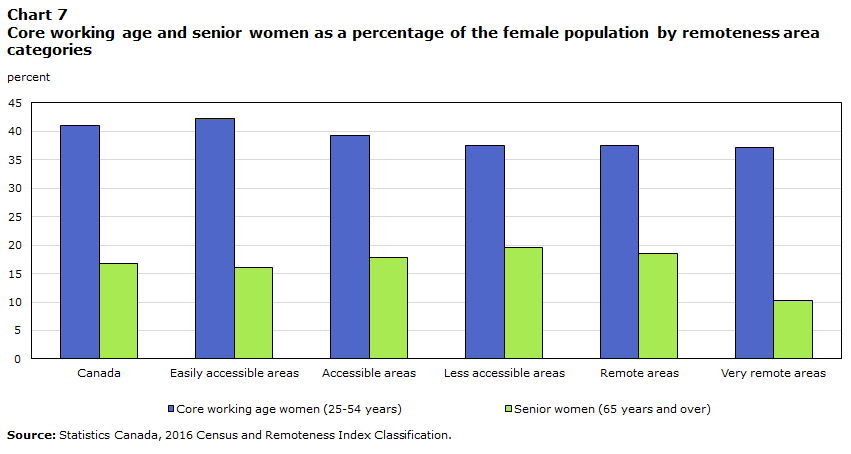
According to the 2016 Census, women aged 25 to 54 years (in the core working age group) accounted for 41.0% of the female population, and those aged 65 years and over accounted for 16.7% in Canada (Chart 7). In parallel, the proportion of potential female entrants in the labour market (those aged 15 to 24 years) was lower than those potentially or preparing to exit the labour market (those aged 55 to 64 years) (11.8% vs 14.2%, respectively), suggesting that more women may exit the labour market than enter it in the coming years (Charts 7 and 8).
Data table for Chart 7
| Canada | Easily accessible areas | Accessible areas | Less accessible areas | Remote areas | Very remote areas | |
|---|---|---|---|---|---|---|
| percent | ||||||
| Core working age women (25-54 years) | 41.0 | 42.2 | 39.2 | 37.5 | 37.5 | 37.2 |
| Senior women (65 years and over) | 16.7 | 16.1 | 17.8 | 19.5 | 18.5 | 10.2 |
| Source: Statistics Canada, 2016 Census and Remoteness Index Classification. | ||||||

Data table for Chart 8
| Canada | Easily accessible areas | Accessible areas | Less accessible areas | Remote areas | Very remote areas | |
|---|---|---|---|---|---|---|
| percent | ||||||
| Potential female entrants (15-24 years) | 11.8 | 12.1 | 11.4 | 10.5 | 10.5 | 14.8 |
| Potential retirees (55-64 years) | 14.2 | 13.6 | 15.1 | 16.5 | 16.5 | 11.0 |
| Source: Statistics Canada, 2016 Census and Remoteness Index Classification. | ||||||
The easily accessible areas were the areas with the largest proportion of women in the core working age (42.2%), when compared with all other remoteness area categories (Chart 7). At the same time, young women who were about to enter the labour market (those aged 15 to 24 years) accounted for 12.1% of the female population in the easily accessible areas and those who were about to exit the labour market (women aged 55 to 64 years) made up 13.6% of the female population (Chart 8). While better than the Canadian labour force replacement ratio, this result still suggests that more women may exit the labour market than enter it in the coming years in easily accessible areas.
Less accessible and remote areas were the areas with the lowest proportions of potential labour market entrants (10.5% for both areas) and the highest proportions of potential retirees (16.5% for both), suggesting that less accessible and remote areas had the biggest challenge in terms of labour force replacement ratio if these areas could not attract more labour market entrants or women of core working age from outside their communities (Chart 8).
These two remoteness area categories were also where the female median age was the oldest of all remoteness area categories (Chart 6) and where the proportions of women aged 65 years and over were the highest (Chart 7). Finally, the proportions of women in the core working age were lower in less accessible areas and remote areas than the national average – but was not the lowest of all areas (Chart 7).
In summary, less accessible and remote areas fared worse than any other remoteness area categories on all but one indicator used to measure the extent to which a population is aging. This higher share of senior women, combined with a low proportion of working age women, likely puts pressure on the workforce and on the federal, provincial or territorial, and municipal public programs and services (senior dependency),Note such as health and pension systems.
Very remote areas are the only regions where there are proportionally more potential labour market entrants than potential retirees
The very remote area category stood in contrast to the two other non-urban areas (less accessible and remote areas) with the youngest female median age (31.0 years) and the lowest proportion of women aged 65 years and over (10.2%) of all areas (Charts 6 and 7). The higher fertility rate and shorter life expectancy of Indigenous women, who were overrepresented in these areas, largely contributed to having young populations in these areas (Arriagada, 2016; Morency et al., 2015; Public Health Agency of Canada, 2018).
The very remote areas were also the only areas where the difference between the potential labour market entrants and retirees was positive, i.e. the proportion of potential entrants (14.8%) was higher than potential retirees (11.0%) (Chart 8). However, its proportion of women in the core working age was not the highest. On the contrary, core working age women accounted for only 37.2% of the female population, the lowest proportion of all remoteness area categories (Chart 7), which suggests that the workforce and public services and programs may also be under pressure, but for different kind of programs and services (e.g. education system, daycares, versus a need for more services geared towards older women such as the pension system) (youth dependency).Note
While a lot of attention is paid to the consequences of population aging, it seems that very remote areas are facing the opposite issue of age dependency (i.e. youth dependency versus senior dependency). While both put pressure on the workforce, the consequences and the pressures on the public system and institutions are different (e.g. education system versus pension system).
Family characteristics
According to the 2016 Census, the average size of census families in Canada was 2.9 persons.Note The average number of people per family varied from one region to another, especially for the very remote areas. It was: 2.9 in easily accessible areas; 2.8 in accessible areas; 2.7 in less accessible areas; 2.8 in remote areas; and, 3.2 in very remote areas. This higher average size of census families in very remote areas can be explained by the overrepresentation of Indigenous women (and especially Inuit women) in these areas and their higher fertility rates than the non Indigenous population (Morency et al., 2015).
Very remote areas have the highest proportions of couples with three children or more and lone-parent families
In 2016, 40.9% of the census families in Canada were couples without children; another 42.7% were couples with children; and, 16.4% were lone-parent families (Chart 11). The distribution of the family types varied across the remoteness area categories, with the largest contrasts found for the very remote areas.

Data table for Chart 9
| Couples without children | Couples with children | Lone-parent census families | |
|---|---|---|---|
| percent | |||
| Canada | 40.9 | 42.7 | 16.4 |
| Easily accessible areas | 38.2 | 44.9 | 16.9 |
| Accessible areas | 45.8 | 39.3 | 14.9 |
| Less accessible areas | 48.7 | 36.2 | 15.2 |
| Remote areas | 48.0 | 36.0 | 16.0 |
| Very remote areas | 30.1 | 42.2 | 27.7 |
| Source: Statistics Canada, 2016 Census and Remoteness Index Classification. | |||
The very remote areas were the regions with the smallest proportion of couples without children of all remoteness area categories, but were not the areas with the highest proportion of couples with children (it was easily accessible areas) – likely because of the high percentage of lone-parent families in very remote areas (Chart 9).
Among couples with children, the very remote areas had the highest proportion of couples with three or more children and the lowest proportion of couples with only one child and with two children (Chart 9). These results are consistent with the higher total fertility rate of Indigenous women – who are overrepresented in very remote areas (Arriagada, 2016; Morency et al., 2015).
The very remote areas also had by far the highest proportion of lone-parent families (27.7% compared with 16.4% for the national average). This result is consistent with the higher proportion of lone-parents, especially lone-mothers, among the Indigenous population (Arriagada, 2016; O’Donnell and Wallace, 2011). In Canada, among lone-parent families, 78.3% were headed by women in 2016. While the majority of lone-parent families largely remained headed by women across all remoteness area categories, the percentage varied from one area to another. Women accounted for 79.2% of lone-parent families in easily accessible areas, 76.9% in accessible areas, 76.1% in less accessible areas, 74.3% in remote areas, and 72.2% in very remote areas.
Finally, the proportion of women and girls not living in a census family, i.e. those living alone, with other relatives or with non-relatives,Note was lower in very remote (12.3%) and remote areas (16.3%) but similar (about 18%) across the remaining remoteness area categories. The living arrangements of these women not living in a census family, however, varied by remoteness area categories. Women and girls not in a census family who lived in very remote areas were more likely to live with other relatives (39.8%) – compared with 15.7% for easily accessible, 11.7% for accessible, 11.5% for less accessible, and 14.5% for remote areas – and less likely to be living with non-relatives (11.0%) than women living in any other areas (18.3% in easily accessible, 18.6% in accessible, 15.2% in accessible, and 13.8% in remote areas).
Conclusion
Canada is a large and diverse country with diverse rural communities; some are coastal, others are northern, some are closer to urban centres while others are very remote. As shown in this report, there were significant sociodemographic differences between, on the one hand, women living in easily accessible and accessible areas and, on the other hand, those living in less accessible, remote and very remote areas. There were also important differences between these non-urban communities – especially between very remote areas and the other two non-urban communities, i.e. less accessible and remote areas.
Indigenous women and girls were overrepresented and immigrant women and girls as well as those designated as visible minorities were underrepresented in less accessible, remote and very remote areas.
The age composition was also different across the remoteness area categories. The median ages of women and girls in less accessible and remote areas were higher, the proportions of core working age women were lower, and the proportions of senior women were higher than those in easily accessible and accessible areas. In contrast to these non-urban areas, very remote areas had the lowest female median age and they were the only regions where the proportion of potential labour market entrants was higher than potential retirees.
The family characteristics were also different across areas of various remoteness index. Less accessible areas had the highest proportion of couples without children, followed by remote areas. Among couples who had only one child, the remote areas had the highest proportion, followed by less accessible areas. In contrast, very remote areas had the lowest proportion of couples without children and the highest proportion of couples with three children or more of all remoteness area categories. The very remote areas also had the highest percentage of lone-parent families of all areas.
In this context of large variations from one remoteness area category to another, including between less accessible, remote and very remote areas, refined categorization of “rural” areas becomes essential to better describe and understand the specific and very different realities of diverse communities, as well as to effectively plan and develop programs and policy directed toward women and girls.
Data sources, methods and definitions
Data sources
Using the 2016 Long-Form Census of Population and the updated Remoteness Index Classification, this first paper of the series looks at the sociodemographic profile of women and girls by the relative remoteness of their communities.
Definitions and Measures
Census of Population
Statistics Canada conducts the Census of Population every five years. It is designed to provide information about people and housing units in Canada by their demographic, social and economic characteristics. The census is the primary source of socioeconomic data for specific population groups and for detailed or small geographies. A sample of approximately 25% of Canadian households received a long-form questionnaire. All other households received a short-form questionnaire. It means that while demographic information is collected from 100% of the population,Note a random sample of 1 in 4 private dwellings in Canada is selected systematically for the long-form questionnaire. For more information about the 2016 Census and the long-form and short-form questionnaire, please consult Statistics Canada’s website.
Remoteness area categories definition and measure
The concepts of urban and rural areas are not clearly defined as several alternative definitions of “urban” and “rural” exist – depending on a country’s geopolitical and sociodemographic composition, but also on the questions or issues being studied (Du Plessis et al., 2001). In Canada, population centres (POPCTRs) or census metropolitan influenced zones (MIZs) have been widely used to distinguish urban and rural communities. POPCTRs classify all communities with a population of less than 1,000 and with a density of less than 400 people per square kilometer as rural (Statistics Canada, 2017a). MIZs subdivide statistical area classifications according to the degree of influence of a census metropolitan area or census agglomeration based on the percentage of the population that commutes to work in one or more of these areas (Statistics Canada, 2016b).
However, neither of these classifications clearly distinguish Canadian communities into urban, rural and remote areas. The concept of POPCTRs takes into account population size and density, but ignores proximity to large urban centres that may provide goods and services to small towns (Subedi et al., 2020). The concept of MIZ does not precisely measure the access to goods and services available within or in proximity to a community and, furthermore, it groups together all Canadian census subdivisions within the territories, despite the fact that some areas are more accessible than others (Subedi et al., 2020).
Proximity to centres of economic activity and population agglomerations have long been recognized as important determinants of socioeconomic opportunities and outcomes of regions (Alasia et al., 2017). In Canada, which is a large country with urban, rural, remote and very remote areas, the urban, rural and remote classification becomes even more important to better describe and understand the specific and very different realities of diverse communities.
Statistics Canada recently developed a new remoteness index (RI) which assigns a relative remoteness value to each census subdivision, based on proximity to agglomerations, and which also captures the dimension of the accessibility of services in these communities (Alasia et al., 2017; Subedi et al., 2020). Indeed, the RI was developed by combining data from official statistical sources like the Census of Population with data from non-official statistical sources such as Google Map API (Alasia et al., 2017). The RI takes a census subdivision (CSD) as geographic units of analysis, and the index value was computed by combining the geographic layers of the CSD and the POPCTR (Alasia et al., 2017; Subedi et al., 2020). Each CSD’s RI value was determined based on the CSD’s relative proximity to all surrounding POPCTRs (Subedi et al., 2020). The population size of each POPCTR was used as a proxy for service availability. The RI calculation accounts for all POPCTRs that could be potential locations for goods, services and economic activities for the reference CSD (Alasia et al., 2017; Subedi et al., 2020). For this study, we used the updated RI, which includes index values for all CSDs in Canada that reported a population in 2016.
Although the RI is a continuous scale (from 0 to 1, where 0 is the most accessible (easily accessible) area and 1 is the least accessible (very remote) area), the new RI classification allows to group census subdivisions by their relative remoteness into five categories: easily accessible; accessible; less accessible; remote; and, very remote areas (Subedi et al., 2020).
Appendix A
| South Asian | Chinese | Black | Filipino | Arab | Latin American | |
|---|---|---|---|---|---|---|
| percent | ||||||
| Canada | 24.0 | 21.0 | 15.7 | 11.1 | 6.3 | 5.9 |
| Easily accessible areas | 24.5 | 21.6 | 15.6 | 10.3 | 6.2 | 5.8 |
| Accessible areas | 19.1 | 15.8 | 16.3 | 17.2 | 8.0 | 6.3 |
| Less accessible areas | 18.9 | 12.7 | 17.7 | 27.0 | 4.3 | 5.7 |
| Remote areas | 15.7 | 11.0 | 15.6 | 32.0 | 2.3 | 5.0 |
| Very remote areas | 13.6 | 11.2 | 20.0 | 26.7 | 6.4 | 5.6 |
| Source: Statistics Canada, 2016 Census and Remoteness Index Classification. | ||||||
Appendix B
Data table for Chart B.1
| Canada | ||
|---|---|---|
| Females | Males | |
| number | ||
| 0-4 years | 924,245 | 967,260 |
| 5-9 years | 979,360 | 1,031,920 |
| 10-14 years | 932,300 | 981,965 |
| 15-19 years | 973,425 | 1,036,625 |
| 20-24 years | 1,087,905 | 1,133,775 |
| 25-29 years | 1,135,475 | 1,130,565 |
| 30-34 years | 1,176,135 | 1,134,405 |
| 35-39 years | 1,166,705 | 1,103,975 |
| 40-44 years | 1,145,995 | 1,091,100 |
| 45-49 years | 1,195,675 | 1,143,665 |
| 50-54 years | 1,353,645 | 1,298,995 |
| 55-59 years | 1,325,875 | 1,266,850 |
| 60-64 years | 1,163,330 | 1,099,010 |
| 65-69 years | 1,004,305 | 939,110 |
| 70-74 years | 722,160 | 661,680 |
| 75-79 years | 519,210 | 449,325 |
| 80-84 years | 364,690 | 297,015 |
| 85 years and over | 318,055 | 204,335 |
| Source: Statistics Canada, 2016 Census and Remoteness Index Classification. | ||

Data table for Chart B.2
| Easily accessible areas | ||
|---|---|---|
| Females | Males | |
| number | ||
| 0-4 years | 627,495 | 655,595 |
| 5-9 years | 661,785 | 696,920 |
| 10-14 years | 631,275 | 666,040 |
| 15-19 years | 669,605 | 709,650 |
| 20-24 years | 777,545 | 806,495 |
| 25-29 years | 814,620 | 806,105 |
| 30-34 years | 835,870 | 802,730 |
| 35-39 years | 826,895 | 777,305 |
| 40-44 years | 809,810 | 761,885 |
| 45-49 years | 841,295 | 798,950 |
| 50-54 years | 923,795 | 887,275 |
| 55-59 years | 878,855 | 835,800 |
| 60-64 years | 756,090 | 703,540 |
| 65-69 years | 654,720 | 595,285 |
| 70-74 years | 470,675 | 421,520 |
| 75-79 years | 344,755 | 288,375 |
| 80-84 years | 244,915 | 193,275 |
| 85 years and over | 215,980 | 136,605 |
| Source: Statistics Canada, 2016 Census and Remoteness Index Classification. | ||
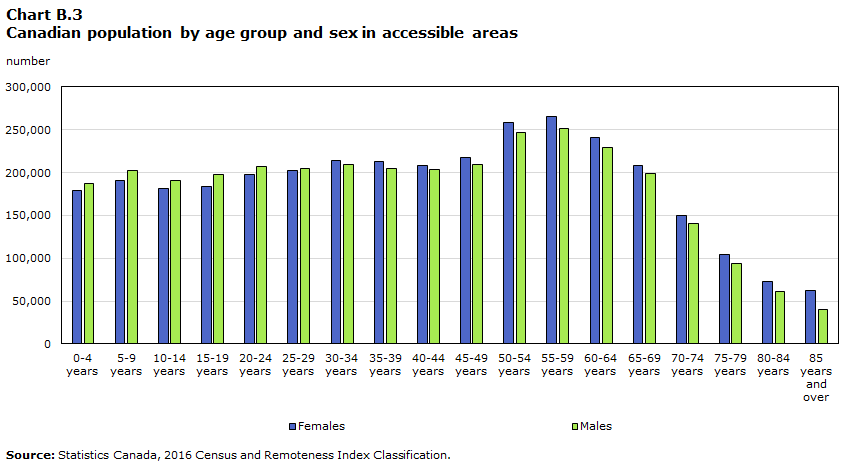
Data table for Chart B.3
| Accessible areas | ||
|---|---|---|
| Females | Males | |
| number | ||
| 0-4 years | 178,950 | 187,670 |
| 5-9 years | 190,725 | 202,160 |
| 10-14 years | 181,635 | 190,310 |
| 15-19 years | 183,740 | 197,295 |
| 20-24 years | 198,370 | 207,115 |
| 25-29 years | 203,025 | 204,755 |
| 30-34 years | 213,815 | 209,645 |
| 35-39 years | 213,420 | 204,700 |
| 40-44 years | 208,710 | 204,070 |
| 45-49 years | 217,135 | 209,910 |
| 50-54 years | 258,790 | 246,440 |
| 55-59 years | 265,695 | 252,025 |
| 60-64 years | 241,215 | 228,945 |
| 65-69 years | 208,460 | 198,955 |
| 70-74 years | 149,800 | 140,090 |
| 75-79 years | 103,870 | 94,150 |
| 80-84 years | 72,430 | 61,790 |
| 85 years and over | 62,305 | 40,420 |
| Source: Statistics Canada, 2016 Census and Remoteness Index Classification. | ||

Data table for Chart B.4
| Less accessible areas | ||
|---|---|---|
| Females | Males | |
| number | ||
| 0-4 years | 69,610 | 73,535 |
| 5-9 years | 74,780 | 78,370 |
| 10-14 years | 71,320 | 75,050 |
| 15-19 years | 72,905 | 78,175 |
| 20-24 years | 69,615 | 74,080 |
| 25-29 years | 73,780 | 75,160 |
| 30-34 years | 80,195 | 77,880 |
| 35-39 years | 80,445 | 77,645 |
| 40-44 years | 80,100 | 78,505 |
| 45-49 years | 85,385 | 83,735 |
| 50-54 years | 108,725 | 104,085 |
| 55-59 years | 116,600 | 113,080 |
| 60-64 years | 106,925 | 104,775 |
| 65-69 years | 91,370 | 92,200 |
| 70-74 years | 66,970 | 64,405 |
| 75-79 years | 46,605 | 43,410 |
| 80-84 years | 32,045 | 27,830 |
| 85 years and over | 27,310 | 18,310 |
| Source: Statistics Canada, 2016 Census and Remoteness Index Classification. | ||
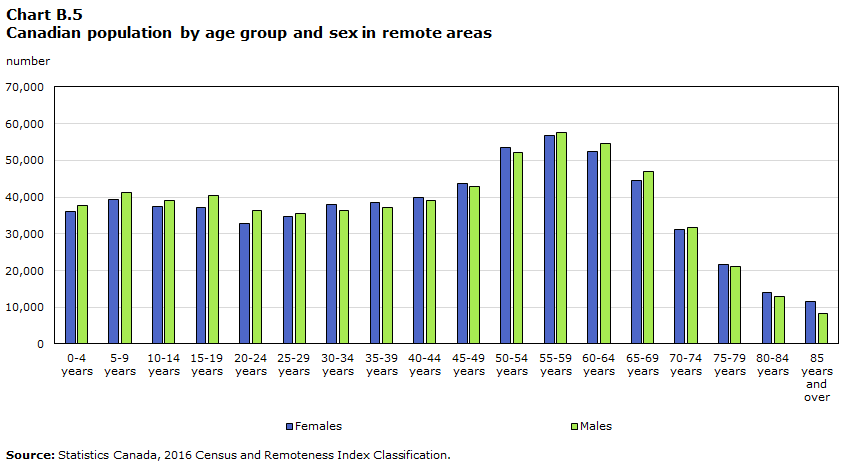
Data table for Chart B.5
| Remote areas | ||
|---|---|---|
| Females | Males | |
| number | ||
| 0-4 years | 36,070 | 37,750 |
| 5-9 years | 39,400 | 41,295 |
| 10-14 years | 37,405 | 39,045 |
| 15-19 years | 37,045 | 40,570 |
| 20-24 years | 32,940 | 36,265 |
| 25-29 years | 34,800 | 35,435 |
| 30-34 years | 38,070 | 36,360 |
| 35-39 years | 38,520 | 37,060 |
| 40-44 years | 39,905 | 39,010 |
| 45-49 years | 43,805 | 42,845 |
| 50-54 years | 53,635 | 52,070 |
| 55-59 years | 56,830 | 57,500 |
| 60-64 years | 52,420 | 54,695 |
| 65-69 years | 44,410 | 46,855 |
| 70-74 years | 31,160 | 31,750 |
| 75-79 years | 21,645 | 20,985 |
| 80-84 years | 13,945 | 12,815 |
| 85 years and over | 11,620 | 8,305 |
| Source: Statistics Canada, 2016 Census and Remoteness Index Classification. | ||
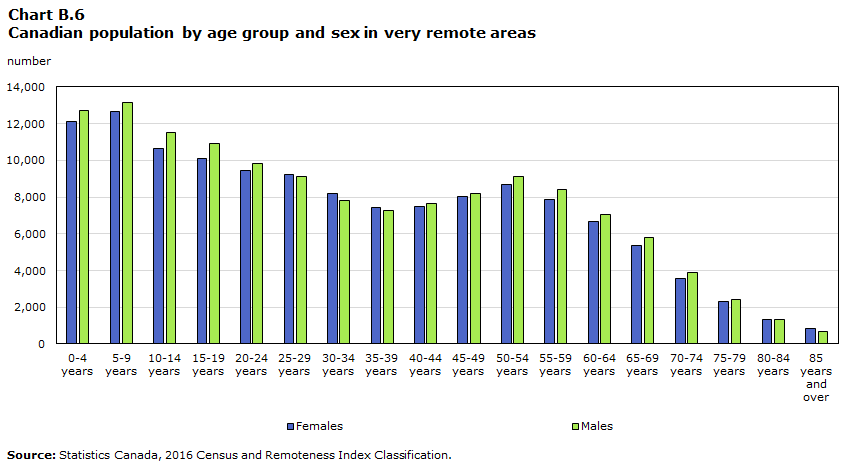
Data table for Chart B.6
| Very remote areas | ||
|---|---|---|
| Females | Males | |
| number | ||
| 0-4 years | 12,120 | 12,700 |
| 5-9 years | 12,665 | 13,175 |
| 10-14 years | 10,660 | 11,525 |
| 15-19 years | 10,130 | 10,930 |
| 20-24 years | 9,435 | 9,815 |
| 25-29 years | 9,240 | 9,110 |
| 30-34 years | 8,185 | 7,790 |
| 35-39 years | 7,420 | 7,265 |
| 40-44 years | 7,470 | 7,630 |
| 45-49 years | 8,060 | 8,220 |
| 50-54 years | 8,705 | 9,130 |
| 55-59 years | 7,895 | 8,440 |
| 60-64 years | 6,675 | 7,055 |
| 65-69 years | 5,350 | 5,815 |
| 70-74 years | 3,560 | 3,915 |
| 75-79 years | 2,340 | 2,410 |
| 80-84 years | 1,355 | 1,310 |
| 85 years and over | 845 | 700 |
| Source: Statistics Canada, 2016 Census and Remoteness Index Classification. | ||
References
Alasia, Alessandro, Bédard, Frédéric, Bélanger, Julie, Guimond, Eric and Christopher Penney. May 2017. “Measuring Remoteness and Accessibility: A Set of Indices for Canadian Communities”, in Reports on Special Business Products, Statistics Canada Catalogue no. 18-001-X, Ottawa: Statistics Canada. Online: http://www.statcan.gc.ca/pub/18-001-x/18-001-x2017002-eng.htm
Arriagada, Paula. 2017. “First Nations, Métis and Inuit Women”, in Women in Canada: A Gender-based Statistical Report, Statistics Canada Catalogue no 89-503-X. Online: https://www150.statcan.gc.ca/n1/pub/89-503-x/2015001/article/14313-eng.htm
Bérard-Chagnon, Julien and Marie-Noëlle Parent. January 2021. “Coverage of the 2016 Census: Level and trends” in Demographic Documents, Statistics Canada Catalogue no. 91F0015M. Online: https://www150.statcan.gc.ca/n1/pub/91f0015m/91f0015m2020003-eng.htm
Bruce, David. Summer 2007. “The Challenges of Immigration as a Rural Repopulation Strategy in Maritime Canada” in Reimer, Bill (ed.), Our Diverse Cities. Rural Communities, no 2. Online: www.metropolis.net
Burczycka, Martha. 2019. “Section 3: Police-reported intimate partner violence in Canada, 2018” in Family violence in Canada: A statistical profile, Statistics Canada Catalogue no. 85-002-X. Online: https://www150.statcan.gc.ca/n1/pub/85-002-x/2019001/article/00018/02-eng.htm
Canadian Radio-television and Telecommunications Commission (CRTC). 2020. Communications Monitoring Report 2019. Online: https://crtc.gc.ca/pubs/cmr2019-en.pdf.
Carter, Tom, Morrish, Margot and Benjamin Amoyaw. 2008. “Attracting Immigrants to Smaller Urban and Rural Communities: Lessons Learned from the Manitoba Provincial Nominee Program”, in Journal of International Migration and Integration, Vol. 9. Online: https://link.springer.com/article/10.1007/s12134-008-0051-2
Centres of Excellence for Women’s Health. 2004. Rural, Remote and Northern Women's Health Policy and Research Directions, Centres of Excellence for Women’s Health, Canadian Women’s Health Network, Vol 7, no. 2-3. Online: http://www.pwhce.ca/RR.htm
Conroy, Shana. 2018. “Police-reported violence against girls and young women in Canada, 2017”, in Juristat, Statistics Canada Catalogue no. 85-002-X. Online: https://www150.statcan.gc.ca/n1/pub/85-002-x/2018001/article/54981-eng.htm
Conroy, Shana. 2019. “Family violence in Canada: A statistical profile, 2018”, in Juristat, Statistics Canada Catalogue no. 85-002-X. Online: https://www150.statcan.gc.ca/n1/pub/85-002-x/2019001/article/00018/01-eng.htm
Conroy, Shana. 2021. “Family violence in Canada: A statistical profile, 2019”, in Juristat, Statistics Canada Catalogue no. 85-002-X. Online: https://www150.statcan.gc.ca/n1/pub/85-002-x/2021001/article/00001-eng.htm
Du Plessis, Valérie, Beshiri, Roland, Bollman, Ray D. and Heather Clemenson. 2001. “Definitions of Rural”, in Rural and Small Town in Canada Analysis Bulletin, Vol. 3, No.3, Statistics Canada Catalogue no. 21-006-XIE.
Federation of Canadian Municipalities (FCM). 2018. Rural challenges, national opportunity. Shaping the future of rural Canada, FCM. Online: https://fcm.ca/sites/default/files/documents/resources/report/rural-challenges-national-opportunities.pdf
Hudon, Tamara and Anne Milan. 2016. “Senior Women”, in Women in Canada: A Gender-based Statistical Report, Statistics Canada Catalogue no. 89-503-X. Online: https://www150.statcan.gc.ca/n1/pub/89-503-x/2015001/article/14316-eng.htm
Infrastructure Canada. 2019. Rural Opportunity, National Prosperity. An Economic Development Strategy for Rural Canada, Infrastructure Canada Catalogue no. T94-13/2019E-PDF. Online: https://www.infrastructure.gc.ca/altformat/pdf/rural/rural-strat-eng.pdf.
International Labour Office (ILO). November 2019. “Empowering Women in the Rural Economy”, in Portfolio of Policy Guidance Notes on the Promotion of Decent Work in the Rural Economy. Online: https://www.ilo.org/wcmsp5/groups/public/---ed_dialogue/---sector/documents/publication/wcms_601071.pdf
Lavergne, Ruth M and George Kephart. 2012. “Examining variations in health within rural Canada”, in Rural Remote Health, Vol 12, Issue 1. Online: https://pubmed.ncbi.nlm.nih.gov/22384808/
Leipert, Beverly D. 2005. “Rural Women’s Health Issues in Canada: An Overview and Implications for Policy and Research”, in Canadian Women's Studies, vol. 24, no. 4.
Lévesque, Anne-Marie. 2018. Empowering rural women and girls is essential to achieve the SDGs, FinDev Canada. Online: https://www.findevcanada.ca/en/blog/empowering-rural-women-and-girls-essential-achieve-sdgs
Martel, Laurent. 2015. “Recent changes in demographic trends in Canada”, in Insights on Canadian Society, Statistics Canada Catalogue no. 75-006-X. Online: https://www150.statcan.gc.ca/n1/pub/75-006-x/2015001/article/14240-eng.pdf
Milan, Anne. 2015. “Female Population”, in Women in Canada, Statistics Canada Catalogue no. 89-503-X. Online: https://www150.statcan.gc.ca/n1/en/pub/89-503-x/2015001/article/14152-eng.pdf?st=nW-sgReX
Milan, Anne. 2013. “Fertility: Overview, 2009 to 2011”, in Report on the Demographic Situation in Canada, Statistics Canada Catalogue no. 91-209-X. Online: https://www150.statcan.gc.ca/n1/pub/91-209-x/2013001/article/11784-eng.htm
Morency, Jean-Dominique, Caron-Malenfant, Éric, Coulombe, Simon and Stéphanie Langlois. 2015. Projections of the Aboriginal Population and Households in Canada, 2011 to 2036, Statistics Canada Catalogue no. 91-552-X. Online: https://www150.statcan.gc.ca/n1/pub/91-552-x/91-552-x2015001-eng.htm
O’Donnell, Vivian and Susan Wallace. 2011. “First Nations, Métis and Inuit Women”, in Women in Canada: A Gender-based Statistical Report, Statistics Canada Catalogue no. 89-503-X. Online: https://www150.statcan.gc.ca/n1/pub/89-503-x/2010001/article/11442-eng.htm#a13
Ouattara, Ibrahim and Carole Tranchant. 2007. “Immigration to Rural Communities: A Distinctive and Distinctly Promising Phenomenon” in Reimer, Bill (ed.) Our Diverse Cities. Rural Communities, no 2. Online: https://www. concordia.ca/content/dam/artsci/sociology-anthropology/nre/docs/reports/ODC_Summer07_3_en.pdf.
Patel, Asiya, Dean, Jennifer, Edge, Sara, Wilson, Kathi and Effat Ghassemi. 2019. “Double Burden of Rural Migration in Canada? Considering the Social Determinants of Health Related to Immigrant Settlement Outside the Cosmopolis”, in International Journal of Environmental Research and Public Health, No 16, Vol 4. Online: https://www.ncbi.nlm.nih.gov/pmc/articles/PMC6427738/
Public Health Agency of Canada. 2018. Key Health Inequalities in Canada: A National Portrait. Online: https://www.canada.ca/content/dam/phac-aspc/documents/services/publications/science-research/key-health-inequalities-canada-national-portrait-executive-summary/key_health_inequalities_full_report-eng.pdf
Sibley, Lyn M. and Jonathan P. Weiner. 2011. “An evaluation of access to health care services along the rural-urban continuum in Canada”, in BMC Health Services Research, 11:20. Online: https://bmchealthservres.biomedcentral. com/track/pdf/10.1186/1472-6963-11-20.pdf.
Statistics Canada. Table 13-10-0425-01 Live births
Statistics Canada. 2016a. Population Centre and Rural Area Classification 2016. Online: http://www.statcan.gc.ca/eng/subjects/standard/pcrac/2016/introduction.
Statistics Canada. November 2016b. “Census Metropolitan Zone (MIZ)”, in Dictionary, Census of Population, 2016. Online: https://www12.statcan.gc.ca/census-recensement/2016/ref/dict/geo010-eng.cfm
Statistics Canada. November 2016c. “Rural Areas (RA)”, in Dictionary, Census of Population, 2016. Online: https://www12.statcan.gc.ca/census-recensement/2016/ref/dict/geo042-eng.cfm
Statistics Canada. 2016d. “Dependency ratio” in Healthy People, Healthy Places, Statistics Canada Catalogue no. 82-229-X. Online: https://www150.statcan.gc.ca/n1/pub/82-229-x/2009001/demo/dep-eng.htm
Statistics Canada. February 2017a. “Population Centres (POPCTRs)”, in Dictionary, Census of Population, 2016. Online: https://www12.statcan.gc.ca/census-recensement/2016/ref/dict/geo049a-eng.cfm
Statistics Canada. 2017b. “Table 1.7 Distribution of population by size of population centre, 2011 and 2016 censuses”, in Dictionary, Census of Population, 2016. Online: https://www12.statcan.gc.ca/census-recensement/2016/ref/dict/tab/t1_7-eng.cfm
Statistics Canada. 2017c. “Immigration and ethnocultural diversity: Key results from the 2016 Census”, in The Daily, Statistics Canada Catalogue no. 11-001-X. Online: https://www150.statcan.gc.ca/n1/daily-quotidien/171025/dq171025b-eng.htm
Statistics Canada. 2018a. “Population Growth: Migratory Increase Overtakes Natural Increase” in The Daily. Canadian Megatrends, Statistics Canada Catalogue no. 11-630-X. Online: www.statcan.gc.ca/pub/11-630-x/11-630-x2014001-eng.htm
Statistics Canada. 2018b. Health-adjusted life expectancy in Canada. Online: https://www150.statcan.gc.ca/n1/pub/82-003-x/2018004/article/54950-eng.htm
Statistics Canada. 2019. “Analysis: Population by age and sex”, in Annual Demographic Estimates: Canada, Provinces and Territories, Catalogue no. 91-215-X.
Status of Women Canada (SWC). 2016. A Profile of Canadian Women in Rural, Remote and Northern Communities. Online: https://cfc-swc.gc.ca/abu-ans/wwad-cqnf/wnc-fcn/profile-eng.pdf
Subedi, Rajendra, Roshanafshar, Shirin and T. Lawson Greenberg. August 2020. “Developing Meaningful Categories for Distinguishing Levels of Remoteness in Canada”, in Analytical Studies: Methods and References, Statistics Canada Catalogue no. 11-633-X, Ottawa: Statistics Canada. Online: https://www150.statcan.gc.ca/n1/pub/11-633-x/11-633-x2020002-eng.htm
Subedi, Rajendra, Greenberg, Lawson and Shirin Roshanafshar. May 2019. “Does geography matter in mortality? An analysis of potentially avoidable mortality by remoteness index in Canada”, in Health Reports, Statistics Canada Catalogue no. 82-003-X, Ottawa: statistics Canada. Online: https://www150.statcan.gc.ca/n1/pub/82-003-x/2019005/article/00001-eng.htm
United Nations Commission on the Status of Women (UNCSW). 2018. Challenges and Opportunities in Achieving Gender Equality and the Empowerment of Rural Women and Girls: Agreed Conclusions of the 2018 Commission of the Status of Women (13-23 March 2018). Online: https://www.unwomen.org/-/media/headquarters/attachments/sections/csw/62/csw-conclusions-62-en.pdf?la=en&vs=4713
Urquijo, Covadonga Robles and Anne Milan. 2011. “Female Population”, in Women in Canada, Statistics Canada Catalogue no. 89-503-X. Online: https://www150.statcan.gc.ca/n1/pub/89-503-x/2010001/article/11475-eng.pdf
Vézina, Mireille and René Houle. 2017. “Settlement patterns and social integration of the population with an immigrant background in the Montréal, Toronto and Vancouver metropolitan areas”, in Ethnicity, Language and Immigration Thematic Series, Statistics Canada Catalogue no. 89-657-X. Online: https://www150.statcan.gc.ca/n1/pub/89-657-x/89-657-x2016002-eng.htm
World Bank. 2021. Data Collection of Development Indicators. Online: https://data.worldbank.org/indicator/SP.POP.BRTH.MF?locations=CA
- Date modified: