
Insights on Canadian Society
Indigenous women and girls: Socioeconomic conditions in remote communities compared with more accessible areas
by Amanda Bleakney and Alexandria Melvin

Text begins
Acknowledgment
This study was funded by Women and Gender Equality Canada (WAGE).
Start of text box
Overview of the study
This study uses Statistics Canada’s newly developed remoteness index classification and data from the 2016 Census of Population to report on the socioeconomic characteristics of First Nations, Métis and Inuit women and girls living in communities with varying levels of remoteness. It provides policy makers with information on how socioeconomic and linguistic characteristics among Indigenous women and girls living in remote areas differ from those among Indigenous women and girls living in more accessible areas.
- In 2016, 795,730 women and girls lived in remote and very remote areas in Canada. Of these, 226,805 were First Nations, Métis or Inuit, representing nearly one-third (29%) of all women and girls living in those areas.
- Inuit women and girls were the most likely to live in remote areas. More than three-quarters (80%) of Inuit women and girls lived in remote and very remote areas, compared with 32% of First Nations women and girls and 13% of Métis women and girls.
- First Nations and Inuit women and girls living in remote and very remote areas were significantly younger than those living in more accessible areas, while non-Indigenous women and girls were typically older. Specifically, in very remote areas, the median age of Inuit (23 years) and First Nations (25 years) women and girls was about half that of their non-Indigenous counterparts (50 years).
- Indigenous women and girls living in very remote and remote areas were more likely to reside in a crowded dwelling or a dwelling in need of major repairs than those living in more accessible areas. This finding was more pronounced for First Nations and Inuit women and girls. For example, almost half (47%) of First Nations women and girls resided in dwellings in need of major repairs in very remote areas, compared with 13% of those living in easily accessible areas.
- Educational attainment declined across all Indigenous groups with increasing remoteness, in particular among First Nations and Inuit women. For example, approximately 4 in 10 Inuit women living in very remote areas had completed high school or a higher level of education (41%), compared with more than 7 in 10 of those living in easily accessible areas (72%).
- Labour force participation, employment rate and employment income generally decreased with increased remoteness for First Nations and Métis women. In contrast, for Inuit women, the same indicators were highest among those living in remote areas.
Introduction
In 2016, approximately half (52%) of Indigenous people resided in urban areas with a population of 30,000 or more.Note However, there were many Indigenous people who lived in rural, remote or northern communities.Note For example, almost three-quarters (73%) of Inuit lived in Inuit Nunangat,Note where the majority of communities are accessible only by air.Note And while some First Nations communities are located within and close to large metropolitan centres, many are located in rural and remote areas. Métis were the most likely to live in a city, with almost two-thirds (63%) living in a metropolitan area in 2016. However, they were much more likely to reside in rural areas than the non-Indigenous population.Note
Indigenous people residing in rural or remote communities often benefit from a closer connection to their communities, cultures, traditions, languages, lands and resources. However, they also face unique barriers and challenges, including difficulty accessing some services, such as medical care, as well as fewer educational and employment opportunities. In addition, the socioeconomic situation of Indigenous women and girls living in rural areas is often less favourable. For example, Indigenous women living in rural areas are less likely to have a university education when compared with urban Indigenous women and urban and rural non-Indigenous women. Also, the median income of rural Indigenous women has been shown to be lower than that of urban Indigenous women and Indigenous men living in either urban or rural areas.Note
Within Canada, demographic studies have often relied on the urban–rural classification, where areas with a population of at least 1,000 and a density of 400 people per square kilometre are classified as urban, and those that do not meet this definition are classified as rural. A limitation of this approach is that it does not take into consideration the heterogeneity of rural communities, particularly in relation to how close a community is to a large population centre. Those communities that are relatively close to population centres can more easily access goods and services offered by the nearby population centre. In contrast, accessing goods and services may be more difficult for those living in remote communities that are farther from large population centres.
In 2017, Statistics Canada developed a remoteness index, which assigns a value to each census subdivision (CSD), or municipality, based on its proximity to surrounding population centres and the population size of these population centres.Note Using the remoteness index classification and data from the 2016 Census of Population, this study uses a distinctions-based approach to report on the socioeconomic and linguistic characteristics of First Nations, Métis and InuitNote women and girls living in communities with varying levels of remoteness. The notable differences in socioeconomic characteristics and outcomes for Indigenous women living in more remote areas compared with those living in more accessible areas can help inform the development of infrastructure, policies and programs focused on improving service accessibility and educational and employment opportunities for Indigenous women and girls living in remote communities.
The remoteness index classificationNote is used to classify CSDs into five categories of remoteness, described as easily accessible areas, accessible areas, less accessible areas, remote areas and very remote areas (see “Data sources, methods and definitions” text box). As First Nations, Métis and Inuit may live within distinct jurisdictional and geographic realities, residence on and off reserve among First Nations and in and outside Inuit Nunangat among Inuit was considered. However, because of their smaller populations, separate results for the eight Métis settlements of Alberta could not be produced.Note
Indigenous women and girls account for nearly three-quarters of the female population living in very remote areas
In 2016, 795,730 women and girls lived in remote and very remote areas in Canada. Of these, 226,805 were First Nations, Métis or Inuit, representing nearly one-third (29%) of all women and girls living in remote and very remote areas.
Indigenous women and girls were much more likely than their non-Indigenous counterparts to live in such areas. This is especially true for Inuit women and girls, over three-quarters (80%) of whom lived in remote and very remote areas (Table 1). While the majority of First Nations and Métis women and girls lived in easily accessible and accessible areas, they were still more likely to live in remote or very remote areas (32% for First Nations and 13% for Métis) than their non-Indigenous counterparts (3%).
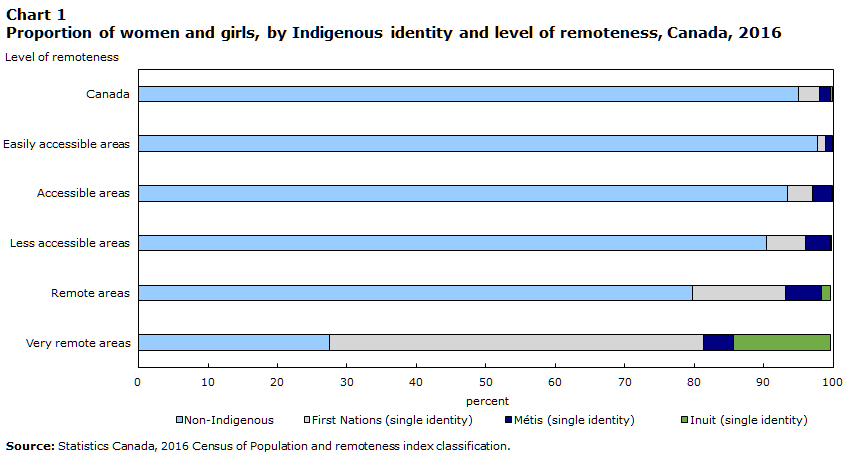
Indigenous women and girls are thus overrepresented in remote and very remote areas, particularly in very remote areas, where they accounted for nearly three-quarters (72%) of the female population living in these communities in 2016. This is approximately 15 times their weight in the Canadian female population (5%).
Specifically, First Nations women and girls, who made up 3% of the Canadian female population in 2016, represented 54% of the female population living in very remote areas (Chart 1).Note Furthermore, Inuit women and girls, who made up 0.2% of the Canadian female population overall, represented 14% of the female population living in very remote areas. Finally, Métis women and girls represented twice their proportion in the Canadian female population (2%) in these areas (4%).
| Level of remoteness | TotalTable 1 Note 1 - Non-Indigenous and Indigenous women and girls | Non-Indigenous women and girls | First Nations women and girls (single identity) | Métis women and girls (single identity) | Inuit women and girls (single identity) | |||||
|---|---|---|---|---|---|---|---|---|---|---|
| number | percent | number | percent | number | percent | number | percent | number | percent | |
| Canada | 17,488,485 | 100.0 | 16,628,220 | 100.0 | 505,725 | 100.0 | 298,115 | 100.0 | 32,995 | 100.0 |
| Easily accessible areas | 11,985,985 | 68.5 | 11,707,540 | 70.4 | 147,760 | 29.2 | 116,740 | 39.2 | 3,600 | 10.9 |
| Accessible areas | 3,352,080 | 19.2 | 3,130,210 | 18.8 | 120,195 | 23.8 | 93,400 | 31.3 | 2,085 | 6.3 |
| Less accessible areas | 1,354,690 | 7.7 | 1,225,055 | 7.4 | 77,335 | 15.3 | 47,890 | 16.1 | 1,025 | 3.1 |
| Remote areas | 663,630 | 3.8 | 529,135 | 3.2 | 89,275 | 17.7 | 34,460 | 11.6 | 7,770 | 23.5 |
| Very remote areas | 132,100 | 0.8 | 36,280 | 0.2 | 71,160 | 14.1 | 5,625 | 1.9 | 18,515 | 56.1 |
|
||||||||||
Data table for Chart 1
| Level of remoteness | Non-Indigenous | First Nations (single identity) | Métis (single identity) | Inuit (single identity) |
|---|---|---|---|---|
| percent | ||||
| Very remote areas | 27.5 | 53.9 | 4.3 | 14.0 |
| Remote areas | 79.7 | 13.5 | 5.2 | 1.2 |
| Less accessible areas | 90.4 | 5.7 | 3.5 | 0.1 |
| Accessible areas | 93.4 | 3.6 | 2.8 | 0.1 |
| Easily accessible areas | 97.7 | 1.2 | 1.0 | 0.0 |
| Canada | 95.1 | 2.9 | 1.7 | 0.2 |
| Source: Statistics Canada, 2016 Census of Population and remoteness index classification. | ||||
In very remote areas, about half of Inuit women and girls are aged 23 or younger
The Indigenous population is typically younger than the non-Indigenous population—the Inuit population is the youngest, followed by First Nations, then Métis.Note In 2016, Indigenous people were, on average, nine years younger than the non-Indigenous population.Note
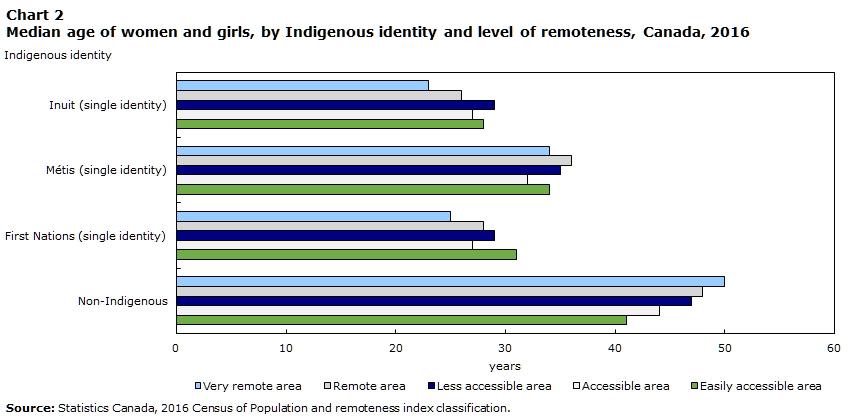
Overall, First Nations and Inuit women and girls living in remote and very remote areas were significantly younger than those living in more accessible areas, while non-Indigenous women and girls were typically older. The age gap between Indigenous and non-Indigenous women and girls living in more remote areas was greater than that observed for the overall population.
Specifically, in 2016, the median age among Inuit (23 years) and First Nations (25 years) women and girls living in very remote areas was less than half that of their non-Indigenous counterparts in very remote areas (50 years) (Chart 2).Note In comparison, the median ages of First Nations and non-Indigenous women and girls were, respectively, 31 years and 41 years in easily accessible areas.
The age gap between non-Indigenous and Métis women and girls also increases with increased remoteness. However, this increase is more because of the increase in the age of the non-Indigenous women and girls, as Métis living in remote and very remote areas tended to be the same age as or older than their counterparts living in more accessible areas.
Data table for Chart 2
| Indigenous identity | Easily accessible area | Accessible area | Less accessible area | Remote area | Very remote area |
|---|---|---|---|---|---|
| years | |||||
| Non-Indigenous | 41 | 44 | 47 | 48 | 50 |
| First Nations (single identity) | 31 | 27 | 29 | 28 | 25 |
| Métis (single identity) | 34 | 32 | 35 | 36 | 34 |
| Inuit (single identity) | 28 | 27 | 29 | 26 | 23 |
| Source: Statistics Canada, 2016 Census of Population and remoteness index classification. | |||||
Multigenerational households are more prevalent in very remote areas
Multigenerational households, where there is at least one person living with a child and a grandchild, are more prevalent among Indigenous families. Multigenerational households play an important role in raising children and passing on traditional knowledge and culture. Elders and grandparents have always been held in high regard as advisors and keepers of cultural knowledge.Note In addition, living in a multigenerational household may be a family’s solution to affordability or housing shortages within their community.
For First Nations, Métis and Inuit women and girls, multigenerational households were more common in very remote areas than in easily accessible areas, in particular among First Nations and Inuit women and girls (Chart 3). For example, roughly one-third (29%) of First Nations women and girls were living in multigenerational households in very remote areas, compared with 9% of their counterparts living in easily accessible areas.Note For non-Indigenous women and girls, the opposite trend is observed, that is, they were more likely to live in multigenerational households in easily accessible areas than in more remote areas.

Data table for Chart 3
| Indigenous identity | Easily accessible area | Accessible area | Less accessible area | Remote area | Very remote area |
|---|---|---|---|---|---|
| percent | |||||
| First Nations (single identity) | 9.0 | 12.7 | 12.0 | 17.2 | 29.2 |
| Métis (single identity) | 6.4 | 6.2 | 5.1 | 6.1 | 13.2 |
| Inuit (single identity) | 6.9 | 4.8 | 7.3 | 14.5 | 25.6 |
| Non-Indigenous | 7.7 | 3.9 | 3.4 | 3.1 | 3.0 |
| Source: Statistics Canada, 2016 Census of Population and remoteness index classification. | |||||
First Nations and Inuit women and girls in remote areas are more likely to reside in dwellings in need of major repairs and crowded dwellings
The poor state of housing and crowding on reserve and in many Inuit communities are well documented.Note However, less is known about this for Indigenous people living in other areas, particularly for women and girls.
Overall, Indigenous women and girls living in remote and very remote areas were more likely to reside in a dwelling in need of major repairs (Chart 4).Note This was particularly true for First Nations women and girls, almost half (47%) of whom resided in dwellings in need of major repairs in very remote areas, compared with 13% in easily accessible areas.Note Across all levels of remoteness, First Nations women and girls living on reserve were more likely to live in a dwelling in need of major repairs than their counterparts living off reserve. However, this difference was most pronounced in accessible areas, where 45% of those living on reserves lived in such dwellings, compared with 12% of those living off reserve.
The proportion of Inuit (31%) and Métis (19%) women and girls living in dwellings in need of major repairs was also significantly higher among those living in very remote areas. Furthermore, in remote and very remote areas, Inuit women and girls living in Inuit Nunangat (30% in remote areas and 31% in very remote areas) were significantly more likely to reside in a dwelling in need of major repairs than Inuit women and girls outside Inuit Nunangat (13% in remote areas and 18% in very remote areas).

Data table for Chart 4
| Indigenous identity | Easily accessible area | Accessible area | Less accessible area | Remote area | Very remote area |
|---|---|---|---|---|---|
| percent | |||||
| First Nations (single identity) | 13.1 | 19.4 | 21.9 | 30.0 | 46.8 |
| Métis (single identity) | 10.7 | 10.3 | 12.5 | 14.6 | 18.6 |
| Inuit (single identity) | 13.6 | 9.4 | 13.2 | 24.7 | 31.0 |
| Non-Indigenous | 5.8 | 6.0 | 7.7 | 8.6 | 10.9 |
| Source: Statistics Canada, 2016 Census of Population and remoteness index classification. | |||||
Indigenous women and girls living in very remote areas were also more likely to reside in a crowded dwelling, which is housing that was considered not suitable for the number of people who lived there,Note than those living in more accessible areas. This difference was most pronounced for First NationsNote ,Note and Inuit women and girls. For example, Inuit women and girls living in very remote areas were almost four times more likely to reside in crowded dwellings (53%) than those living in easily accessible areas (14%).
First Nations, Métis and Inuit women and girls are more likely to speak an Indigenous language in very remote areas
Indigenous languages are recognized as fundamental to the identities and cultures of Indigenous people. The year 2022 marked the beginning of the UNESCO Decade of Indigenous languages, which was proclaimed to support the preservation, revitalization and promotion of Indigenous languages.
In 2016, roughly one in six Indigenous adults in Canada (16%) were able to speak an Indigenous language well enough to conduct a conversation. A similar proportion of men (15%) and women (16%) reported being able to speak an Indigenous language.Note Inuit had the highest proportion of adults who could speak an Indigenous language (64%), followed by First Nations (21%) and then Métis (2%).Note
First Nations, Métis and Inuit women and girls living in very remote areas were more likely to speak an Indigenous language well enough to conduct a conversation when compared with other levels of remoteness (Chart 5).
For Inuit women and girls, those in remote (60%) and very remote (83%) areas were up to 10 times more likely to speak an Indigenous language than those living in less accessible (10%) and accessible areas (8%). This trend is partly related to the high proportion of Inuit Indigenous language speakers who live in Inuit Nunangat,Note where all areas were classified as remote or very remote. Among Inuit women and girls, those living in remote (82%) and very remote (85%) areas in Inuit Nunangat were more likely to speak an Indigenous language when compared with those living outside Inuit Nunangat (9% in remote areas and 16% in very remote areas).
Additionally, over half (57%) of First Nations women and girls in very remote areas could speak an Indigenous language, compared with 7% of their counterparts in easily accessible areas.Note Across all levels of remoteness, First Nations women and girls living on reserve were more likely to speak an Indigenous language than those living off reserve. This difference was most pronounced in remote areas, where First Nations women and girls living on reserve were three times more likely to speak an Indigenous language than those living off reserve (48% and 16%, respectively).
For Métis women and girls, the ability to speak an Indigenous language also rose as the level of remoteness increased, ranging from less than 1% in easily accessible areas to 15% in very remote areas.

Data table for Chart 5
| Indigenous identity | Easily accessible area | Accessible area | Less accessible area | Remote area | Very remote area |
|---|---|---|---|---|---|
| percent | |||||
| First Nations (single identity) | 7.2 | 12.4 | 16.7 | 32.4 | 57.2 |
| Métis (single identity) | 0.7 | 0.9 | 1.6 | 4.8 | 15.3 |
| Inuit (single identity) | 22.1 | 7.7 | 10.2 | 59.7 | 83.3 |
| Source: Statistics Canada, 2016 Census of Population and remoteness index classification. | |||||
Completion of high school or a higher level of education is lower in more remote areas
Educational attainment among Indigenous women has been increasing over time. In 2016, 14% of Indigenous women had obtained a bachelor’s degree or higher, which was up from 9% in 2006. While educational attainment has improved for Indigenous women, the proportion of Indigenous women with a bachelor’s degree or higher continues to be lower when compared with non-Indigenous women. Lower levels of educational attainment among Indigenous women may be because of barriers such as having to relocate to access education, lacking financial resources, or having personal or family responsibilities.Note
The data show that educational attainment declines with increasing remoteness across all Indigenous groups. However, more significant declines were observed among First Nations and Inuit women.
In 2016, almost four-fifths (78%) of First Nations women had completed high school or a higher level of education in easily accessible areas, compared with less than one-half (47%) of First Nations women in very remote areas (Chart 6).Note First Nations women living on reserve were generally less likely to have completed high school or a higher level of education than those living off reserve, except in easily accessible areas, where completion was equally likely among First Nations women living on and off reserve (78% for both groups).
Similar results are found for Inuit women. In 2016, about 4 in 10 Inuit women living in very remote areas had completed high school or a higher level of education (41%), compared with more than 7 in 10 of those living in easily accessible areas (72%). Inuit women living in very remote areas in Inuit Nunangat were less likely to have completed high school or a higher level of education (40%) than those living in very remote areas outside Inuit Nunangat (65%). The lower levels of high school completion seen for Inuit are likely influenced by a number of factors, such as the impact of residential school attendance on many generations of Inuit, insufficient numbers of Inuit teachers and culturally irrelevant curriculum, as well as children often having to learn in a second language.Note
In contrast, although completion of high school or a higher level of education was typically lower in more remote areas, completion rates among Métis and non-Indigenous women living in very remote areas remained relatively high (69% and 75%, respectively).
Similar trends were observed regarding completion of a university degree. First Nations, Métis and Inuit women were less likely to have a university certificate, diploma or degree at the bachelor’s level or above with increasing remoteness.Note For example, 3% of Inuit women in very remote areas had completed a bachelor’s degree, compared with 11% in easily accessible and 19% in accessible areas.
Differences in educational attainment by level of remoteness may be influenced by several factors, such as limited availability of or access to schools, colleges and universities; and limited or unreliable Internet access in more remote areas.Note

Data table for Chart 6
| Indigenous identity | Easily accessible area | Accessible area | Less accessible area | Remote area | Very remote area |
|---|---|---|---|---|---|
| percent | |||||
| First Nations (single identity) | 77.8 | 74.1 | 71.5 | 62.2 | 46.7 |
| Métis (single identity) | 82.8 | 83.2 | 79.6 | 75.9 | 68.6 |
| Inuit (single identity) | 72.1 | 79.6 | 71.0 | 61.8 | 41.1 |
| Non-Indigenous | 86.4 | 86.4 | 82.5 | 78.8 | 74.5 |
| Source: Statistics Canada, 2016 Census of Population and remoteness index classification. | |||||
Unemployment rates increase with the level of remoteness
Limited access to employment in many sectors in remote communities may have a significant impact on labour force participation. This is reflected in all major labour market indicators for Indigenous women.
For both First Nations and Métis women aged 15 years and older, labour force participation rates decrease with increasing level of remoteness.Note However, among Inuit women, labour force participation rates were highest in remote (66%) and very remote (61%) areas, and were lowest in less accessible areas (56%).
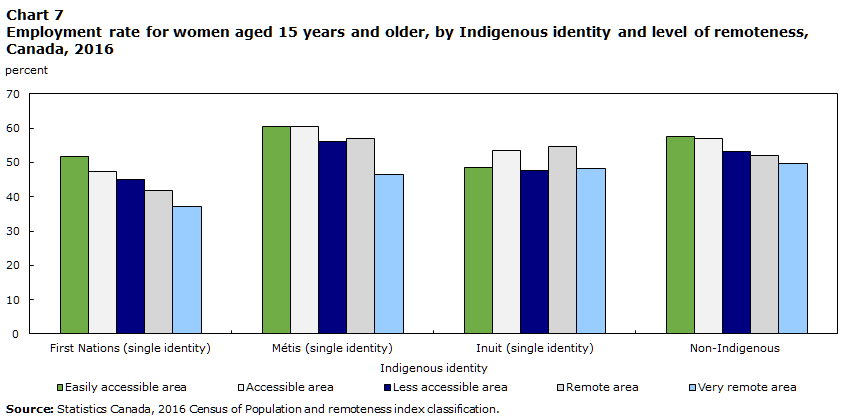
Employment rates varied similarly to labour force participation rates by level of remoteness (Chart 7). For First Nations, Métis and non-Indigenous women, employment rates were highest among those living in easily accessible and accessible areas. This was particularly true for First Nations women, whose employment rate dropped from 52% in easily accessible areas to 37% in very remote areas.Note In addition, the employment rates of First Nations women living on reserve were lower than those of First Nations women living off reserve across all levels of remoteness.
In contrast, employment rates for Inuit women showed no particular pattern by level of remoteness. They ranged from 48% to 55% and were higher for Inuit women living in Inuit Nunangat.
Data table for Chart 7
| Indigenous identity | Easily accessible area | Accessible area | Less accessible area | Remote area | Very remote area |
|---|---|---|---|---|---|
| percent | |||||
| First Nations (single identity) | 51.8 | 47.4 | 44.9 | 41.9 | 37.1 |
| Métis (single identity) | 60.4 | 60.5 | 56.0 | 56.9 | 46.5 |
| Inuit (single identity) | 48.5 | 53.5 | 47.7 | 54.6 | 48.1 |
| Non-Indigenous | 57.6 | 57.0 | 53.1 | 52.1 | 49.6 |
| Source: Statistics Canada, 2016 Census of Population and remoteness index classification. | |||||
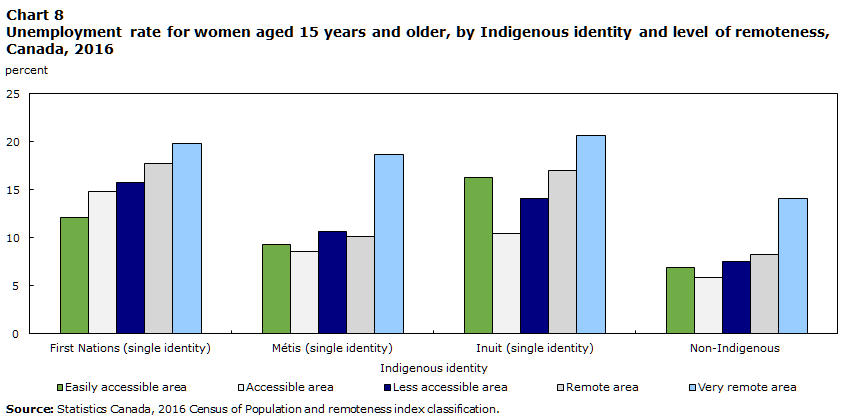
Finally, data show that unemployment rates for First Nations, Inuit and Métis women increase with increasing levels of remoteness (Chart 8).Note For all groups, the unemployment rate was highest in the most remote areas. This is particularly striking for Métis women living in very remote areas, for whom the unemployment rate (19%) was more than twice that of their counterparts living in easily accessible areas (9%).
Data table for Chart 8
| Indigenous identity | Easily accessible area | Accessible area | Less accessible area | Remote area | Very remote area |
|---|---|---|---|---|---|
| percent | |||||
| First Nations (single identity) | 12.1 | 14.8 | 15.8 | 17.8 | 19.8 |
| Métis (single identity) | 9.3 | 8.6 | 10.7 | 10.1 | 18.7 |
| Inuit (single identity) | 16.3 | 10.5 | 14.1 | 17.0 | 20.7 |
| Non-Indigenous | 6.9 | 5.9 | 7.5 | 8.3 | 14.1 |
| Source: Statistics Canada, 2016 Census of Population and remoteness index classification. | |||||
Indigenous women report lower employment incomes in remote and very remote areas
Limited access to employment in remote communities and its impact on the labour market in these areas are reflected in employment incomes reported by Indigenous women in 2015.
In general, the employment incomes of both Indigenous and non-Indigenous women tended to decrease as the level of remoteness increases. This was particularly true for First NationsNote and Inuit women, for whom the median employment income in very remote areas ($18,400 and $14,500, respectively) was 23% and 35% lower, respectively, than that of their counterparts living in easily accessible areas ($23,800 and $22,200, respectively) (Chart 9).Note
However, the median employment income of Inuit women was highest in remote areas ($31,400). In these areas, Inuit women living in Inuit Nunangat had a higher median income than those living outside Inuit Nunangat ($34,000 versus $28,200). Nevertheless, it is important to keep in mind that, although Inuit women living in remote areas of Inuit Nunangat had the highest employment incomes, the cost of living in this region is particularly high, and many Inuit reported struggling to afford necessities such as healthy food, supplies for hunting and fishing, and clothing.Note

Data table for Chart 9
| Indigenous identity | Easily accessible area | Accessible area | Less accessible area | Remote area | Very remote area |
|---|---|---|---|---|---|
| dollars | |||||
| First Nations (single identity) | 23,800 | 21,400 | 20,200 | 19,800 | 18,400 |
| Métis (single identity) | 28,000 | 25,400 | 24,000 | 23,000 | 23,200 |
| Inuit (single identity) | 22,200 | 22,600 | 21,200 | 31,400 | 14,500 |
| Non-Indigenous | 29,800 | 27,800 | 25,400 | 24,000 | 22,800 |
| Source: Statistics Canada, 2016 Census of Population and remoteness index classification. | |||||
Conclusion
Although Indigenous people living in remote communities often benefit from a closer connection to their communities, cultures, traditions, languages, lands and resources, they also face unique barriers and challenges. Within these communities, the situation of Indigenous women and girls is often even less favourable, making it necessary to focus on this particular group.
There are significant socioeconomic and demographic differences between First Nations, Métis and Inuit women and girls by level of remoteness, as well as differences between First Nations women and girls living on and off reserve, and Inuit living in and outside Inuit Nunangat.
The study showed that the share of women and girls living in remote areas was highest for Inuit, followed by First Nations and Métis. In 2016, more than three-quarters of Inuit women and girls lived in remote and very remote areas, while nearly one-third of First Nations women and girls lived in such areas. Métis women and girls were more likely to live in more accessible areas, with 7 in 10 women and girls reporting living in accessible or easily accessible areas.
Indigenous languages are a fundamental component of the identities and cultures of Indigenous peoples. Similarly, closer connection to Indigenous culture can foster the transmission of Indigenous languages. For First Nations, Métis and Inuit women and girls, the ability to speak an Indigenous language was higher in more remote areas. The highest share speaking an Indigenous language was found among Inuit women living in remote and very remote areas; those living in very remote areas were approximately 10 times more likely to speak an Indigenous language than those living in accessible areas.
First Nations, Métis and Inuit women and girls living in remote and very remote areas were also more likely to live in multigenerational households and to reside in a crowded dwelling or a dwelling in need of major repairs, particularly First Nations and Inuit women. In addition, rates of completing high school or a higher level of education declined for all Indigenous groups with increasing remoteness, in particular among First Nations and Inuit women.
Similarly, Indigenous women’s employment and income varied with the degree of remoteness. For First Nations and Métis women, labour force participation, employment rate, and median employment income generally decreased with increased remoteness. In contrast, for Inuit women, labour force participation, employment rate and median employment income were highest among those living in remote areas.
This study highlighted differences in the characteristics of Indigenous women and girls living in remote communities when compared with their counterparts living in more accessible areas. However, these differences varied by Indigenous group and reflected the diversity of experiences of women and girls living in remote areas, as well as the obstacles they face. These obstacles can include limited access to services such as health care and education, as well as to housing and employment. Findings in this study thus highlight the importance of examining the socioeconomic characteristics of Indigenous women and girls by level of remoteness using a distinctions-based approach. They can also help inform the development of infrastructure and programs designed to reduce inequities and remove barriers.
Amanda Bleakney and Alexandria Melvin are analysts at the Centre for Indigenous statistics and partnerships at Statistics Canada.
Start of text box
Data sources, definitions and methods
Data sources
The 2016 Census of Population and Statistics Canada’s remoteness index classification were used to examine the extent to which the socioeconomic characteristics of First Nations, Métis and Inuit women and girls differ by level of remoteness.
Census of Population
This study used data from the 2016 Census of Population long-form questionnaire. Statistics Canada conducts the Census of Population every five years and collects data on demographic and economic characteristics of people and households. The Census of Population is the primary source of sociodemographic data for specific population groups (e.g., Indigenous peoples, immigrants, seniors) as well as for lower levels of geography. A sample of 25% of Canadian households received the long-form questionnaire, and all reserves and Inuit communities were enumerated using the long-form questionnaire. All other households received a short-form questionnaire. The long-form questionnaire was administered to those in private dwellings only, thus excluding those in collective dwellings such as hospitals, nursing homes and jails.
Remoteness index
Statistics Canada’s remoteness index (RI) was used to quantify the extent to which a census subdivision (CSD) is remote, or far from neighbouring population centres. To develop the RI, researchers used data from official statistical sources, including census data, in addition to data from non-official statistical sources, such as Google Maps API. For each CSD, the RI value was determined based on the CSD’s relative proximity to all surrounding population centres within a radius that permits daily accessibility (measured in travel cost), as well as the size of those population centres (measured in population size).
The RI is a continuous index variable that provides a value for each CSD, ranging from 0 to 1, with 1 indicating the highest level of remoteness. The RI values were categorized using classification thresholds, classifying RI values into five categories of remoteness: easily accessible areas, accessible areas, less accessible areas, remote areas and very remote areas (see Table 2).
For example, the Census Subdivision (CSD) Coquitlam 1, a First Nations reserve under the administration of Kwikwetlem First Nation, is located in the greater Vancouver area in British Columbia and was classified as an easily accessible area. In contrast, CSD of Taloyaok (or Talurjuaq), an Inuit community, was classified as a very remote area. It is located in Nunavut and is the northernmost community on the Canadian mainland.
| Level of remoteness | Remoteness index score |
|---|---|
| Easily accessible area | <0.1500 |
| Accessible area | 0.1500 to 0.2888 |
| Less accessible area | 0.2889 to 0.3898 |
| Remote area | 0.3899 to 0.5532 |
| Very remote area | >0.5532 |
| Source: Statistics Canada, remoteness index from Alasia et al. (2017) and remoteness classification from Subedi et al. (2020). | |
Analytical strategy
A distinctions-based analytical approach was taken, where First Nations, Métis and Inuit results were analyzed and reported separately.Note
Descriptive statistics were calculated describing the characteristics of First Nations, Métis and Inuit women and girls (younger than 15 years) living in varying levels of remoteness. Descriptive statistics were also calculated specifically for First Nations women and girls with and without registered or treaty Indian status, First Nations women and girls living on and off reserve, and Inuit women and girls living in and outside Inuit Nunangat. Characteristics examined included completion of high school or a higher level of education (restricted to those aged 18 years and older), highest level of education attained (restricted to those aged 25 years and older), labour force status, median employment income, housing conditions, knowledge of Indigenous languages, and multigenerational status of household
End of text box
- Date modified: