
Canada at a Glance, 2022
Economy

Archived Content
Information identified as archived is provided for reference, research or recordkeeping purposes. It is not subject to the Government of Canada Web Standards and has not been altered or updated since it was archived. Please "contact us" to request a format other than those available.
Gross domestic product… in brief
Gross domestic product (GDP) is a broad measure of a country’s economic activity based on the total cash value of all goods and services produced over a specific period of time.
Tracked over multiple years, GDP can show whether a country’s economy is rising or falling. Rising GDP is a sign of good economic health; falling GDP indicates that the country’s economy is not working at full capacity or may be in a recession.Note
Watch our video to learn more on GDP.
| 2019 | 2020 | 2021 | |
|---|---|---|---|
| millions of 2012 chained dollars | |||
| All industries | 1,986,183 | 1,884,083 | 1,977,193 |
| Agriculture, forestry, fishing and hunting | 41,246 | 42,619 | 39,847 |
| Mining, quarrying, and oil and gas extraction | 154,259 | 142,560 | 151,734 |
| Utilities | 43,191 | 42,148 | 41,560 |
| Construction | 143,672 | 140,588 | 148,795 |
| Manufacturing | 198,175 | 178,981 | 186,947 |
| Wholesale trade | 103,232 | 100,685 | 105,979 |
| Retail trade | 100,074 | 96,759 | 103,879 |
| Transportation and warehousing | 88,937 | 71,620 | 72,869 |
| Information and cultural industries | 67,604 | 66,214 | 68,708 |
| Finance and insurance | 137,115 | 143,404 | 149,208 |
| Real estate and rental and leasing | 253,457 | 257,129 | 266,171 |
| Professional, scientific and technical services | 122,362 | 119,080 | 127,345 |
| Management of companies and enterprises | 5,331 | 3,778 | 2,775 |
| Administrative and support, waste management and remediation services | 52,364 | 45,689 | 47,443 |
| Educational services | 105,027 | 98,782 | 105,222 |
| Health care and social assistance | 138,956 | 132,660 | 143,652 |
| Arts, entertainment and recreation | 15,703 | 9,260 | 9,665 |
| Accommodation and food services | 43,784 | 29,122 | 33,477 |
| Other services | 38,932 | 32,911 | 35,652 |
| Public administration | 133,486 | 131,613 | 137,485 |
|
Note: North American Industry Classification System (NAICS) Source: Statistics Canada, table 36-10-0434-01. |
|||
Did you know?
- Canada’s gross domestic product (GDP) dropped from just over $1,986 billion in 2019 to a little over $1,884 billion in 2020. In 2021, we saw an increase in GDP to just over $1,977 billion, which is still lower than the level recorded in 2019.
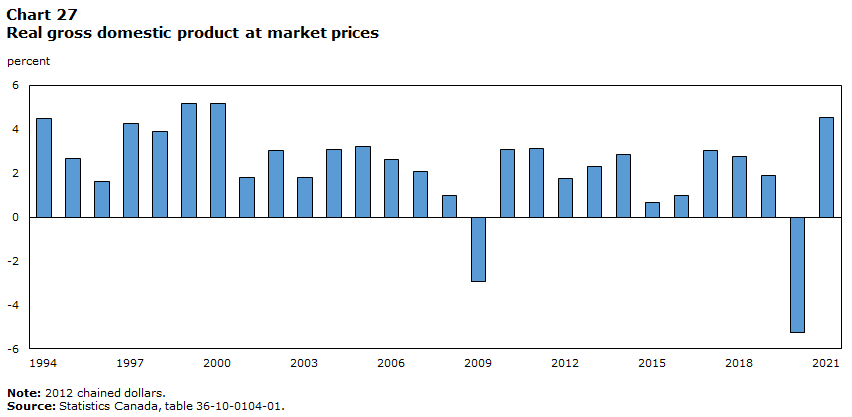
Data table for Chart 27
| Annual change | |
|---|---|
| percent | |
| 1994 | 4.5 |
| 1995 | 2.7 |
| 1996 | 1.6 |
| 1997 | 4.3 |
| 1998 | 3.9 |
| 1999 | 5.2 |
| 2000 | 5.2 |
| 2001 | 1.8 |
| 2002 | 3.0 |
| 2003 | 1.8 |
| 2004 | 3.1 |
| 2005 | 3.2 |
| 2006 | 2.6 |
| 2007 | 2.1 |
| 2008 | 1.0 |
| 2009 | -2.9 |
| 2010 | 3.1 |
| 2011 | 3.1 |
| 2012 | 1.8 |
| 2013 | 2.3 |
| 2014 | 2.9 |
| 2015 | 0.7 |
| 2016 | 1.0 |
| 2017 | 3.0 |
| 2018 | 2.8 |
| 2019 | 1.9 |
| 2020 | -5.2 |
| 2021 | 4.5 |
|
Note: 2012 chained dollars. Source: Statistics Canada, table 36-10-0104-01. |
|
| North American Industry Classification System (NAICS) | 2019 | 2020 | 2021 |
|---|---|---|---|
| millions of dollars | |||
| Retail Trade | 616,544 | 608,330 | 680,101 |
| Motor vehicle and parts dealers | 168,004 | 154,651 | 183,981 |
| New car dealers | 134,347 | 119,878 | 142,764 |
| Used car dealers | 12,611 | 12,026 | 15,340 |
| Other motor vehicle dealers | 10,598 | 11,834 | 13,561 |
| Automotive parts, accessories and tire stores | 10,448 | 10,913 | 12,315 |
| Furniture stores | 12,036 | 11,953 | 13,880 |
| Home furnishings stores | 7,034 | 6,446 | 7,643 |
| Electronics and appliance stores | 13,684 | 14,652 | 15,281 |
| Building material and garden equipment and supplies dealers | 38,066 | 42,731 | 48,362 |
| Food and beverage stores | 129,680 | 142,920 | 143,144 |
| Supermarkets and other grocery(except convenience) stores | 89,584 | 100,368 | 99,806 |
| Beer wine and liquor stores | 24,191 | 25,800 | 26,445 |
| Health and personal care stores | 48,366 | 49,136 | 52,525 |
| Gasoline stations | 63,062 | 51,187 | 63,650 |
| Clothing and clothing accessories stores | 35,228 | 25,770 | 31,062 |
| Sporting goods, hobby, book and music stores | 12,253 | 11,799 | 13,330 |
| General merchandise stores | 72,298 | 78,682 | 85,487 |
| Miscellaneous store retailers | 16,832 | 18,403 | 21,756 |
| Source: Statistics Canada. Table 20-10-0008-02. | |||
Did you know?
- Retail e-commerce sales totalled $46.4 billion in 2021.
- The increase in the share of retail e-commerce sales was larger in 2020 and 2021, with shares totalling 6.2% and 6.5%, respectively. By comparison, shares varied between 2.6% and 3.6% in the three years before the COVID-19 pandemic began.
- Sales by e-commerce and mail order businesses rose from $8.9 billion in 2016 to $28.6 billion in 2021.
To learn more
- Date modified: