
Canada at a Glance, 2022
Racialized groups

Archived Content
Information identified as archived is provided for reference, research or recordkeeping purposes. It is not subject to the Government of Canada Web Standards and has not been altered or updated since it was archived. Please "contact us" to request a format other than those available.
Did you know?
- In 2021, three racialized groups alone accounted for more than 16.1% of Canada's total population. These groups are South Asians (2.6 million; 7.1 percent), Chinese (1.7 million; 4.7 percent) and Blacks (1.5 million; 4.3 percent), each with a population of more than one million.
- In 2021, 3 in 10 racialized persons were Canadian-born. The proportion varied by racialized groups.
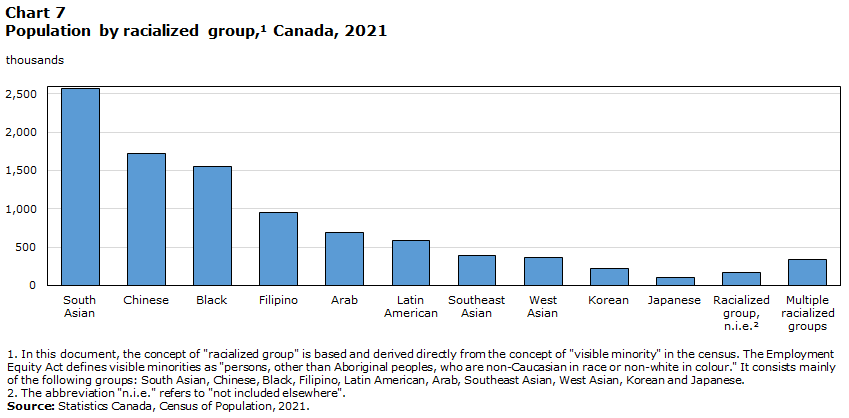
Data table for Chart 7
| Racialized groupNote 1 | 2021 |
|---|---|
| number | |
| South Asian | 2,571,400 |
| Chinese | 1,715,775 |
| Black | 1,547,870 |
| Filipino | 957,355 |
| Arab | 694,020 |
| Latin American | 580,235 |
| Southeast Asian | 390,335 |
| West Asian | 360,495 |
| Korean | 218,140 |
| Japanese | 98,890 |
| Racialized group, n.i.e.Note 2 | 172,885 |
| Multiple racialized groups | 331,805 |
|
|
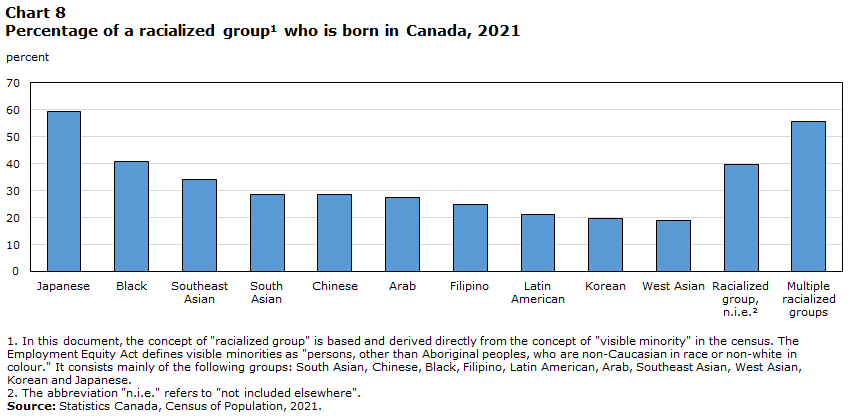
Data table for Chart 8
| Racialized groupNote 1 | 2021 |
|---|---|
| percentage | |
| Multiple racialized groups | 55.7 |
| Racialized group, n.i.e.Note 2 | 39.8 |
| West Asian | 19.1 |
| Korean | 19.8 |
| Latin American | 21.0 |
| Filipino | 24.7 |
| Arab | 27.6 |
| Chinese | 28.4 |
| South Asian | 28.7 |
| Southeast Asian | 34.0 |
| Black | 40.9 |
| Japanese | 59.2 |
|
|
To learn more
Immigration and ethnocultural diversity statistics (statcan.gc.ca)
- Date modified: