
Canada at a Glance, 2022
International trade

Archived Content
Information identified as archived is provided for reference, research or recordkeeping purposes. It is not subject to the Government of Canada Web Standards and has not been altered or updated since it was archived. Please "contact us" to request a format other than those available.
| 2021 | |||
|---|---|---|---|
| Exports ($) | Imports ($) | Balance ($) | |
| United States | 476,659,292 | 392,857,423 | 83,801,869 |
| China | 28,615,484 | 57,220,577 | -28,605,093 |
| Mexico | 8,862,729 | 19,569,291 | -10,706,562 |
| United Kingdom | 18,159,219 | 10,027,806 | 8,131,413 |
| Japan | 14,639,194 | 11,181,463 | 3,457,731 |
| Total - all countries | 636,284,375 | 631,744,105 | 4,540,270 |
| Source: Table 12-10-0011-01. | |||

Data table for Chart 28
| millions of dollars | |
|---|---|
| Total exports | 114,101,846.11 |
| Farm, fishing and intermediate food products | 3,992,450.92 |
| Energy products | 60,518,637.67 |
| Metal ores and non-metallic minerals | 4,947,591.32 |
| Metal and non-metallic mineral products | 10,153,137.78 |
| Basic and industrial chemical, plastic and rubber products | 8,913,059.24 |
| Forestry products and building and packaging materials | 13,209,190.42 |
| Industrial machinery, equipment and parts | 2,015,445.50 |
| Electronic and electrical equipment and parts | 1,271,161.82 |
| Motor vehicles and parts | -3,268,195.71 |
| Aircraft and other transportation equipment and parts | 1,597,015.31 |
| Consumer goods | 9,698,339.38 |
| Special transactions | 20,945.90 |
| Other balance-of-payments adjustments | 1,033,066.56 |
|
Note: Data are on a balance-of-payments basis. Source: Table 12-10-0121-01. |
|
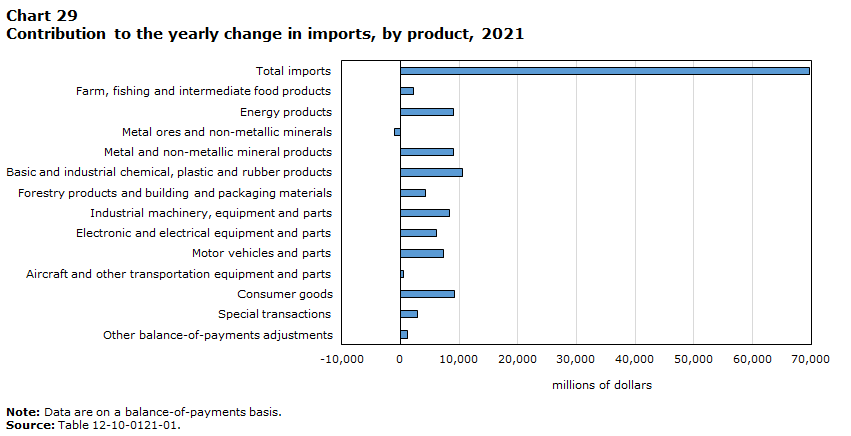
Data table for Chart 29
| millions of dollars | |
|---|---|
| Total imports | 69,736,469.72 |
| Farm, fishing and intermediate food products | 2,310,542.35 |
| Energy products | 9,047,073.28 |
| Metal ores and non-metallic minerals | -1,066,517.05 |
| Metal and non-metallic mineral products | 9,108,238.53 |
| Basic and industrial chemical, plastic and rubber products | 10,591,326.74 |
| Forestry products and building and packaging materials | 4,215,838.44 |
| Industrial machinery, equipment and parts | 8,391,223.46 |
| Electronic and electrical equipment and parts | 6,188,759.08 |
| Motor vehicles and parts | 7,260,139.44 |
| Aircraft and other transportation equipment and parts | 455,908.21 |
| Consumer goods | 9,151,963.45 |
| Special transactions | 2,952,052.47 |
| Other balance-of-payments adjustments | 1,129,921.33 |
|
Note: Data are on a balance-of-payments basis. Source: Table 12-10-0121-01. |
|

Data table for Chart 30
| Data year | Sum of value |
|---|---|
| billions of dollars | |
| 2011 | 567,443 |
| 2012 | -13,288,952 |
| 2013 | -8,145,410 |
| 2014 | 4,672,634 |
| 2015 | -24,635,733 |
| 2016 | -25,048,208 |
| 2017 | -24,499,504 |
| 2018 | -21,805,558 |
| 2019 | -18,408,844 |
| 2020 | -39,825,106 |
| 2021 | 4,540,270 |
|
Note: Data are on a balance-of-payments basis. Source: Table 12-10-0121-01. |
|
International trade in interactive format
The International Trade Explorer, 2021 (customs basis)
Did you know?
- Despite supply chain disruptions, total export and import values reached record highs in 2021.
- In 2021, Canada’s annual merchandise exports rose 22.0% from 2020, when exports fell 12.3% due to the restrictions put in place during the first waves of the pandemic.
- Imports reached a record $631 billion in 2021, up 12.2% from 2020, but 2.7% higher than in 2019.
- Thanks to strong export prices throughout the year, the merchandise trade balance posted surpluses for nine months in 2021. The annual trade surplus totalled $6.6 billion, the first annual surplus since 2014 and the largest since 2008.
To learn more
- Date modified: