
Canada at a Glance, 2022
Labour

Archived Content
Information identified as archived is provided for reference, research or recordkeeping purposes. It is not subject to the Government of Canada Web Standards and has not been altered or updated since it was archived. Please "contact us" to request a format other than those available.

Data table for Chart 25
| 2021 | |
|---|---|
| percent | |
| In the labour force | 65.1 |
| Not in the labour force | 34.9 |
| Source: Statistics Canada, table 14-10-0327-01. | |
Labour force… in brief
In Canada, the labour force is defined as the civilian non-institutional population aged 15 and older who are participating in the labour market, whether they are employed or unemployed. It excludes individuals who were not available to work or not looking for work, such as full-time students, people unable to work and retirees.
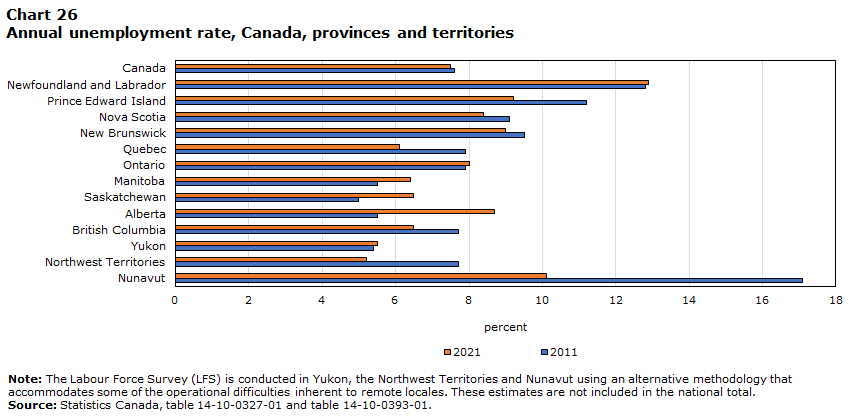
Data table for Chart 26
| 2011 | 2021 | |
|---|---|---|
| percent | ||
| Nunavut | 17.1 | 10.1 |
| Northwest Territories | 7.7 | 5.2 |
| Yukon | 5.4 | 5.5 |
| British Columbia | 7.7 | 6.5 |
| Alberta | 5.5 | 8.7 |
| Saskatchewan | 5.0 | 6.5 |
| Manitoba | 5.5 | 6.4 |
| Ontario | 7.9 | 8.0 |
| Quebec | 7.9 | 6.1 |
| New Brunswick | 9.5 | 9.0 |
| Nova Scotia | 9.1 | 8.4 |
| Prince Edward Island | 11.2 | 9.2 |
| Newfoundland and Labrador | 12.8 | 12.9 |
| Canada | 7.6 | 7.5 |
|
Note: The Labour Force Survey (LFS) is conducted in Yukon, the Northwest Territories and Nunavut using an alternative methodology that accommodates some of the operational difficulties inherent to remote locales. These estimates are not included in the national total. Source: Statistics Canada, table 14-10-0327-01 and table 14-10-0393-01. |
||
Unemployment rates… in brief
Unemployment rates and labour force participation are calculated using data from Statistics Canada’s Labour Force Survey. Thanks to the participation of the population in this survey by phone, in person and online, we can also provide various statistics on the characteristics of Canada’s labour market among population groups, such as hours worked, wages and employment.
| 2011 | 2016 | 2021 | |
|---|---|---|---|
| current dollars | |||
| Total employees, all industries | 836.08 | 938.97 | 1,098.97 |
| Goods-producing sector | 986.72 | 1,108.31 | 1,258.67 |
| Agriculture | 573.56 | 681.03 | 791.31 |
| Forestry, fishing, mining, quarrying, and oil and gas extraction | 1,370.26 | 1,594.65 | 1,849.86 |
| Utilities | 1,297.17 | 1,445.87 | 1,760.80 |
| Construction | 1,008.89 | 1,150.92 | 1,276.22 |
| Manufacturing | 907.52 | 999.38 | 1,136.90 |
| Services-producing sector | 794.92 | 894.83 | 1,058.60 |
| Wholesale and retail trade | 607.42 | 692.15 | 792.80 |
| Transportation and warehousing | 902.13 | 995.55 | 1,167.02 |
| Finance, insurance, real estate, rental and leasing | 933.54 | 1,108.79 | 1,325.01 |
| Professional, scientific and technical services | 1,095.15 | 1,257.22 | 1,413.59 |
| Business, building and other support services | 625.25 | 688.72 | 838.24 |
| Educational services | 982.83 | 1,090.64 | 1,203.14 |
| Health care and social assistance | 814.15 | 899.73 | 1,010.10 |
| Information, culture and recreation | 778.97 | 835.06 | 1,107.48 |
| Accommodation and food services | 395.54 | 429.95 | 493.32 |
| Other services (except public administration) | 706.63 | 794.16 | 944.85 |
| Public administration | 1,142.42 | 1,288.65 | 1,464.28 |
|
Note: Industry estimates in this table are based on the 2017 North American Industry Classification System (NAICS). Source: Statistics Canada, table 14-10-0064-01. |
|||
Did you know?Note
- Across all sectors, employers in Canada were actively seeking to fill about 1 million (1,001,100) vacant positions in early April 2022, up 44.4% (+308,000) from April 2021 (not seasonally adjusted).
- The job vacancy rate, which corresponds to the number of vacant positions as a proportion of total labour demand (the sum of filled and vacant positions) was 5.8% in April 2022, up from 4.4% in April 2021.
- There was an average of 1.1 unemployed people for each vacant position in April 2022, down from 2.4 a year earlier.
To learn more
- Date modified: