
Canada at a Glance, 2022
Impacts of COVID-19

Archived Content
Information identified as archived is provided for reference, research or recordkeeping purposes. It is not subject to the Government of Canada Web Standards and has not been altered or updated since it was archived. Please "contact us" to request a format other than those available.
In March 2020, Canada was hit by the COVID-19 pandemic. Overnight, the lives of the country’s entire population felt the effects: schools closed and classes moved online; many businesses had to close temporarily, putting employees out of work, while others had to quickly shift to remote working. Globally, supply chains were disrupted as households adjusted their spending.
People were isolating at home, practising physical distancing when they did go out, and learning to live differently. As a result, it affected their mental health. With each new wave of COVID, public health measures were adjusted, relaxed or tightened. Today, the lives of Canadian are increasingly similar to what they experienced pre-pandemic, but some impacts will still be felt in the long term.

Description for Figure 1
March 2020
- March 11th - COVID-19 declared a pandemic
- March 25th - Canada introduces Emergency Response Benefit (CERB)
- Cumulative employment losses in March and April total 3,000,000
April 2020
- Output is 17% below its pre-pandemic level
June 2020
- Retail sales surpass pre-COVID-19 levels
September 2020
- Second wave (Beta variant) begins
December 2020
- COVID-19 vaccinations begin
- Canada surpasses 15,000 deaths related to COVID-19
- Output recovers to within 4% of its pre-COVID-19 baseline
- Employment recovers to within 650,000 of its pre-COVID-19 level
January 2021
- Largest employment decline since initial wave
March 2021
- Value of household real estate rises nearly $600 B in Q1 2021, up almost a quarter from pre-COVID-19 levels
- March/April: Third wave (Gamma variant) begins
April 2021
- Headline consumer inflation surpasses 3%
September 2021
- Fourth wave (Delta variant) begins
- 80% of eligible Canadians are fully vaccinated
- Employment recovers to pre-pandemic levels
November 2021
- Output recovers to pre-COVID-19 baseline
December 2021
- Fifth wave (Omicron variant) begins
January 2022
- Canada surpasses 33,000 deaths related to COVID-19
- Headline inflation (5.1%) hits 30-year high
Social and demographic impacts
Did you know?
- Canada will see a change in its demographic makeup, following a higher number of deaths, a decrease in immigration and delayed family planning during the pandemic.
- In 2020, population growth (+0.4%) fell to levels not seen since the First World War, while the annual number of deaths surpassed 300,000 for the first time (+8%).
- While the pandemic slowed the movement of people around the world, immigration still contributed to Canada's population growing by 0.4% in 2020, the fastest pace of growth in the G7 for similar periods.
Population growth… in brief
Although the pandemic slowed the country’s population growth in 2020, data from the 2021 Census show that from 2016 to 2021, Canada’s population grew at almost twice the pace of other G7 countries, rising by 1.8 million from 2016 (+5.2%). Most of the growth was driven by immigration before the pandemic. Since late-2021, immigration has surpassed pre-pandemic levels.
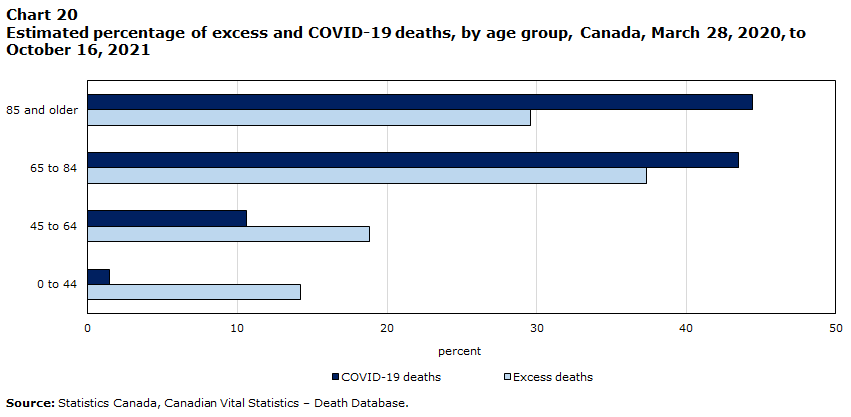
Data table for Chart 20
| Age | Excess deaths | COVID-19 deaths |
|---|---|---|
| percent | ||
| 85 and older | 29.6 | 44.4 |
| 65 to 84 | 37.3 | 43.5 |
| 45 to 64 | 18.8 | 10.6 |
| 0 to 44 | 14.2 | 1.5 |
| Source: Statistics Canada, Canadian Vital Statistics – Death Database. | ||
Did you know?
- The pandemic was the cause of more deaths than expected, but not all those deaths were caused by COVID-19. Poisonings and opioid overdoses also contributed to the excess mortality.
Moving from the big city to a small town… in brief
Some of Canada’s fastest-growing small towns outside urban centres from 2016 to 2021 were located within a two-hour drive of Toronto, Montréal or Vancouver. Between 2016 and 2021, the populations of these fastest-growing towns outside urban centres increased at about twice the pace of the entire country (+5.2%) and more than 20 times faster than rural Canada (+0.4%). The pandemic is undoubtedly a factor, given that it has had a profound effect on how we live and work. For instance, in 2021, approximately 4 in 10 jobs in Canada could be done from home.
Mental health
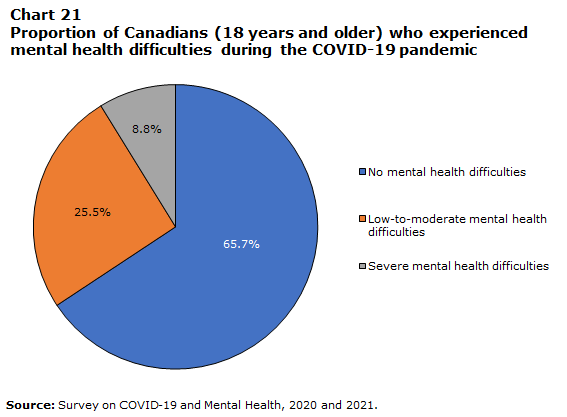
Data table for Chart 21
| Proportion | |
|---|---|
| percent | |
| No mental health difficulties | 65.7 |
| Low-to-moderate mental health difficulties | 25.5 |
| Severe mental health difficulties | 8.8 |
| Source: Survey on COVID-19 and Mental Health, 2020 and 2021. | |
Did you know?
- Individuals who were most vulnerable to negative impacts related to the COVID-19 pandemic were those who experienced severe levels of anxiety, depression, and psychological distress.
- Individuals who experienced severe levels of anxiety, depression, and psychological distress were considerably more likely to have contemplated suicide since the onset of the pandemic compared to individuals who experienced no mental health difficulties.
- Compared to individuals without minor children in Canada, parents or legal guardians of children 18 years or younger were more likely to experience emotional distress, difficulty meeting financial obligations or essential needs and challenges in relationships with members of their household.
Eh Sayers
Listen to our podcast Eh Sayers Episode 2 - Unravelling: Impacts of COVID-19 on Canadian families (statcan.gc.ca)
Ethnic or racial discrimination in numbers and images
Discrimination before and since the start of the pandemic (statcan.gc.ca)
Economic impacts

Data table for Chart 22
| Average hourly wages | Consumer price index | |
|---|---|---|
| index (January 2018=100) | ||
| 2018 | ||
| January | 100.000000 | 100.000000 |
| February | 100.336449 | 100.607441 |
| March | 100.411215 | 100.911162 |
| April | 100.635514 | 101.214882 |
| May | 100.224299 | 101.290812 |
| June | 99.887850 | 101.442673 |
| July | 99.065421 | 101.974184 |
| August | 99.252336 | 101.898254 |
| September | 100.523364 | 101.518603 |
| October | 100.710280 | 101.822323 |
| November | 100.822430 | 101.366743 |
| December | 101.308411 | 101.290812 |
| 2019 | ||
| January | 101.906542 | 101.442673 |
| February | 102.579439 | 102.126044 |
| March | 102.878505 | 102.809415 |
| April | 103.177570 | 103.264996 |
| May | 103.065421 | 103.720577 |
| June | 103.700935 | 103.492787 |
| July | 103.588785 | 104.024298 |
| August | 103.065421 | 103.872437 |
| September | 104.897196 | 103.416856 |
| October | 105.196262 | 103.720577 |
| November | 105.495327 | 103.568717 |
| December | 105.196262 | 103.568717 |
| 2020 | ||
| January | 106.392523 | 103.872437 |
| February | 106.878505 | 104.328018 |
| March | 109.420561 | 103.720577 |
| April | 114.467290 | 103.037206 |
| May | 113.794393 | 103.340926 |
| June | 111.140187 | 104.176158 |
| July | 110.093458 | 104.176158 |
| August | 109.682243 | 104.024298 |
| September | 110.616822 | 103.948368 |
| October | 110.878505 | 104.403948 |
| November | 110.654206 | 104.555809 |
| December | 110.990654 | 104.328018 |
| 2021 | ||
| January | 113.009346 | 104.935459 |
| February | 112.037383 | 105.466970 |
| March | 111.738318 | 105.998481 |
| April | 112.411215 | 106.529992 |
| May | 111.925234 | 107.061503 |
| June | 111.028037 | 107.365224 |
| July | 110.616822 | 108.048595 |
| August | 111.140187 | 108.276386 |
| September | 112.523364 | 108.504176 |
| October | 113.121495 | 109.263478 |
| November | 113.644860 | 109.491268 |
| December | 113.981308 | 109.339408 |
| 2022 | ||
| January | 115.700935 | 110.326500 |
| February | 115.476636 | 111.465452 |
| March | 115.588785 | 113.059985 |
| April | 116.112150 | 113.743356 |
| May | 116.336449 | 115.337889 |
| June | 116.785047 | 116.097191 |
| July | 116.411215 | 116.249051 |
| August | 117.121495 | 115.869400 |
|
Notes: Average hourly wages one-year percent change: August 2021 to August 2022: 5.4%. Consumer Price Index, one-year percent change: August 2021 to August 2022: 7.0%. Sources: Statistics Canada tables 14-10-0063-01 and 18-10-0004-01. |
||
Did you know?
- The population is feeling more stress on their pocketbooks as supply disruptions and strong demand continue to fuel consumer inflation.
- Consumer inflation has outpaced average wage growth since the spring of 2021, but has eased in recent months.
- According to data from the Consumer Price Index, inflation rose 7.0% year over year in August 2022, after increasing 7.6% in July.
- Sectors for which growth in offered hourly wages were on par with or below the CPI accounted for 4 out of 5 total vacancies in the second quarter of 2022.

Data table for Chart 23
| Q2 2019 | Q2 2022 | Number of job vacancies in Q2 2022 | percentage increase since Q2 2019 | |
|---|---|---|---|---|
| percent | ||||
| All industries | 3.1 | 5.9 | 1032000 | 104 |
| Accommodation and food services | 4.2 | 11.9 | 160900 | 184 |
| Health care and social assistance | 3.0 | 5.9 | 139100 | 125 |
| Retail trade | 2.3 | 5.3 | 111100 | 137 |
| Manufacturing | 3.0 | 5.3 | 87000 | 83 |
| Construction | 3.3 | 7.7 | 89800 | 171 |
| Source: Statistics Canada, Job Vacancy and Wage Survey. | ||||
Did you know?
- Total employment rebounded to pre-COVID levels, but the high number of job vacancies signals an imbalance between labour supply and demand.
- Job vacancies neared the one million mark in Q2 2022, as the job vacancy rate reached a record high of 5.7%.

Data table for Chart 24
| Fourth quarter of 2021 | |
|---|---|
| percent | |
| All industries | 33.3 |
| Accommodation and food services | 63.7 |
| Arts, entertainment and recreation | 59.0 |
| Manufacturing | 38.3 |
| Retail trade | 33.4 |
| Information and cultural industries | 33.1 |
| Transportation and warehousing | 33.0 |
| Health care and social assistance | 32.7 |
| Administrative and support, waste management and remediation services |
32.4 |
| Construction | 29.0 |
| Mining, quarrying, and oil and gas extraction | 23.9 |
| Real estate and rental and leasing | 23.6 |
| Professional, scientific and technical services | 23.3 |
| Finance and insurance | 11.6 |
| Source: Statistics Canada, table 33-10-0417-01. | |
Did you know?
- Emergency programs were a critical lifeline for many businesses during the pandemic. Business insolvencies have remained below pre-pandemic levels, but rose 37% in the fourth quarter of 2021.
- During the fourth quarter of 2021, one-third of businesses reported that the absence of government support programs over the next 12 months would have a medium-to-high impact on their survival. This includes almost two-thirds of those in accommodation and food services and 40% of businesses with 5 to 19 employees.
To learn more
- Date modified: