
Discrimination before and since the start of the pandemic

Archived Content
Information identified as archived is provided for reference, research or recordkeeping purposes. It is not subject to the Government of Canada Web Standards and has not been altered or updated since it was archived. Please "contact us" to request a format other than those available.
Description: Discrimination before and since the start of the pandemic
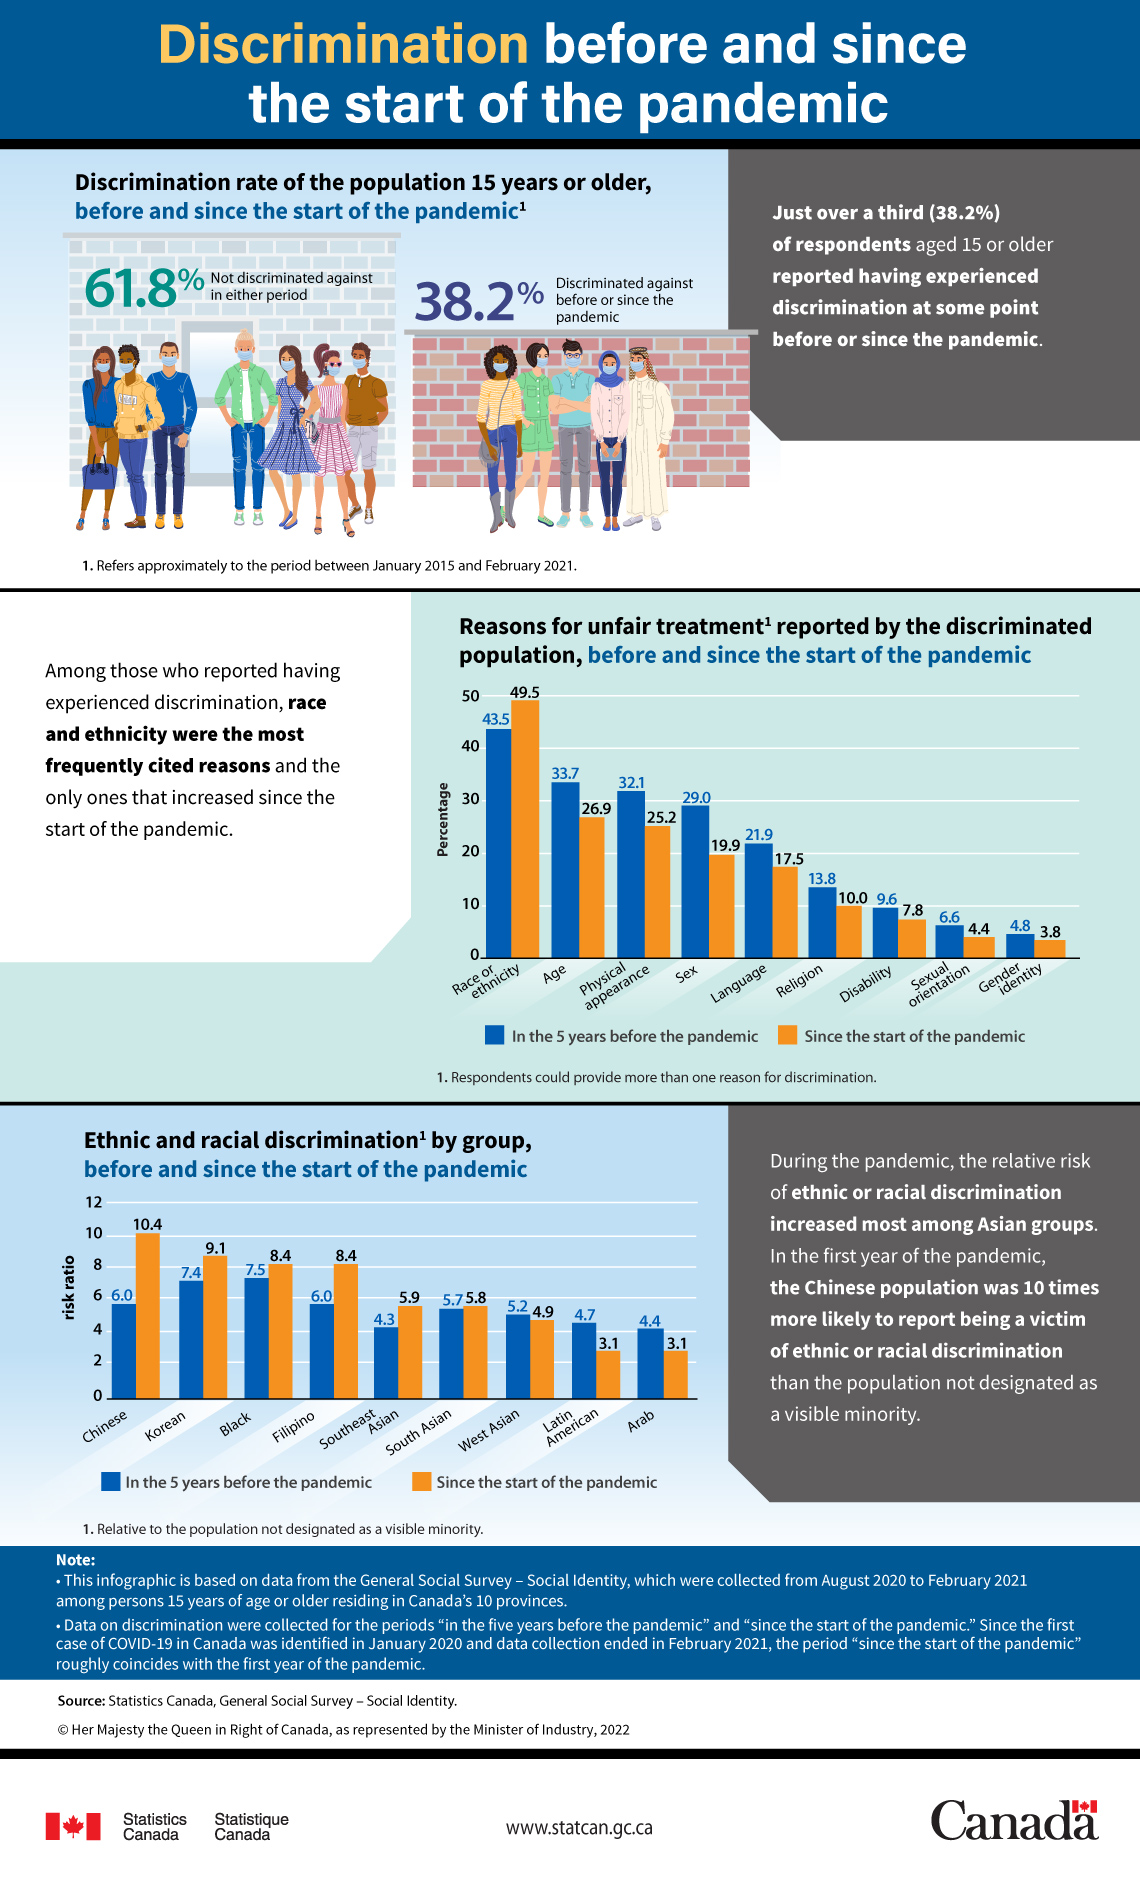
Discrimination rate for the population 15 years or older, before and since the start of the pandemicNote 1
- 61.8%: Not discriminated against in either period
- 38.2%: Discriminated against before or since the pandemic
Just over a third (38.2%) of respondents aged 15 or older reported having experienced discrimination at some point before or since the pandemic.
| In the 5 years before the pandemic | Since the start of the pandemic | |
|---|---|---|
| percentage | ||
| Race or ethnicity | 43.5 | 49.5 |
| Age | 33.7 | 26.9 |
| Physical appearance | 32.1 | 25.2 |
| Sex | 29.0 | 19.9 |
| Language | 21.9 | 17.5 |
| Religion | 13.8 | 10.0 |
| Disability | 9.6 | 7.8 |
| Sexual orientation | 6.6 | 4.4 |
| Gender identity | 4.8 | 3.8 |
Among those who reported having experienced discrimination, race and ethnicity were the most frequently cited reasons and the only ones that increased since the start of the pandemic.
| In the 5 years before the pandemic | Since the start of the pandemic | |
|---|---|---|
| risk ratio | ||
| Chinese | 6.0 | 10.4 |
| Korean | 7.4 | 9.1 |
| Black | 7.5 | 8.4 |
| Filipino | 6.0 | 8.4 |
| Southeast Asian | 4.3 | 5.9 |
| South Asian | 5.7 | 5.8 |
| West Asian | 5.2 | 4.9 |
| Latin American | 4.7 | 3.1 |
| Arab | 4.4 | 3.1 |
During the pandemic, the relative risk of ethnic or racial discrimination increased most among Asian groups. In the first year of the pandemic, the Chinese population was 10 times more likely to report being a victim of ethnic or racial discrimination than the population not designated as a visible minority.
Note:
- This infographic is based on data from the General Social Survey – Social Identity, which were collected from August 2020 to February 2021 among persons 15 years of age or older residing in Canada’s 10 provinces.
- Data on discrimination were collected for the periods “in the five years before the pandemic” and “since the start of the pandemic”. Since the first case of COVID-19 in Canada was identified in January 2020 and data collection ended in February 2021, the period “since the start of the pandemic” roughly coincides with the first year of the pandemic.
Source: Statistics Canada, General Social Survey – Social Identity.
- Date modified: