
Canada at a Glance, 2022
Prices and inflation

Archived Content
Information identified as archived is provided for reference, research or recordkeeping purposes. It is not subject to the Government of Canada Web Standards and has not been altered or updated since it was archived. Please "contact us" to request a format other than those available.
Inflation… in brief
Inflation refers to an increase in price levels over time. The most commonly cited measure of consumer inflation in Canada is the Consumer Price Index (CPI). While monthly CPI data is commonly used to measure the 12-month percentage change in prices, referred to at the highest level of aggregation as “headline” consumer inflation, the monthly CPI data can be averaged over a year to get annual average CPI data, which Statistics Canada releases annually.
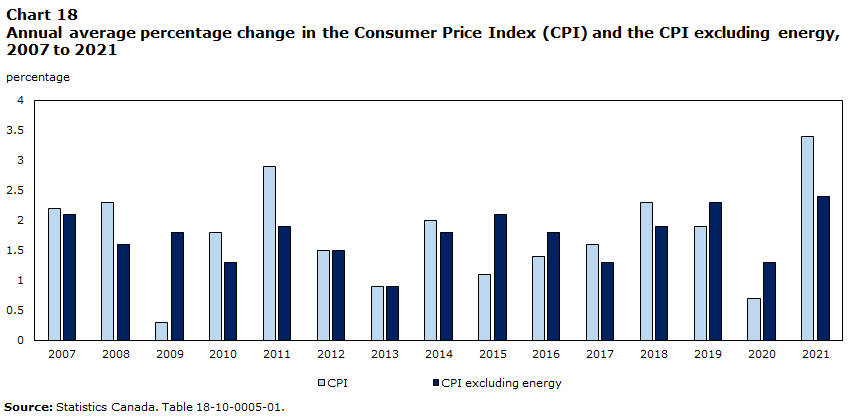
Data table for Chart 18
| CPI | CPI excluding energy | |
|---|---|---|
| percentage | ||
| 2007 | 2.2 | 2.1 |
| 2008 | 2.3 | 1.6 |
| 2009 | 0.3 | 1.8 |
| 2010 | 1.8 | 1.3 |
| 2011 | 2.9 | 1.9 |
| 2012 | 1.5 | 1.5 |
| 2013 | 0.9 | 0.9 |
| 2014 | 2.0 | 1.8 |
| 2015 | 1.1 | 2.1 |
| 2016 | 1.4 | 1.8 |
| 2017 | 1.6 | 1.3 |
| 2018 | 2.3 | 1.9 |
| 2019 | 1.9 | 2.3 |
| 2020 | 0.7 | 1.3 |
| 2021 | 3.4 | 2.4 |
| Source: Statistics Canada. Table 18-10-0005-01. | ||
Did you know?
- The Consumer Price Index (CPI) rose 3.4% on an annual average basis in 2021, the fastest pace since 1991 (+5.6%). This occurred as a result of multiple factors including global supply chain constraints and pent-up consumer demand amid reopening of the economy.
- Canadian consumers were confronted with higher prices in 2021, including for everyday necessities, such as food (+2.5%), transportation (+7.2%) and shelter (+3.9%).
- The most recent monthly data shows a 12-month increase of 7% in August 2022, following a 7.6% increase in July.
Consumer Price Index 2021, in numbers and pictures
Consumer Price Index: 2021 in review .

Data table for Chart 19
| Fuel, parts and accessories for recreational vehicles | Electricity | Natural gas | Fuel oil and other fuels | Gasoline | All-items | |
|---|---|---|---|---|---|---|
| annual average percentage change |
||||||
| 2021 | 27.8 | 2.4 | 16.1 | 24.4 | 31.2 | 3.4 |
| 2020 | -12.2 | -0.1 | 2.3 | -17.3 | -14.0 | 0.7 |
| 2019 | -3.8 | 2.1 | 4.3 | -1.6 | -6.1 | 1.9 |
| Source: Statistics Canada. Table 18-10-0005-01. | ||||||
Did you know?
- With COVID-19 restrictions beginning to loosen in 2021, gasoline prices drove the acceleration in the annual average all-items, rising 31.2% alongside higher crude oil prices and increased domestic demand.
- Prices for goods rose 4.7% in 2021 after a 0.2% decline the previous year, with prices increasing for items such as passenger vehicles (+5.1%), furniture (+7.3%) and household equipment (+3.6%).
To learn more
- Date modified: