Canadian Tourism Activity Tracker, March 2021
Archived Content
Information identified as archived is provided for reference, research or recordkeeping purposes. It is not subject to the Government of Canada Web Standards and has not been altered or updated since it was archived. Please "contact us" to request a format other than those available.
Released: 2021-05-28
Highlights
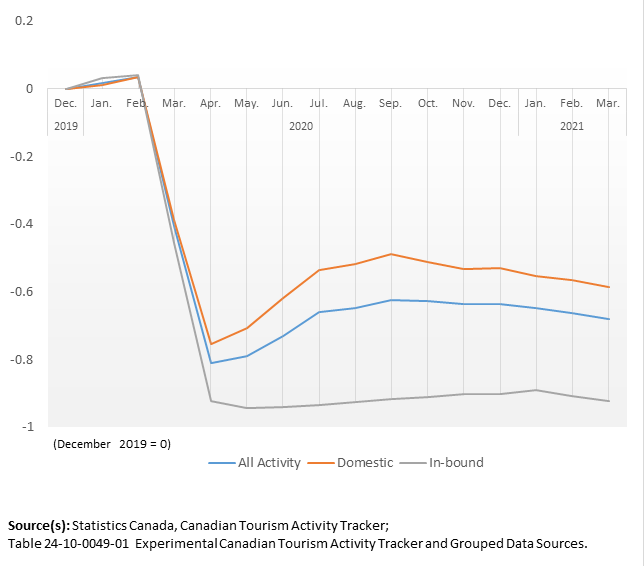
In March, overall tourism activity in Canada was 68.1% below the level reached in March of 2019, before the COVID-19 pandemic. With border closures and other restrictions, in-bound or internationally generated tourism activity was even further below (-92.3%) the pre-pandemic level.
Those provinces with lower reliance on in-bound tourism activity, such as Saskatchewan and New Brunswick, fared somewhat better in March, with tourism activity down by 55.9% and 59.2% respectively from the same month in 2019.
Assessing the impact
In late January of 2020, a Canadian resident returning to Toronto from China became Canada's first documented case of COVID-19. On March 11, the World Health Organization declared a global pandemic. There have been more than 1.35 million confirmed cases of COVID-19 in Canada and over 25,000 deaths.
With travel advisories, border closures and other restrictions to combat this global health crisis, travel and tourism was the first and hardest-hit sector. As such, counts of international arrivals to Canada, aircraft movements and food services spending were used as indicators on Canadian Economic Dashboard and COVID-19, created to assess the impacts.
Tourism is a key sector of the economy and it accounted for over 2% of gross domestic product in 2019, which serves as the pre-pandemic benchmark. That year, an estimated 32.5 million international visitors spent almost $34 billion on goods and services while travelling in Canada, while Canadians spent over $45 billion during their domestic travels.
Tracking the recovery
The Canadian Tourism Activity Tracker combines measures of travel and transport with those of food services and accommodation, among others. The level of activity was set to zero for each month in the 2019 base year. For a given month, a tracker value above zero indicates that tourism activity is greater than the 2019 reference month, while a value below zero indicates the contrary.
During 2020, overall tourism activity in Canada expanded for the first two months of the year before falling sharply by 40.7% in March and then by 81.2% in April, compared with the same months in 2019. In-bound activity fell further by over 90% in April 2020, and then experienced sharp year-over-year declines through the busy summer travel season.
At the end of 2020, overall tourism activity was down by 63.5% in December, compared with the same month in 2019. In 2021, tourism activity began to drop further as provincial restrictions and closures were enacted to combat regional outbreaks of the virus. By March of 2021, overall tourism activity in Canada was 68.1% below activity reached in March of 2019.
In March of 2021, domestic tourism activity (i.e., from the contribution of Canadians) was down 58.6% from the pre-pandemic level set in March of 2019. By comparison, in-bound tourism activity (i.e., from the contribution of international visitors) was down 92.3%.
Similarly, at the provincial level, those provinces with a heavier reliance on domestic activity, such as Saskatchewan and New Brunswick, fared somewhat better than others in March, with tourism activity down by 55.9% and 59.2% respectively, from the same month in 2019.
A new data product
The Canadian Tourism Activity Tracker was designed to help support Canadians and businesses as they navigate through the uncharted waters of this global health crisis. Note that the tracker is experimental in nature and improvements in methods or additional data sources may result in potential revisions.
In the case of geography, work is underway to expand estimates for the territories and for sub-provincial regions. In this first installment, tracker estimates are calculated independently for all geographies each month and the national estimate is therefore not a simple or weighted provincial aggregate.
Please visit our Canadian Tourism Activity Tracker tool to interact with the data.
Note to readers
The Canadian Tourism Activity Tracker is a product that combines data from numerous sources including counts of international arrivals by air and land, aircraft movements and rail passengers as well as hotel occupancy rates, food and restaurant sales and reservation bookings. This experimental product is part of an effort to shift from measuring impacts of the pandemic to assessing the recovery.
Caution is warranted when interpreting these estimates. For example, initial estimates for some of the series are input into the tracker before data are officially released. As such, tracker estimates should be viewed as preliminary and subject to revision when final estimates become available. With more data sources being considered to improve the tracker, this may entail the need for revisions.
Each data series is first standardized using a ratio method that removes seasonality and allows comparison with the same month from the 2019 base. Then weights are used to combine these standard values into a single estimate for a given month and geography. The weights are determined based on the data series correlation with overall tourism; the higher the correlation the larger the weight.
The domestic tourism value is calculated using domestic-related data, while the in-bound value uses international-related sources. The two values are combined proportionally based on pre-pandemic National Travel Survey and Visitor Travel Survey data. The March 2021 Canada all-activity estimate weighs domestic activity at 71.8% and in-bound activity at 28.2%.
Products
The product "Canadian Tourism Activity Tracker," part of the Data Visualization Products series (71-607-X), is now available.
Contact information
For more information, or to enquire about the concepts, methods or data quality of this release, contact us (toll-free 1-800-263-1136; 514-283-8300; STATCAN.infostats-infostats.STATCAN@canada.ca) or Media Relations (613-951-4636; STATCAN.mediahotline-ligneinfomedias.STATCAN@canada.ca).
- Date modified:


