
Infographic 1
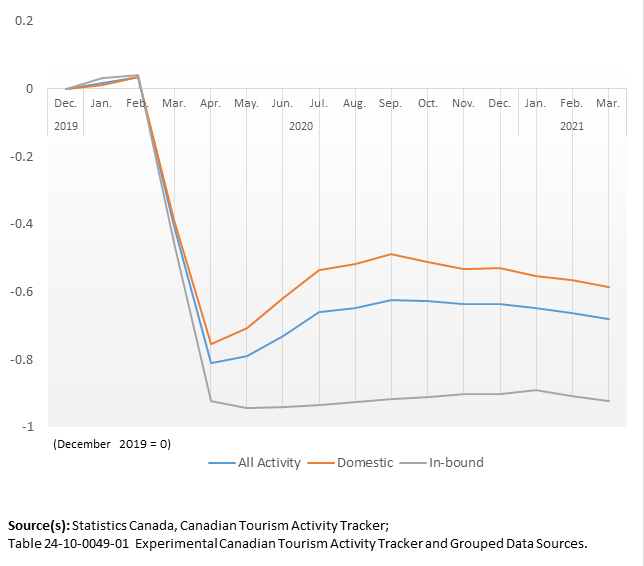
Canadian Tourism Activity Tracker, 2020 to 2021
Infographic description
The title of the infographic is "Canadian Tourism Activity Tracker, 2020 to 2021"
This is a line chart.
The vertical axis shows the average alpha values of tourism activity, from –1.0 to 0.2, by increments of 0.2.
The average alpha values are calculated as a change from the same month in the 2019 base year.
The horizontal axis shows the months from December, 2020 to March, 2021 by increments of 1 month.
There are three series in this chart.
The first series is all tourism, combining domestic and in-bound. The lowest point in this line is -0.81 in April, 2020, and the highest point in this line is 0.04 in February, 2020.
The second series is all domestic tourism activities. The lowest point in this line is -0.75 in April, 2020, and the highest point in this line is 0.03 in February, 2020.
The third series is all in-bound tourism activities. The lowest point in this line is -0.94 in March, 2020, and the highest point in this line is 0.04 in February, 2020.
Source(s): Statistics Canada, Canadian Tourism Activity Tracker, Table: 24-10-0049-01, Experimental Canadian Tourism Activity Tracker and Grouped Data Sources.
- Date modified: