Price trends in key Canadian housing markets, fourth quarter 2020
Archived Content
Information identified as archived is provided for reference, research or recordkeeping purposes. It is not subject to the Government of Canada Web Standards and has not been altered or updated since it was archived. Please "contact us" to request a format other than those available.
Released: 2021-02-08
Prices of residential properties increased 2.5% from the third to the fourth quarter, rising at their fastest pace since the second quarter of 2017.
Almost all of the growth in the fourth quarter came from single-family homes (+3.5%), which include single houses, semi-detached houses and row houses. Prices for condominium apartments inched up 0.2%. The difference in the magnitude of the price increases was primarily attributable to the shift in demand towards single-family homes, with homebuyers looking for more space to accommodate the new reality of working from home.
Property prices rose in all of the six key housing markets in the fourth quarter, led by Ottawa (+4.7%), Montréal (+4.0%) and Victoria (+3.9%).
Residential Property Price Index: The year 2020 in review
In spite of a global health crisis, the rise in residential property prices (+6.3%) accelerated in 2020, outpacing by far the 0.7% increase in 2019.
COVID-19 pandemic impact: Shift in homebuyer demand towards single-family houses in the second half of the year
During the first half of 2020, prices for condominium apartments (+6.6%) grew at a faster pace than those for the housing segment (+2.6%), as high-rise buildings were an affordable option for buyers and investors.
However, after the onset of the COVID-19 pandemic, the pattern was reversed, with the price growth for houses (+4.5%) double that for condominium apartments (+2.2%).
This reversal came about in the second half of 2020, as many Canadians worked, studied and shopped at home and spent more leisure time there, while, at the same time, downtown cores became quieter and immigration came to a halt.
Lower borrowing costs: A catalyst for housing demand
As the economy sagged at the beginning of the pandemic, the Bank of Canada slashed its policy interest rate from 1.75% in January to 0.25% in March 2020, while also indicating that the policy interest rate was likely to remain low until 2023.
Property price increases were partially mitigated by lower borrowing costs. These lower borrowing costs also expanded the number of potential real estate buyers, as well as helped buyers looking for larger homes. The latest data available show that mortgage debt increased 7.4% year over year, fuelled by housing demand.
Regional highlights: Pandemic spurs growth in housing
Ottawa: Strong demand for all property types
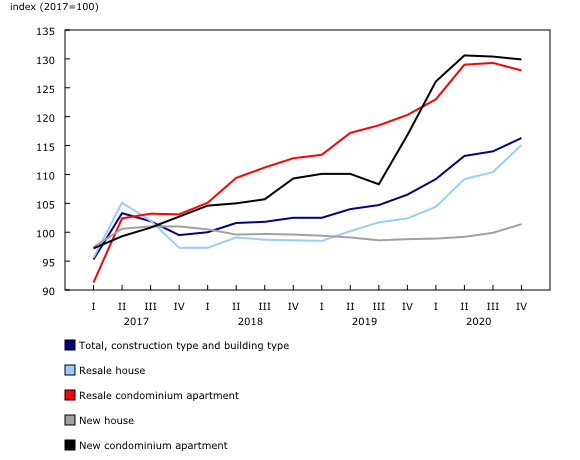
Property prices in Ottawa surged 14.8% in 2020—the fastest growth among the six key census metropolitan areas. The large presence of employees able to work from home, such as federal government and information and communications technology workers, as well as an increasing population, buoyed the housing market in the region.
Every segment of the housing market was hot, with prices for resale condominium apartments rising by 16.6% in 2020, followed closely by resale house prices (+15.8%).
Throughout the year, a tighter market put upward pressure on housing prices, as fewer newly built properties (-24.7%) were available for sale in 2020, as reported by the Canada Mortgage and Housing Corporation. At the same time, the Canadian Real Estate Association indicated that fewer existing properties were listed (-4.1%) during the year.
Montréal: Strong growth in 2020
Residential property prices in Montréal rose 10.2% in 2020.
Montréal continued to be a strong seller's market, as the sales-to-new listings ratio rose from 78.4 in 2019 to 82.5 in 2020 (a ratio above 60 identifies a seller's market).
A strong rental market also led to additional interest in condominium apartments, further pushing prices up for all housing segments. Prices rose for all property types in 2020 (ranging from 7.8% to 11.1%).
Toronto: Divergence in price growth between condominium apartments and single-family houses
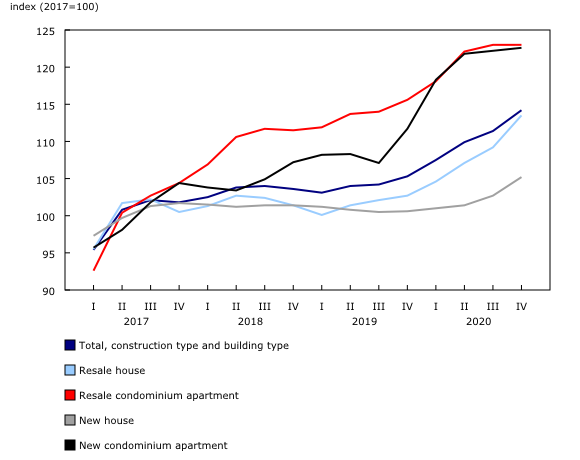
In Toronto, the pace of residential property price growth in 2020 (+8.4%) was over twice that in 2019 (+2.9%). The first half of 2020 saw condominium apartment prices go up 9.1%, while house prices rose 3.4%. Condominium apartments are an attractive option for investors who purchase them as rental units, especially in large urban centres such as Toronto.
However, demand for condominiums slowed down as the pandemic hit and people began to work from home and no longer needed housing close to their workplace. The condominium apartment market was also hit by other factors, including tougher regulations on short-term rentals, as tourism ground to a halt. Border closures also restricted the inflow of immigrants into Canada's largest immigration hub. Immigrants are predominantly renters for the first few years.
Unsurprisingly, this led to lower average prices for rental units, which were down by about one-fifth (-19.4%) year over year by December 2020.
From July 2019 to July 2020, Toronto's population grew, but 50,375 people also left the city for other regions during that time.
All these factors led to slower growth in condominium apartment prices (+1.8%) in the second half of the year, with new condominium apartment prices declining in the third (-0.2%) and fourth (-0.4%) quarters.
On the other hand, demand for space pushed single-family house prices up 4.5% in the second half of 2020.
Calgary: Housing market wanes in tandem with lower oil prices
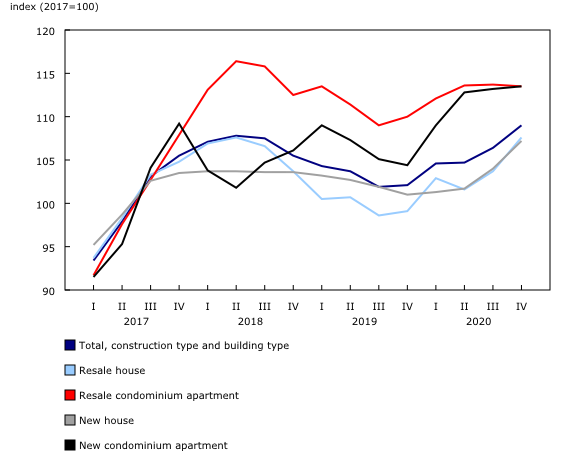
Calgary (-1.8%) posted the lone price decline among all of the key housing markets in 2020.
Calgary's resource-based economy saw oil prices crash from US$57.52 in January 2020 to US$16.55 by April of the same year. Overbuilding of housing in recent years, along with the pandemic, contributed to lower prices for all property types in the first half of 2020.
As oil prices stabilized in the second half of 2020, coupled with historically low mortgage rates, prices inched up for houses (+0.3%) and condominiums apartments (+0.2%).
Vancouver: Strong new single-family home prices
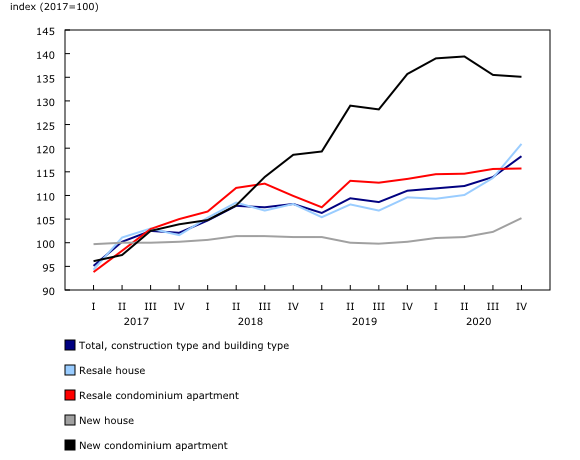
Residential property prices in Vancouver (+3.1%) bounced back in 2020 following a 3.7% decline in 2019. Vancouver, the most expensive city in Canada, saw increased demand for housing mostly due to lower borrowing costs in 2020.
Similarly to Toronto, prices for condominium apartments (+1.2%) rose at a slower pace than house prices in the second half of 2020 due to the lack of immigration and lower rental prices.
Conversely, house prices rose 3.6%, mostly on the strength of new single-family home prices (+4.0%), predominantly located outside the city core.
Victoria: Condominium apartment prices edge down in the second half of the year
Residential prices in Victoria increased 4.7% in 2020. House (+1.4%) and condominium apartment (+2.8%) prices both rose in the first half of 2020.
However, as work from home became the new normal, house prices (+5.7%) surged in the second half of 2020, while condominium apartment prices (-0.3%) sagged.
Residential property prices in 2021: Rise in housing prices continues
Residential property prices are predicted to rise in 2021, as Canada's gross domestic product is projected to increase 3.6% during the year. Consumer confidence in real estate remains strong, and the importance of a home with larger living areas (inside and outside) should persist as lockdown measures continue in many regions.
The Bank of Canada projects that interest rates will remain low until 2023. Potential homebuyers who were on the sidelines in 2020 because of the pandemic or who could not find properties listed may return in 2021. As well, the sales-to-new-listings ratio rose in all markets in 2020 (moving towards a tighter housing market), and this could further contribute to a housing price increase in 2021.
The relatively affordable cities of Montréal, Ottawa and Victoria could also see their housing prices rise faster than Toronto, Calgary and Vancouver, given their current low inventory of available homes. Single-family house price growth is projected to continue to outpace growth in condominium apartment prices.
Another important indicator to watch will be the increasing price gap between condominium apartments and single-family homes. With immigration expected to resume in the later part of 2021, demand for condominium apartments (especially larger units) may increase.
Note to readers
The Residential Property Price Index (RPPI) measures changes over time in the selling prices of residential properties. The RPPI provides a comprehensive portrait of the residential real estate market since it covers both the market for new houses and condominium apartments and the resale market in the census metropolitan areas (CMAs) of Montréal, Ottawa, Toronto, Calgary, Vancouver and Victoria, and for a composite of these six CMAs. The RPPI is a quarterly index, starting in the first quarter of 2017.
The RPPI is subject to a quarterly revision and is not seasonally adjusted.
Products
The article "The resilience and strength of the new housing market during the pandemic" examines the changes in new home prices in Canada for the 27 census metropolitan areas (CMAs) surveyed in the New Housing Price Index. It also compares city rankings based on housing prices six months after the start of the pandemic (August compared with February).
A study, titled Price trends and outlook in key Canadian housing markets, examines where the housing market was at the onset of the COVID-19 pandemic, sheds light on what has happened since then and explores the challenges of the Canadian market going forward.
The infographic The Impact of COVID-19 on Key Housing Markets, part of Statistics Canada – Infographics (11-627-M), is available. It provides a look at the housing market before, during and after COVID-19.
Statistics Canada has a Residential Property Price Index Data Visualization Tool. This interactive dashboard provides access to current and historical data for the Residential Property Price Index (RPPI) and its sub-components (new and resale houses and condominium apartments) for the CMAs of Montréal, Ottawa, Toronto, Calgary, Vancouver and Victoria, and for a composite of these six CMAs, in a dynamic and customizable format.
The Methodology of the Residential Property Price Index (RPPI) is available. This document provides details on the methodology used to calculate the New Housing Price Index, the New Condominium Apartment Price Index and the Resale Residential Property Price Index. It also provides details on how these indexes are compiled to form the RPPI.
Next Residential Property Price Index release
The Residential Property Price Index for the first quarter of 2021 will be released on May 7.
Contact information
For more information, or to enquire about the concepts, methods or data quality of this release, contact us (toll-free 1-800-263-1136; 514-283-8300; STATCAN.infostats-infostats.STATCAN@canada.ca) or Media Relations (613-951-4636; STATCAN.mediahotline-ligneinfomedias.STATCAN@canada.ca).
- Date modified:


