
Labour Statistics: Technical Papers
Monitoring employment trends using the Labour Force Survey and the Survey of Employment, Payrolls and Hours
Text begins
Introduction
Statistics Canada has two monthly surveys that measure employment levels and trends: the Labour Force Survey (LFS), a household survey, and the Survey of Employment, Payrolls and Hours (SEPH), which combines administrative data and establishment-level survey data from the Business Payroll Survey.
The main objective of the LFS is to classify the population aged 15 and older into three mutually exclusive groups in relation to the labour market—employed, unemployed, and not in the labour force. LFS data are released on a monthly basis, shortly after the end of the reference period and therefore provide the most timely picture of labour market conditions.
The SEPH provides monthly information on payroll employment, earnings and hours worked, tabulated by detailed industry. Preliminary data from the SEPH are released less than two months after the end of the reference month.
Statistics from the LFS and SEPH, along with those from other sources, such as the Job Vacancy and Wage Survey and the Census of Population, contribute to a comprehensive understanding of Canada’s labour market, from both the supply-side and demand-side perspectives.
The objective of this technical note is to provide guidance on the interpretation of employment data from the LFS and SEPH. It highlights important considerations to take into account when comparing employment data from each statistical program, and outlines factors which can contribute to short-term discrepancies between the two data sources.
This note complements an earlier technical note which specifically examined earnings and wages estimates from SEPH and LFS. For more information, see: Earnings and Wages – A guide to using indicators from the Survey of Employment, Payrolls and Hours and the Labour Force Survey.
Employment trends from the LFS and SEPH are generally aligned
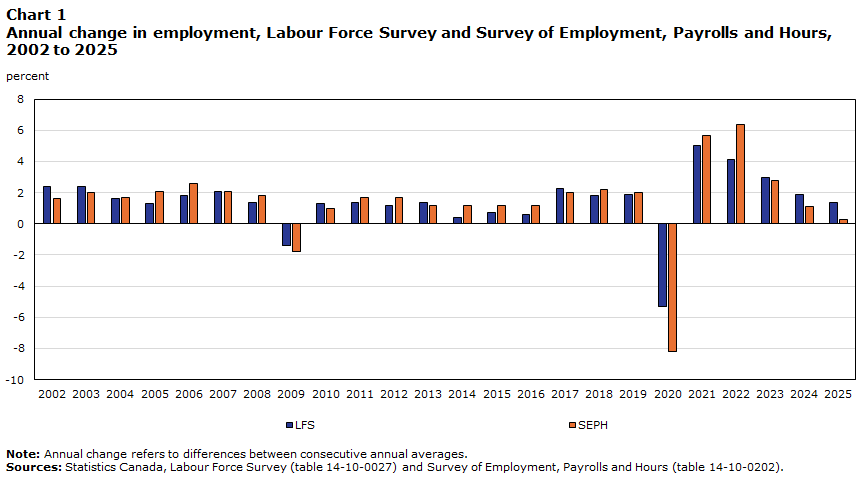
Chart 1 presents annual employment changes measured using the LFS and SEPH beginning in 2001, when comparable SEPH data became available. As shown, employment trends from both surveys generally align and reflect important changes in labour market conditions over the period, such as the 2008/2009 recession and the labour market impacts of the COVID-19 pandemic.
Data table for Chart 1
| LFS | SEPH | |
|---|---|---|
| percent | ||
| Note: Annual change refers to differences between consecutive annual averages. Sources: Statistics Canada, Labour Force Survey (table 14-10-0027) and Survey of Employment, Payrolls and Hours (table 14-10-0202). |
||
| 2002 | 2.4 | 1.6 |
| 2003 | 2.4 | 2.0 |
| 2004 | 1.6 | 1.7 |
| 2005 | 1.3 | 2.1 |
| 2006 | 1.8 | 2.6 |
| 2007 | 2.1 | 2.1 |
| 2008 | 1.4 | 1.8 |
| 2009 | -1.4 | -1.8 |
| 2010 | 1.3 | 1.0 |
| 2011 | 1.4 | 1.7 |
| 2012 | 1.2 | 1.7 |
| 2013 | 1.4 | 1.2 |
| 2014 | 0.4 | 1.2 |
| 2015 | 0.7 | 1.2 |
| 2016 | 0.6 | 1.2 |
| 2017 | 2.3 | 2.0 |
| 2018 | 1.8 | 2.2 |
| 2019 | 1.9 | 2.0 |
| 2020 | -5.3 | -8.2 |
| 2021 | 5.0 | 5.7 |
| 2022 | 4.1 | 6.4 |
| 2023 | 3.0 | 2.8 |
| 2024 | 1.9 | 1.1 |
| 2025 | 1.4 | 0.3 |
That said, differences in the pace of employment growth between the two surveys are sometimes apparent. For example, employment growth was notably faster in the SEPH than in the LFS for three consecutive years from 2014 to 2016, and again in 2022.
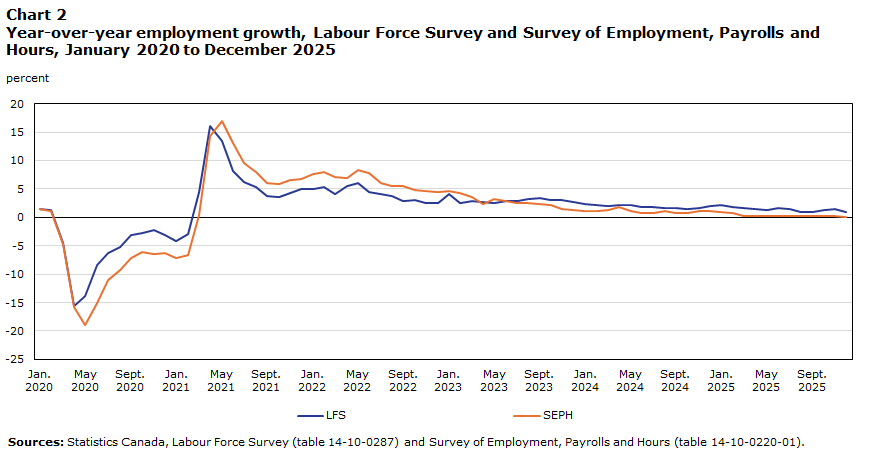
A discrepancy in the pace of employment growth between the two surveys was also observed in the fall of 2025, when employment in the LFS expanded, while payroll employment in the SEPH recorded little net variation. Prior to this period, both the SEPH and the LFS showed no net increase in employment from January to August 2025—a period that coincided with heightened economic uncertainty associated with the threat or imposition of tariffs on Canadian exports to the U.S. For more information, see: United States tariffs and Canadian labour market trends.
Signals from the two programs have also been generally consistent in the post‑pandemic period, up to the trade disruptions in 2025. After most COVID‑19 public health restrictions were lifted, employment in both the SEPH and the LFS rebounded sharply and continued to grow strongly through 2022 and into 2023 (Chart 2). As labour market conditions eased in the second half of 2023 and in 2024, employment growth in both programs slowed. Similarly, job vacancies reached a record high of approximately one million in the second quarter of 2022, before trending down over the next three years, according to the Job Vacancy and Wage Survey.
Data table for Chart 2
| LFS | SEPH | |
|---|---|---|
| percent | ||
| Sources: Statistics Canada, Labour Force Survey (table 14-10-0287) and Survey of Employment, Payrolls and Hours (table 14-10-0220-01). | ||
| 2020 | ||
| January | 1.5 | 1.5 |
| February | 1.3 | 1.1 |
| March | -4.6 | -4.7 |
| April | -15.6 | -15.7 |
| May | -13.9 | -18.9 |
| June | -8.4 | -15.0 |
| July | -6.2 | -11.0 |
| August | -5.3 | -9.2 |
| September | -3.1 | -7.1 |
| October | -2.7 | -6.1 |
| November | -2.3 | -6.5 |
| December | -3.1 | -6.2 |
| 2021 | ||
| January | -4.2 | -7.2 |
| February | -3.0 | -6.6 |
| March | 4.5 | 0.4 |
| April | 16.1 | 14.4 |
| May | 13.5 | 16.9 |
| June | 8.2 | 13.1 |
| July | 6.3 | 9.6 |
| August | 5.3 | 7.9 |
| September | 3.7 | 6.1 |
| October | 3.6 | 5.8 |
| November | 4.2 | 6.5 |
| December | 4.9 | 6.8 |
| 2022 | ||
| January | 5.0 | 7.6 |
| February | 5.4 | 7.9 |
| March | 4.1 | 7.1 |
| April | 5.5 | 7.0 |
| May | 6.1 | 8.4 |
| June | 4.5 | 7.8 |
| July | 4.1 | 6.0 |
| August | 3.7 | 5.5 |
| September | 2.8 | 5.5 |
| October | 3.1 | 4.8 |
| November | 2.5 | 4.7 |
| December | 2.5 | 4.5 |
| 2023 | ||
| January | 4.1 | 4.7 |
| February | 2.6 | 4.3 |
| March | 2.9 | 3.5 |
| April | 2.7 | 2.4 |
| May | 2.5 | 3.2 |
| June | 2.9 | 2.8 |
| July | 2.9 | 2.6 |
| August | 3.2 | 2.5 |
| September | 3.4 | 2.3 |
| October | 3.1 | 2.2 |
| November | 3.0 | 1.4 |
| December | 2.7 | 1.3 |
| 2024 | ||
| January | 2.3 | 1.2 |
| February | 2.2 | 1.1 |
| March | 2.0 | 1.3 |
| April | 2.1 | 1.8 |
| May | 2.2 | 1.2 |
| June | 1.9 | 0.7 |
| July | 1.8 | 0.8 |
| August | 1.6 | 1.1 |
| September | 1.6 | 0.7 |
| October | 1.5 | 0.7 |
| November | 1.6 | 1.1 |
| December | 2.0 | 1.1 |
| 2025 | ||
| January | 2.1 | 1.0 |
| February | 1.9 | 0.7 |
| March | 1.7 | 0.2 |
| April | 1.4 | 0.2 |
| May | 1.3 | 0.2 |
| June | 1.6 | 0.3 |
| July | 1.4 | 0.3 |
| August | 0.9 | 0.2 |
| September | 1.0 | 0.2 |
| October | 1.3 | 0.3 |
| November | 1.4 | 0.3 |
| December | 1.0 | 0.0 |
LFS and SEPH employment data series can be adjusted to facilitate comparisons
Every month, a wide range of data quality indicators are reviewed prior to the release of LFS and SEPH estimates, alongside a confrontation of trends across data sources. In this context, data confrontation between the LFS and the SEPH is ongoing and part of the data certification processes of both programs.
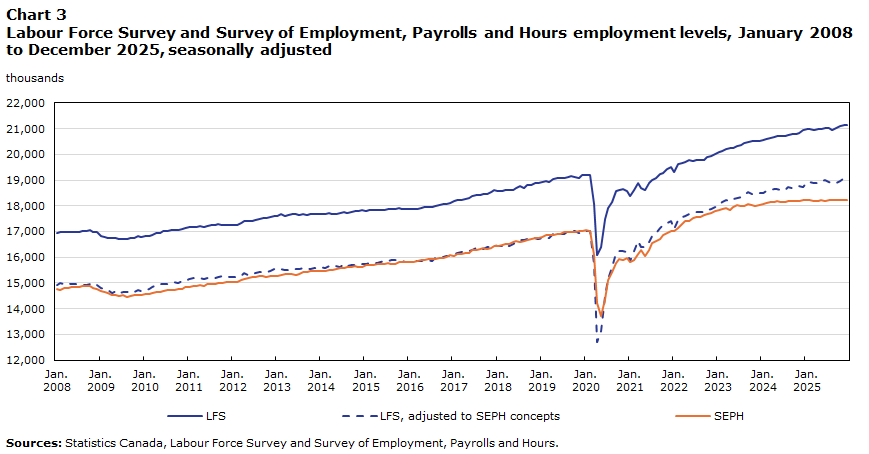
When comparing data from the two sources, it is important to account for differences in concepts and definitions. To this end, an adjusted LFS series can be produced for comparability purposes which is closer in concepts and definitions to SEPH payroll employment (Chart 3). In the adjusted LFS series, employment in industries not covered in SEPH (e.g., agriculture, fishing and hunting), self-employed workers (except those incorporated with paid employees) and workers absent without pay from their jobs are removed, while the secondary jobs of multiple job holders are
Data table for Chart 3
| LFS | LFS, adjusted to SEPH concepts | SEPH | |
|---|---|---|---|
| thousands | |||
| Sources: Statistics Canada, Labour Force Survey and Survey of Employment, Payrolls and Hours. | |||
| 2008 | |||
| January | 16,932.2 | 14,931.1 | 14,745.9 |
| February | 16,967.5 | 14,985.8 | 14,739.9 |
| March | 16,972.1 | 14,962.0 | 14,784.6 |
| April | 16,971.8 | 14,979.9 | 14,803.5 |
| May | 16,986.8 | 14,971.3 | 14,830.6 |
| June | 16,996.2 | 14,958.7 | 14,846.3 |
| July | 16,980.9 | 14,950.1 | 14,836.9 |
| August | 17,003.3 | 14,910.2 | 14,877.1 |
| September | 17,025.4 | 14,906.9 | 14,861.9 |
| October | 17,070.5 | 14,956.3 | 14,870.9 |
| November | 16,982.7 | 14,886.9 | 14,812.7 |
| December | 16,972.3 | 14,910.9 | 14,763.3 |
| 2009 | |||
| January | 16,824.7 | 14,799.9 | 14,683.3 |
| February | 16,782.4 | 14,745.9 | 14,650.2 |
| March | 16,756.4 | 14,710.9 | 14,589.1 |
| April | 16,730.8 | 14,626.3 | 14,543.7 |
| May | 16,740.7 | 14,669.8 | 14,531.0 |
| June | 16,712.7 | 14,610.1 | 14,501.2 |
| July | 16,702.8 | 14,629.1 | 14,538.5 |
| August | 16,702.7 | 14,637.3 | 14,457.8 |
| September | 16,743.8 | 14,689.3 | 14,497.9 |
| October | 16,753.3 | 14,650.0 | 14,522.5 |
| November | 16,824.7 | 14,734.6 | 14,521.6 |
| December | 16,797.4 | 14,696.9 | 14,537.2 |
| 2010 | |||
| January | 16,825.0 | 14,736.2 | 14,549.5 |
| February | 16,818.0 | 14,753.4 | 14,574.4 |
| March | 16,861.7 | 14,832.1 | 14,602.6 |
| April | 16,928.5 | 14,900.2 | 14,642.3 |
| May | 16,946.8 | 14,940.6 | 14,642.6 |
| June | 17,024.6 | 14,970.6 | 14,670.6 |
| July | 17,036.5 | 14,946.9 | 14,733.3 |
| August | 17,062.1 | 14,984.0 | 14,704.9 |
| September | 17,058.4 | 15,020.3 | 14,743.4 |
| October | 17,044.3 | 15,008.1 | 14,766.5 |
| November | 17,089.4 | 15,056.7 | 14,778.1 |
| December | 17,117.4 | 15,073.3 | 14,833.6 |
| 2011 | |||
| January | 17,187.2 | 15,151.4 | 14,837.2 |
| February | 17,174.8 | 15,174.4 | 14,865.8 |
| March | 17,173.7 | 15,172.3 | 14,891.9 |
| April | 17,222.1 | 15,171.5 | 14,909.3 |
| May | 17,187.4 | 15,137.2 | 14,876.0 |
| June | 17,218.8 | 15,204.8 | 14,941.1 |
| July | 17,256.4 | 15,171.6 | 14,946.5 |
| August | 17,269.4 | 15,194.8 | 14,948.9 |
| September | 17,272.0 | 15,230.7 | 14,994.0 |
| October | 17,258.0 | 15,273.8 | 14,988.6 |
| November | 17,241.4 | 15,258.4 | 15,035.8 |
| December | 17,258.2 | 15,216.0 | 15,040.1 |
| 2012 | |||
| January | 17,270.1 | 15,230.3 | 15,052.3 |
| February | 17,245.0 | 15,248.5 | 15,054.3 |
| March | 17,338.6 | 15,256.5 | 15,097.4 |
| April | 17,416.2 | 15,377.4 | 15,144.4 |
| May | 17,412.2 | 15,324.6 | 15,205.4 |
| June | 17,414.7 | 15,335.7 | 15,225.0 |
| July | 17,439.8 | 15,393.5 | 15,227.2 |
| August | 17,486.0 | 15,421.2 | 15,255.9 |
| September | 17,534.5 | 15,405.0 | 15,252.3 |
| October | 17,543.2 | 15,417.5 | 15,232.0 |
| November | 17,563.8 | 15,451.2 | 15,278.1 |
| December | 17,609.5 | 15,544.3 | 15,255.4 |
| 2013 | |||
| January | 17,600.7 | 15,504.1 | 15,283.2 |
| February | 17,676.1 | 15,542.0 | 15,326.5 |
| March | 17,610.4 | 15,503.2 | 15,357.8 |
| April | 17,641.3 | 15,510.7 | 15,363.3 |
| May | 17,692.5 | 15,547.8 | 15,335.5 |
| June | 17,682.1 | 15,543.1 | 15,311.0 |
| July | 17,650.1 | 15,531.7 | 15,364.9 |
| August | 17,677.9 | 15,573.6 | 15,441.6 |
| September | 17,659.6 | 15,563.6 | 15,421.1 |
| October | 17,664.4 | 15,557.9 | 15,448.3 |
| November | 17,691.3 | 15,564.5 | 15,455.6 |
| December | 17,668.9 | 15,571.7 | 15,449.4 |
| 2014 | |||
| January | 17,666.4 | 15,631.4 | 15,466.0 |
| February | 17,662.7 | 15,578.8 | 15,469.3 |
| March | 17,699.4 | 15,653.2 | 15,498.7 |
| April | 17,691.2 | 15,625.0 | 15,486.3 |
| May | 17,687.7 | 15,671.2 | 15,546.2 |
| June | 17,720.5 | 15,634.7 | 15,561.2 |
| July | 17,771.9 | 15,730.0 | 15,591.8 |
| August | 17,723.7 | 15,673.2 | 15,634.1 |
| September | 17,756.0 | 15,702.1 | 15,620.9 |
| October | 17,782.2 | 15,710.6 | 15,645.1 |
| November | 17,784.5 | 15,733.5 | 15,625.8 |
| December | 17,821.7 | 15,739.2 | 15,633.3 |
| 2015 | |||
| January | 17,813.1 | 15,738.9 | 15,690.8 |
| February | 17,827.2 | 15,757.6 | 15,695.1 |
| March | 17,854.1 | 15,791.6 | 15,692.2 |
| April | 17,819.4 | 15,776.6 | 15,727.7 |
| May | 17,843.7 | 15,818.7 | 15,751.8 |
| June | 17,836.7 | 15,856.9 | 15,718.3 |
| July | 17,863.3 | 15,870.2 | 15,754.6 |
| August | 17,889.0 | 15,871.4 | 15,723.9 |
| September | 17,890.2 | 15,876.7 | 15,742.3 |
| October | 17,899.1 | 15,905.6 | 15,805.2 |
| November | 17,872.6 | 15,857.7 | 15,794.7 |
| December | 17,867.4 | 15,830.0 | 15,825.0 |
| 2016 | |||
| January | 17,871.6 | 15,822.3 | 15,821.1 |
| February | 17,889.0 | 15,884.4 | 15,808.1 |
| March | 17,892.8 | 15,836.0 | 15,841.9 |
| April | 17,919.7 | 15,861.4 | 15,899.7 |
| May | 17,947.4 | 15,897.2 | 15,893.2 |
| June | 17,954.5 | 15,898.6 | 15,947.6 |
| July | 17,943.2 | 15,853.7 | 15,938.6 |
| August | 17,994.2 | 15,955.9 | 15,921.8 |
| September | 18,032.5 | 16,006.1 | 15,980.2 |
| October | 18,051.2 | 15,995.3 | 15,985.1 |
| November | 18,076.0 | 16,050.8 | 16,018.9 |
| December | 18,104.0 | 16,044.7 | 16,072.8 |
| 2017 | |||
| January | 18,172.5 | 16,139.3 | 16,062.7 |
| February | 18,216.6 | 16,172.1 | 16,125.8 |
| March | 18,241.5 | 16,207.7 | 16,129.3 |
| April | 18,271.6 | 16,254.7 | 16,148.4 |
| May | 18,312.9 | 16,247.3 | 16,179.4 |
| June | 18,371.4 | 16,292.8 | 16,263.9 |
| July | 18,416.9 | 16,352.9 | 16,272.6 |
| August | 18,436.4 | 16,344.8 | 16,319.0 |
| September | 18,442.5 | 16,323.8 | 16,351.7 |
| October | 18,475.1 | 16,385.9 | 16,332.0 |
| November | 18,550.5 | 16,404.3 | 16,368.5 |
| December | 18,619.7 | 16,481.2 | 16,423.1 |
| 2018 | |||
| January | 18,576.8 | 16,436.8 | 16,423.5 |
| February | 18,570.3 | 16,433.2 | 16,468.4 |
| March | 18,630.1 | 16,495.0 | 16,516.9 |
| April | 18,613.0 | 16,438.9 | 16,516.4 |
| May | 18,621.7 | 16,527.6 | 16,578.3 |
| June | 18,677.6 | 16,607.5 | 16,613.3 |
| July | 18,763.9 | 16,659.8 | 16,587.5 |
| August | 18,704.7 | 16,662.4 | 16,624.9 |
| September | 18,797.5 | 16,722.1 | 16,659.0 |
| October | 18,814.9 | 16,689.5 | 16,711.9 |
| November | 18,869.4 | 16,764.2 | 16,744.9 |
| December | 18,892.8 | 16,723.3 | 16,732.3 |
| 2019 | |||
| January | 18,920.5 | 16,751.2 | 16,804.0 |
| February | 18,965.7 | 16,739.9 | 16,850.4 |
| March | 18,932.9 | 16,753.4 | 16,875.3 |
| April | 19,053.7 | 16,910.9 | 16,877.3 |
| May | 19,067.3 | 16,946.0 | 16,918.5 |
| June | 19,078.6 | 16,920.0 | 16,920.9 |
| July | 19,072.4 | 16,916.2 | 16,977.6 |
| August | 19,133.9 | 17,008.4 | 16,991.0 |
| September | 19,142.8 | 17,025.3 | 16,970.4 |
| October | 19,130.9 | 17,015.4 | 16,980.9 |
| November | 19,096.8 | 16,953.6 | 17,010.5 |
| December | 19,186.5 | 17,034.1 | 17,017.6 |
| 2020 | |||
| January | 19,204.7 | 17,010.2 | 17,052.5 |
| February | 19,202.9 | 17,011.9 | 17,034.4 |
| March | 18,058.2 | 15,720.2 | 16,079.2 |
| April | 16,085.8 | 12,705.0 | 14,214.4 |
| May | 16,410.7 | 13,143.7 | 13,721.8 |
| June | 17,469.4 | 14,497.8 | 14,378.0 |
| July | 17,895.5 | 15,164.0 | 15,106.2 |
| August | 18,129.3 | 15,607.3 | 15,431.4 |
| September | 18,555.9 | 16,176.0 | 15,757.2 |
| October | 18,616.4 | 16,226.7 | 15,936.8 |
| November | 18,650.0 | 16,223.9 | 15,907.6 |
| December | 18,591.7 | 16,197.6 | 15,951.9 |
| 2021 | |||
| January | 18,392.1 | 15,867.5 | 15,824.7 |
| February | 18,632.0 | 16,240.0 | 15,896.9 |
| March | 18,873.0 | 16,647.0 | 16,142.8 |
| April | 18,673.8 | 16,404.2 | 16,262.0 |
| May | 18,623.6 | 16,395.3 | 16,043.0 |
| June | 18,894.4 | 16,588.5 | 16,261.9 |
| July | 19,016.5 | 16,819.5 | 16,562.7 |
| August | 19,081.7 | 16,922.9 | 16,646.1 |
| September | 19,251.1 | 17,124.6 | 16,725.0 |
| October | 19,288.1 | 17,243.5 | 16,855.4 |
| November | 19,437.3 | 17,324.0 | 16,936.6 |
| December | 19,508.8 | 17,426.4 | 17,037.4 |
| 2022 | |||
| January | 19,305.4 | 17,100.5 | 17,025.2 |
| February | 19,629.0 | 17,441.5 | 17,154.1 |
| March | 19,647.8 | 17,551.0 | 17,287.3 |
| April | 19,709.7 | 17,601.8 | 17,409.0 |
| May | 19,763.4 | 17,666.2 | 17,401.8 |
| June | 19,750.8 | 17,711.1 | 17,525.7 |
| July | 19,787.5 | 17,739.4 | 17,552.2 |
| August | 19,781.2 | 17,748.7 | 17,560.5 |
| September | 19,796.1 | 17,752.9 | 17,642.5 |
| October | 19,882.8 | 17,834.7 | 17,661.1 |
| November | 19,923.8 | 17,880.2 | 17,732.4 |
| December | 19,998.5 | 17,948.8 | 17,799.1 |
| 2023 | |||
| January | 20,097.5 | 18,037.7 | 17,830.5 |
| February | 20,143.3 | 18,145.1 | 17,892.5 |
| March | 20,214.7 | 18,230.5 | 17,899.0 |
| April | 20,242.1 | 18,185.1 | 17,820.6 |
| May | 20,253.9 | 18,263.3 | 17,953.9 |
| June | 20,325.1 | 18,290.0 | 18,013.5 |
| July | 20,356.9 | 18,357.4 | 18,007.3 |
| August | 20,423.7 | 18,408.7 | 18,000.1 |
| September | 20,473.1 | 18,527.5 | 18,053.6 |
| October | 20,501.8 | 18,441.0 | 18,047.3 |
| November | 20,522.2 | 18,462.6 | 17,982.5 |
| December | 20,530.6 | 18,507.4 | 18,034.1 |
| 2024 | |||
| January | 20,552.1 | 18,508.7 | 18,052.6 |
| February | 20,593.8 | 18,565.4 | 18,088.4 |
| March | 20,620.8 | 18,610.5 | 18,137.8 |
| April | 20,674.9 | 18,669.3 | 18,140.8 |
| May | 20,707.2 | 18,641.3 | 18,167.7 |
| June | 20,708.1 | 18,618.0 | 18,140.4 |
| July | 20,725.1 | 18,600.4 | 18,156.2 |
| August | 20,760.4 | 18,722.7 | 18,190.7 |
| September | 20,796.0 | 18,692.5 | 18,176.9 |
| October | 20,804.9 | 18,727.1 | 18,168.7 |
| November | 20,842.0 | 18,755.2 | 18,173.7 |
| December | 20,934.7 | 18,739.8 | 18,230.4 |
| 2025 | |||
| January | 20,986.9 | 18,927.8 | 18,235.2 |
| February | 20,985.5 | 18,926.4 | 18,209.4 |
| March | 20,964.3 | 18,874.6 | 18,174.2 |
| April | 20,966.7 | 18,891.0 | 18,179.0 |
| May | 20,974.4 | 18,958.1 | 18,205.2 |
| June | 21,040.7 | 19,004.5 | 18,188.3 |
| July | 21,018.3 | 18,930.7 | 18,212.7 |
| August | 20,956.6 | 18,873.1 | 18,236.0 |
| September | 21,009.9 | 18,895.3 | 18,209.2 |
| October | 21,083.6 | 18,978.9 | 18,231.6 |
| November | 21,135.9 | 19,066.9 | 18,232.9 |
| December | 21,146.0 | 19,050.4 | 18,222.4 |
This adjustment can have a sizable impact on comparisons between LFS and SEPH estimates. For example, in the 12 months to December 2024, employment in the LFS (unadjusted to SEPH concepts) increased by 1.9% (+393,000). Adjusted to SEPH concepts, employment in the LFS was up 1.3% (+243,000) over the same period, which is closer to growth observed in the SEPH (excluding the territories) (+1.0%; +180,000) (not seasonally adjusted).
It is important to note that this adjustment process has limitations, and it is not possible to fully reconcile the two series in an accounting
In addition, the methodologies of the two programs are optimized to serve different purposes. The LFS methodology is optimized to produce reliable estimates of month-to-month variations in key labour market indicators, such as the official unemployment rate. Meanwhile, the SEPH is optimized to produce disaggregated estimates by detailed industry. For these reasons, differences in levels between the two series, even when adjusted to be closer in concepts to each other, should be interpreted with caution.
Importantly, while the LFS can provide valuable and more timely signals about the general contributions of various sectors to employment growth, the SEPH is specifically designed and better suited to examine employment trends by detailed industry. For an example of how SEPH data can be used to monitor payroll employment trends by detailed industry, see: Recent employment trends in industries dependent on U.S. demand.
As monthly data from both the LFS and SEPH are subject to sampling and non-sampling error, users are encouraged to examine trends across multiple months when assessing labour market conditions
As in all surveys, sampling and non-sampling error can have an impact on LFS and SEPH estimates and may therefore contribute to short-term discrepancies between the two programs.
In the LFS, sampling error occurs because estimates are derived from a sample of households. Measures of sampling error associated with most key labour market indicators in the LFS are made available on a monthly basis (for more information about data quality indicators in the LFS, see the Guide to the Labour Force Survey).
LFS data users are encouraged to look at data over a span of months when assessing changes in labour market conditions. While a given monthly variation may partly reflect sampling error, trends that are observed over several months are more likely to reflect a true economic
Because payroll employment in the SEPH is derived from administrative records (PD7 payroll deduction forms remitted by employers to the Canada Revenue Agency), estimates are not subject to sampling error. However, non-sampling error may occur for many reasons, such as non-response, coverage and classification errors, or incorrect information from remitters. The SEPH has a quality-control program designed to minimize non-sampling errors. Monthly revisions to SEPH estimates and an annual historical revision also help to further minimize non-sampling error. Despite this, non-sampling error can still have an impact on payroll employment estimates from the SEPH in the short-term. For more information see the Guide to the Survey of Employment, Payrolls and Hours.
Rapid demographic shifts can have a temporary impact on LFS employment levels, which may contribute to a discrepancy between employment data from the two programs
In recent years, Canada has experienced unique demographic shifts, characterized by rapid changes in the pace and composition of population growth, largely driven by temporary and permanent immigration. Such rapid demographic shifts can have short-term impacts on estimates from a household survey like the LFS and contribute to a difference between LFS and SEPH employment estimates.
Information gathered from LFS respondents is weighted to represent the survey target population using population control
The use of moving averages helps to mitigate the impact of large monthly variations and seasonal patterns in the number of NPRs, thereby helping to provide more stable and reliable signals of month-to-month changes in labour market conditions in the LFS. However, the use of these moving averages also means that the LFS will reflect rapid changes in the pace of population growth with a
In these periods of rapid demographic shifts, users are encouraged to monitor variations in the employment rate, in addition to variations in employment. This is because such rapid shifts are less likely to impact trends for LFS indicators expressed in terms of rates or averages, such as the unemployment rate, the employment rate, or average hourly wages.
It should also be noted that rapid changes in the composition of the population, such as the sharp increase in the share of non-permanent residents in the population after 2022, can also have an impact on estimates in levels based on a household survey like the LFS. As noted in Census undercoverage studies, non-permanent residents are usually more challenging to contact in a household survey, resulting in undercoverage. Such an undercoverage would be mitigated by the LFS weighting and calibration
Unlike with the LFS, preliminary monthly employment data from the SEPH are subject to revisions
Monthly estimates of payroll employment in the SEPH are initially released on a preliminary basis, using payroll deduction records from the Canada Revenue Agency (CRA), with an imputation process to account for missing records. With each SEPH release, data for the preceding month are revised to account for records received from the CRA that were not available when preliminary estimates were produced.
Historically, additional data received from the CRA has led, on average, to upwards revisions. Over the three-year period from January 2023 to December 2025, preliminary monthly estimates of payroll employment in the SEPH have, on average, been revised up by 18,000.
These revisions can contribute to a heightened perception of discrepancies between SEPH and LFS employment figures, to the extent that comparisons are often based on the latest preliminary SEPH data. When confronting data from the two programs, users are encouraged to focus on the latest available revised data from the SEPH.
Conclusion
Employment from the LFS and payroll employment from the SEPH both provide reliable information on current labour market conditions. Used together and in combination with other labour market indicators from other sources (like the Job Vacancy and Wage Survey), they contribute to a better understanding of labour supply and demand in Canada.
Whether LFS or SEPH data are examined, users are strongly encouraged to consider information across multiple months, and to interpret the series in the context of their longer-term trends. Users are also encouraged to take into account differences in concepts and definitions outlined in this note when examining data from the two surveys.
Each data source has strengths and limitations. Because the SEPH is largely based on a census of administrative payroll data, it is less subject to sampling error than the LFS and is not expected to be impacted by rapid changes in the pace or composition of the population. The SEPH should also be considered the preferred source of employment information by industry. That said, SEPH data users should take into account that preliminary estimates are subject to revisions when assessing labour market conditions or comparing with indicators from the LFS.
On the other hand, data from the LFS are more timely and more comprehensive. LFS data are released shortly after the end of the reference month, approximately two months before preliminary SEPH data are released. The LFS also includes workers from all industries, employees or self-employed, as well as people who are unemployed or not participating in the labour force. The LFS is ideally suited for person-level analyses that focus on sociodemographic characteristics, such as age and gender. In addition to variations in employment, LFS users are encouraged to monitor variations in the employment rate, particularly in periods of rapid demographic shifts.
- Date modified: