
Economic and Social Reports
Recent employment trends in industries dependent on U.S. demand
DOI: https://doi.org/10.25318/36280001202501200003-eng
Text begins
Introduction
U.S. tariffs on goods imported from Canada are ongoing and in flux. The introduction of tariffs and subsequent pauses, a reprieve for Canada-United States-Mexico Agreement (CUSMA)- compliant goods, as well as additional tariffs on autos, steel and aluminum, oil and gas, and lumber, have created uncertainty for businesses, weighing on cross-border trade, non-residential investment and hiring intentions. Economy-wide output slowed when tariffs went into effect, as goods production fell and exports to the United States scaled back
This paper examines trends in payroll employment following the introduction of U.S. tariffs. It compares employment trends in industries dependent on the U.S. demand for Canadian products with those in sectors that are less reliant on U.S.
Payrolls decrease in industries dependent on U.S. demand
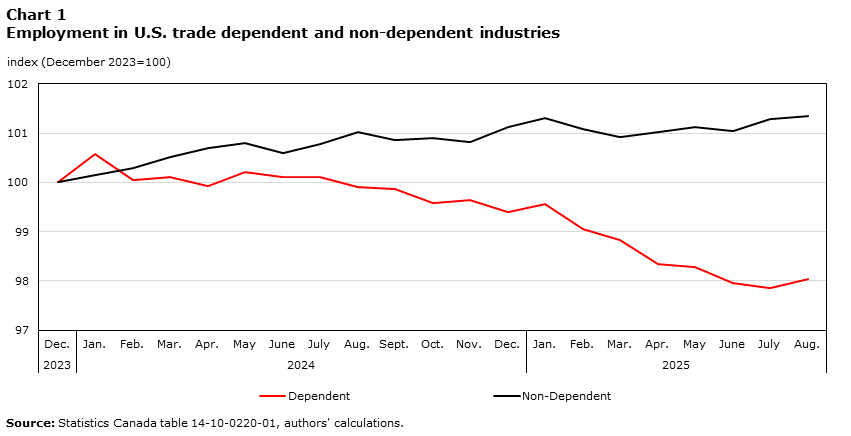
Total payroll employment, based on data collected from the Survey of Employment, Payrolls and Hours, was essentially unchanged from December 2024 to August 2025. Payroll employment in industries that are less reliant on U.S. demand—including construction, utilities and food manufacturing, as well as wholesale trade, real estate, health and social services, education, and public administration—edged up by 0.2% (+38,100) over this eight-month period (Chart 1). By comparison, employment in industries dependent on U.S. demand for Canadian exports fell by 1.4% (-18,100). Trade-dependent industries include goods-producing industries such as transportation equipment manufacturing, chemical manufacturing, oil and gas extraction, and primary metal manufacturing, as well as service-producing industries such as truck transportation. Employment losses in trade-dependent industries had already started in 2024, prior to the introduction of the tariffs, but accelerated in early 2025 as trade tensions escalated.
Data table for Chart 1
| Dependent | Non-Dependent | |
|---|---|---|
| index (December 2023=100) | ||
| Source: Statistics Canada table 14-10-0220-01 , authors' calculations. | ||
| 2023 | ||
| December | 100.0 | 100.0 |
| 2024 | ||
| January | 100.6 | 100.2 |
| February | 100.0 | 100.3 |
| March | 100.1 | 100.5 |
| April | 99.9 | 100.7 |
| May | 100.2 | 100.8 |
| June | 100.1 | 100.6 |
| July | 100.1 | 100.8 |
| August | 99.9 | 101.0 |
| September | 99.9 | 100.9 |
| October | 99.6 | 100.9 |
| November | 99.6 | 100.8 |
| December | 99.4 | 101.1 |
| 2025 | ||
| January | 99.6 | 101.3 |
| February | 99.1 | 101.1 |
| March | 98.8 | 100.9 |
| April | 98.3 | 101.0 |
| May | 98.3 | 101.1 |
| June | 97.9 | 101.1 |
| July | 97.9 | 101.3 |
| August | 98.0 | 101.4 |
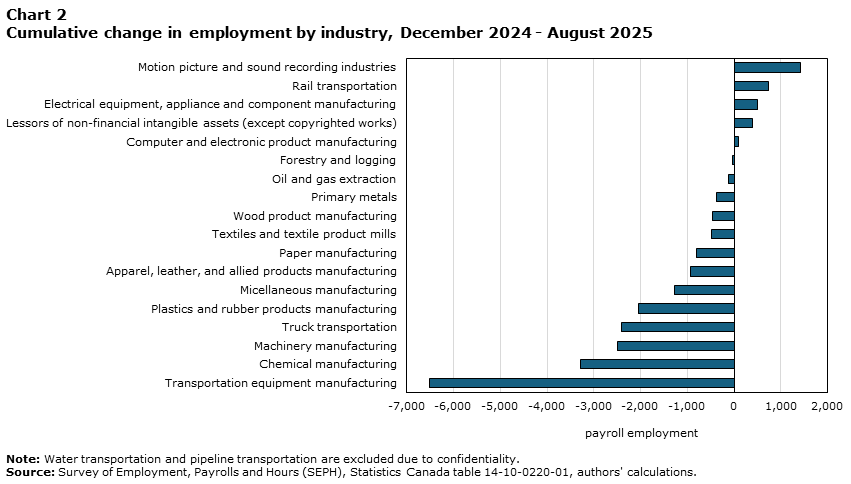
Payroll employment fell at transportation equipment manufacturers following the introduction of tariffs (Chart 2). From December 2024 to August 2025, payrolls in this industry decreased by 6,500 (-3.2%). Most of the decline reflected lower payrolls at motor vehicle parts manufacturers, which fell by 5,600 (‑7.8%). While parts suppliers have experienced losses, employment edged higher at motor vehicle manufacturers over this eight-month period.
Data table for Chart 2
| Payroll employment | |
|---|---|
| Note: Water transportation and pipeline transportation are excluded due to confidentiality.
Source: Survey of Employment, Payrolls and Hours (SEPH), Statistics Canada table 14-10-0220-01, authors' calculations. |
|
| Motion picture and sound recording industries | 1,415 |
| Rail transportation | 745 |
| Electrical equipment, appliance and component manufacturing | 507 |
| Lessors of non-financial intangible assets (except copyrighted works) | 388 |
| Computer and electronic product manufacturing | 102 |
| Forestry and logging | -32 |
| Oil and gas extraction | -124 |
| Primary metals | -386 |
| Wood product manufacturing | -468 |
| Textiles and textile product mills | -486 |
| Paper manufacturing | -812 |
| Apparel, leather, and allied products manufacturing | -924 |
| Micellaneous manufacturing | -1,274 |
| Plastics and rubber products manufacturing | -2,036 |
| Truck transportation | -2,406 |
| Machinery manufacturing | -2,493 |
| Chemical manufacturing | -3,292 |
| Transportation equipment manufacturing | -6,512 |
Payrolls at chemical manufacturers fell by 3,300 (-3.4%) during the first eight months of 2025, largely reflecting lower employment at pesticide, fertilizer and other agricultural chemical producers (‑1,200, ‑16.5%). Trucking establishments (-2,400, -1.1%), machinery manufacturers (-2,500, -1.8%), and plastics and rubber product manufacturers (-2,000, -2.1%), also reported significant declines. Conversely, employment in the motion picture and sound recording industries increased (+2,000, +2.2%). In the oil and gas extraction sector, there was little change in employment.
Layoff rates remain similar to historical levels
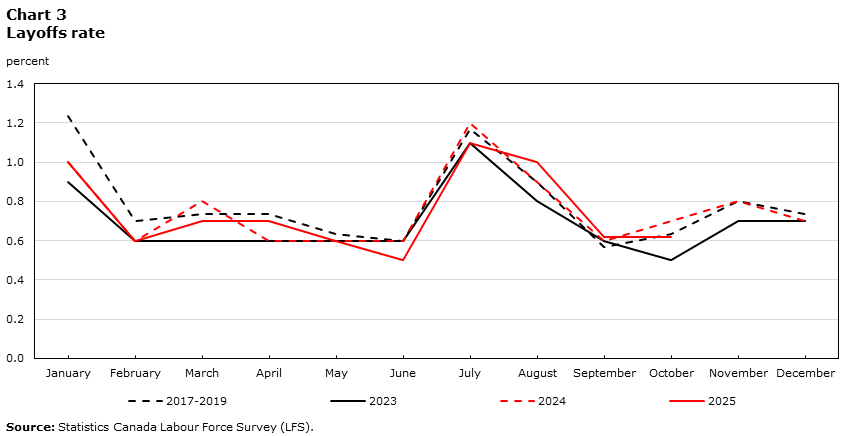
While uncertainty related to tariffs and trade has weighed on labour demand, overall layoff rates have remained similar to historical levels. The economy-wide layoff rate—which can be calculated from the Labour Force Survey—was unchanged, at 0.6%, in October, compared with 12 months earlier. The layoff rate for the corresponding month from 2017 to 2019, prior to the pandemic, was also 0.6% and deviated only slightly from the same period in 2023 and 2024 (Chart 3).
Data table for Chart 3
| 2017-2019 | 2023 | 2024 | 2025 | |
|---|---|---|---|---|
| percent | ||||
|
||||
| January | 1.2 | 0.9 | 1.0 | 1.0 |
| February | 0.7 | 0.6 | 0.6 | 0.6 |
| March | 0.7 | 0.6 | 0.8 | 0.7 |
| April | 0.7 | 0.6 | 0.6 | 0.7 |
| May | 0.6 | 0.6 | 0.6 | 0.6 |
| June | 0.6 | 0.6 | 0.6 | 0.5 |
| July | 1.2 | 1.1 | 1.2 | 1.1 |
| August | 0.9 | 0.8 | 0.9 | 1.0 |
| September | 0.6 | 0.6 | 0.6 | 0.6 |
| October | 0.6 | 0.5 | 0.7 | 0.6 |
| November | 0.8 | 0.7 | 0.8 | .. not available for a specific reference period |
| December | 0.7 | 0.7 | 0.7 | .. not available for a specific reference period |
Similarly, the average layoff rate from January 2025 to October 2025 in industries dependent on U.S. demand for exports (0.9%) was similar to the rate for the corresponding months in 2024 and before the pandemic (from 2017 to 2019). This suggests that employment declines in trade-dependent industries have not primarily been driven by higher layoffs. According to the Bank of Canada’s Business Outlook Survey for the second quarter of 2025, many firms suggested that they would conduct layoffs only if they experienced a sharp or prolonged decline in sales, and even then, layoffs were often viewed as a last resort.
On the other hand, hiring has been slower. Unemployed people have been more likely to remain unemployed from one month to the next, particularly in the summer of 2025. For example, among those who were unemployed in July, 15.2% had found work in August. This is significantly lower than the proportion for the same months from 2017 to 2019 (23.3%). Slower hiring may have contributed to lower employment levels in industries dependent on U.S. demand in 2025.
Conclusion
Output growth has slowed, and with it, employment growth has eased. Industries that are dependent on U.S. demand reported declines in employment, albeit small, while sectors less dependent on U.S. exports reported a small but positive increase in employment. While employment in trade-dependent industries decreased throughout 2024, the pace of decline accelerated following the introduction of U.S. tariffs on Canadian goods.
Layoff rates have remained similar to historical levels throughout this period, including in industries dependent on U.S. demand. However, there is evidence that hiring rates have declined, which may have contributed to employment declines.
Authors
Sean Clarke is with Strategic Analysis, Publications and Training Division, Statistics Canada. Andrew Fields is with Centre for Labour Market Information Division, Statistics Canada.
References
Bank of Canada. 2025. Business Outlook Survey—Second Quarter of 2025. July 21, 2025.
Gellatly, G. and C. McCormack. 2025. Recent developments in the Canadian economy: Fall 2025. Economic and Social Reports. Catalogue no. 36-28-0001. Ottawa: Statistics Canada. October 22, 2025.
Statistics Canada. 2025. Research to Insights: Canada’s Economy During Recent Canada-U.S. Trade Developments. Catalogue no. 11-631-X. Ottawa: Statistics Canada. October 27, 2025.
Statistics Canada. 2025. Table 12-10-0100-01 Value added in exports, by industry, provincial and territorial [Data table].
- Date modified: