
Economic and Social Reports
A profile of women inventors in Canada
DOI: https://doi.org/10.25318/36280001202400200001-eng
Text begins
Abstract
People and Skills is the first pillar in the Government of Canada’s Innovation and Skills Plan, and an important person in the innovation process is the inventor. Despite this, little is known about Canadian inventors. This paper provides A profile of women inventors in Canada and compares them with men inventors, using data on patent applications from the Canadian Intellectual Property Office, linked to the Canadian Employer–Employee Dynamics Database from 2005 to 2019. The study finds that, while Canadian men inventors who patent in Canada outnumber women, the number of women inventors grew at a faster pace over the period examined. Women inventors are more likely to be younger, a higher proportion of them are immigrants and they are more likely to “co-patent,” compared with men inventors. This paper also finds differences in employment trajectories between men and women inventors. Women inventors are more heavily concentrated in large businesses, and a higher proportion work in professional, scientific and technical services. In addition, women inventors are more likely to be owners of unincorporated businesses, while men inventors are more likely to be owners of incorporated businesses. Finally, men inventors are slightly more likely to be repeat inventors, that is, to submit more than one patent application over time.
Authors
Mwamba Mtonga-Clare is with the Agriculture Division at Statistics Canada. Amélie Lafrance-Cooke is with the Economic Analysis Division at Statistics Canada.
Acknowledgments
The authors would like to thank Rim Chatti, Marie Albertine Djuikom Tamtchouong, Mazahir Bhagat, Sean Martineau, Chahreddine Abbes and Danny Leung for their helpful comments.
Introduction
This is an era of many innovations, which contribute positively to the economy. Innovation starts with skilled, talented and creative people. Canada leads the G7 countries with the most educated workforce (Statistics Canada, 2022), but in an increasingly competitive global economy, more needs to be done to ensure that Canadians can learn, adapt and have good jobs throughout their working lives (Government of Canada, 2017).
In the literature, “innovation” has been referred to by many different terms, including “invention” (Corbin, 2010). Invention is activity directed toward the discovery of new and useful knowledge about products and processes. It is one of the most important phases of the growth of civilization (Schmookler, 1957). An inventor is someone who transforms ideas into new methods or devices and sometimes contributes to a patentable invention. A patent is a set of exclusive rights granted by a patent office to an inventor or their assignee for a fixed period, in exchange for the disclosure of an invention (Nikzad, 2014).
Innovation has also been linked to patents. In their paper, Acs et al. (2002) found empirical evidence suggesting that patents provide a fairly reliable measure of innovative activity. More recently, Corbin (2010) observed that the Organisation for Economic Co-operation and Development and other research organizations use the number of patents as a proxy measure for country innovativeness. Patents improve the allocation of resources by encouraging rapid experimentation and efficient ex post transfer of knowledge (Acemoglu et al., 2011). Policies that encourage the diffusion of ideas and modify patent laws to facilitate entry and encourage competition may be an effective mechanism to encourage innovation (Moser, 2013).
Recent work at Statistics Canada has focused on measuring innovation through patent applications. With the Canadian Patent Research Database (CPRD), Abbes et al. (2022a) found that there have been stronger increases in patenting by smaller firms with 0 to 19 employees in some service industries and a decline in patenting activity in large firms with 500 or more employees in the manufacturing sector. Abbes et al. (2023) extended the analysis of patenting activity based on ownership gender and found that men-owned businesses accounted for a larger share of patent applications than women-owned and equally owned businesses from 2001 to 2019.
While patents are important contributors to innovation, few studies have examined the individuals behind the patents. One such study is by Blit et al. (2018), who estimated patenting rates for ethnic populations in Canada from 1986 to 2011 using inventor names to identify ethnicity and census and National Household Survey ancestry data to estimate ethnic populations. The authors found higher patenting rates for ethnic populations in Canada, particularly for Canadians with Korean, Japanese and Chinese ancestry. Moreover, immigrants accounted for one-third of Canadian patents, despite making up less than one-quarter of the adult population.
Martinez et al. (2016) analyzed the gender of inventors in international patent applications. They compiled a worldwide gender–name dictionary, which includes 6.2 million names for 182 different countries to disambiguate the gender of Patent Cooperation Treaty (PCT) inventors. The results suggest that there was a gender imbalance in PCT applications, but that the proportion of women inventors was improving over time. They also found that the rates of participation by women differ substantially across countries, technological fields and sectors. The Canadian Intellectual Property Office (CIPO) studied the PCT applications by Canadian applicants and found that Canada has seen little change in the share of inventors who are women from 2001 to 2016, while the global share continued to grow (CIPO, 2017). CIPO is a special operating agency of Innovation, Science and Economic Development Canada that delivers intellectual property (IP) services in Canada and educates Canadians on how to use IP more effectively).
This paper will present a profile of Canadian women inventors who patent in Canada, based on a rigorous matching methodology and a comprehensive linked dataset that allows examination of not only patent applications, but also various demographic and business characteristics associated with inventors. Using patent applicationsNote filed at CIPO, this research seeks to answer the following questions: Who are the women inventors in Canada? What are their demographic characteristics? In what types of businesses do they work? How many are entrepreneurs?
This paper will contribute to the field of innovation by using the profiles created to look at the employment trajectories of inventors. For example, are women inventors more likely than men inventors to be business owners? The profiles will also be used to compare women and men inventors in terms of age, immigrant status, geography, size of firm, industry and more.
The structure of this paper is as follows: Section 2 discusses the data and methodology. Section 3 discusses the results, and Section 4 presents conclusions.
Data and methodology
This paper uses data on Canadian-resident inventors associated with patent applications from CIPO, which are linked to the Canadian Employer–Employee Dynamics Database (CEEDD) from 2005 to 2019.Note Note The CEEDD is a matched database between Canadian firms and workers. It links several administrative tax files, including individual tax files (T1 General Income Tax and Benefit Return), unincorporated business owner files (T1 Financial Declaration), individual employment remuneration files (T4 Statement of Remuneration Paid), the Longitudinal Immigration Database (IMDB), Corporation Income Tax Return files (T2), and unincorporated business tax files (T1 Business Declaration) (Grekou et al., 2018). The IMDB is an administrative immigration database for all immigrants since 1952 and non-permanent residents since 1980. With the CEEDD, it is possible to identify the sexNote of an inventor and their age, province of residence and immigrant status. It is also possible to obtain information on the businesses in which they work, such as the size and industry of the business, and the businesses they own. For the latter, two types of businesses are considered. The first type is an unincorporated business, which is a business owned by a self-employed inventor, as determined using the T1 Business Declaration. It can be with or without employees. The second type is an incorporated business, which is a business owned by an inventor who is not self-employed. It is determined based on shares owned in the business from the T2 Schedule 50—that is, it does not depend on the proportion of shares owned, but rather whether the inventor has positive shares in the business. This type of business usually has employees.
The linkage of CIPO inventors to Statistics Canada data holdings was developed using the Social Data Linkage Environment (SDLE). Out of approximately 140,000 records (or inventors), about 95,000 records were linked to the SDLE, representing a linkage rate of 67%. After 2005, the linkage rate for CIPO inventors is slightly higher, ranging from 70% to 75%.Note The European Patent Office also collects information on global patent applications, but because it lacks the addresses of inventors, its database was not used in this study, since linkage rates were low. Patent data used are from the year 2000 onward.
Inventors may be associated with more than one patent application in a given year and vice versa (i.e., a patent may have more than one inventor). In this study, inventors may only appear once in a given year, but they may appear in multiple years if they submitted patent applications in more than one year. The concept of “repeat inventors” is explored in the last section.
Results
This section presents a comparative study of Canadian women and men inventors who have filed patents at CIPO, by considering their immigrant status, age group and province of residence, as well as the size of their firm and industry.Note The question on the employment trajectories of women inventors is also answered by examining the results on the types of businesses owned by inventors. The frequency of inventions over time, by sex, will also be explored in this section.
The majority of inventors are men
On average, the number of men inventors in Canada is higher, compared with that of women inventors. For instance, from 2005 to 2009, there were nine times more men than women inventors. However, the number of women inventors has seen a steady increase over the following three periods: 2005 to 2009, 2010 to 2014 and 2015 to 2019 (Table 1).
| Period | Women | Men | Total | Women | Men |
|---|---|---|---|---|---|
| number of inventors | share (%) | ||||
| 2005 to 2009 | 493 | 4,166 | 4,659 | 10.6 | 89.4 |
| 2010 to 2014 | 498 | 4,294 | 4,792 | 10.4 | 89.6 |
| 2015 to 2019 | 577 | 4,273 | 4,849 | 11.9 | 88.1 |
| Sources: Statistics Canada, Canadian Employer–Employee Dynamics Database (2020 vintage); and Canadian Intellectual Property Office. | |||||
The percent change in the number of inventors between 2005 to 2009 and 2015 to 2019 was higher for women inventors by 14.3 percentage points, compared with men inventors. This was despite women inventors representing a lower share of inventors.
Nonetheless, men inventors accounted for nearly 90% of inventors in all three periods. The period from 2010 to 2014 had the highest average share recorded for men (89.6%). While the share of women inventors edged up slightly over time, they represent about 1 in 10 inventors. This may be partly driven by the underrepresentation of women, compared with men, in science, technology, engineering and mathematics (STEM) occupations. According to the 2021 Census of Population, women made up 23.7% of STEM occupations. However, as elaborated by CIPO (2017), there are additional factors that may be at play that are not explored in this descriptive study.
These findings are consistent with those of CIPO (2017): from 1997 to 2015, the number of women inventors named on PCT applications originating in Canada grew by 377%, while that of men inventors grew by 285%.Note
Immigrant women account for nearly one-half of women inventors
A recent Statistics Canada study found that immigrant-owned firms appear somewhat more likely to implement a product or process innovation (Ostrovsky and Picot, 2020). It also observed that the international evidence suggests that immigrants contribute disproportionately to patent filing, compared with the Canadian-born population, although the results for Canada are somewhat mixed. The authors also noted that university-educated immigrants are twice as likely to be educated in a STEM field and three times as likely to be educated in engineering or computer science as Canadian-born university-educated individuals. This may explain why immigrant-owned firms appear somewhat more likely to implement a product or process innovation.
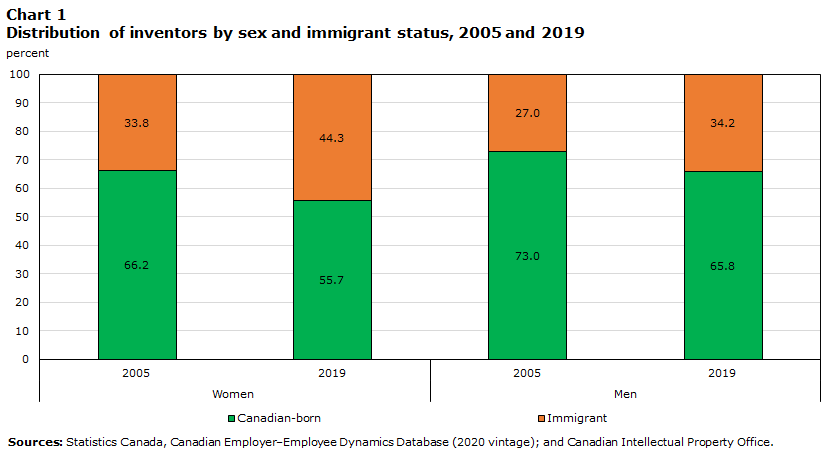
Canadian-born women and men tend to represent a larger share of inventors, compared with immigrants in Canada (Chart 1). Despite being less numerous among inventors, both women and men immigrants have seen a steady rise in representation. Notably, immigrants account for a larger proportion of women inventors, and this proportion increased by 10.5 percentage points, reaching 44.3% in 2019. Similarly, the share of immigrant men who are inventors rose by 7.2 percentage points.
Data table for Chart 1
| Women | Men | |||
|---|---|---|---|---|
| 2005 | 2019 | 2005 | 2019 | |
| percent | ||||
| Canadian-born | 66.2 | 55.7 | 73.0 | 65.8 |
| Immigrant | 33.8 | 44.3 | 27.0 | 34.2 |
| Sources: Statistics Canada, Canadian Employer–Employee Dynamics Database (2020 vintage); and Canadian Intellectual Property Office. | ||||
Using the CEEDD, it is possible to identify the country of origin of inventors. The top three countries that immigrant inventors (women and men) in Canada originate from are China, India and Iran. This has been consistent from 2005 to 2019, although the number of immigrants has changed during this period, with men accounting for a larger share in the number of immigrants from the top three countries.
Women inventors tend to be younger
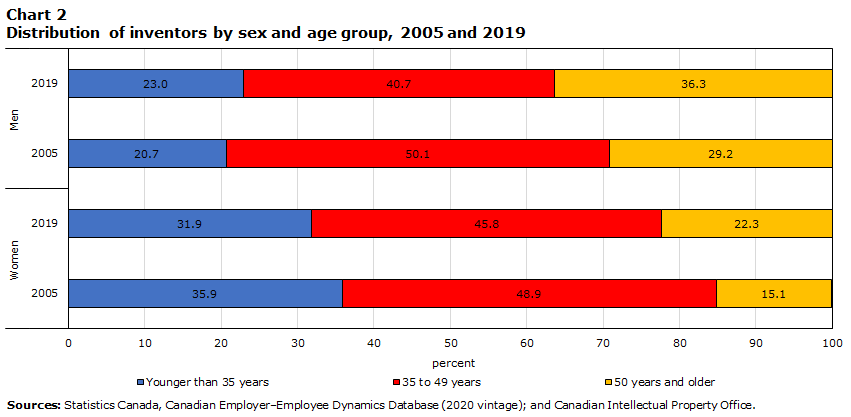
In 2005 and 2019, over 40% of women and men inventors were aged 35 to 49 (Chart 2). The lowest share of women inventors was seen in 2005 (15.1%) in the age group of 50 years and older. By contrast, the lowest for men was seen in 2005 (20.7%) in the age group of younger than 35 years. For women inventors, the proportion in 2019 for the youngest age group was 4.0 percentage points lower than in 2005, while for men inventors, the share in the youngest age group was 2.3 percentage points higher in 2019 than in 2005. However, younger individuals are more present among women inventors. About three-quarters of women inventors are younger than 49, compared with less than two-thirds of men inventors.
Data table for Chart 2
| Women | Men | |||
|---|---|---|---|---|
| 2005 | 2019 | 2005 | 2019 | |
| percent | ||||
| Younger than 35 years | 35.9 | 31.9 | 20.7 | 23.0 |
| 35 to 49 years | 48.9 | 45.8 | 50.1 | 40.7 |
| 50 years and older | 15.1 | 22.3 | 29.2 | 36.3 |
| Sources: Statistics Canada, Canadian Employer–Employee Dynamics Database (2020 vintage); and Canadian Intellectual Property Office. | ||||
Previous studies have typically found that the rate of patenting rises, on average, in the initial decades of work life, then begins to decline at around age 40 (Kaltenberg et al., 2022). The increase in the share of men and women in the older age category may be explained by demographic shifts, whereby older individuals have represented a larger proportion of the population over time.
Alberta has the highest number of men inventors per capita, while Ontario has the most women inventors
Using the population estimates of individuals aged 18 and older (Statistics Canada, 2022),Note Table 2 shows that, on average, over the three periods—2005 to 2009, 2010 to 2014 and 2015 to 2019—Alberta had the highest number of men inventors per capita. By contrast, except for the period from 2015 to 2019, Ontario had the highest number of women inventors on a per capita basis. Over time, the number of inventors per capita decreased for men and women in most provinces and territories. Alberta stands out as the exception, with an increase in inventors in both groups since the period from 2005 to 2009.
| Period | Atlantic provinces | Quebec | Ontario | Manitoba | Saskatchewan | Alberta | British Columbia and territories |
|---|---|---|---|---|---|---|---|
| number per 1 million | |||||||
| Women | |||||||
| 2005 to 2009 | 13.8 | 39.0 | 45.1 | 28.2 | 36.2 | 31.7 | 33.7 |
| 2010 to 2014 | 12.1 | 31.8 | 42.8 | 29.9 | 28.3 | 39.4 | 31.2 |
| 2015 to 2019 | 16.2 | 36.3 | 41.8 | 21.5 | 26.7 | 46.5 | 43.3 |
| Men | |||||||
| 2005 to 2009 | 119.9 | 323.2 | 377.8 | 221.0 | 298.2 | 412.7 | 282.6 |
| 2010 to 2014 | 111.1 | 271.8 | 370.6 | 199.1 | 287.5 | 440.9 | 268.6 |
| 2015 to 2019 | 108.5 | 283.0 | 305.8 | 188.9 | 270.7 | 439.3 | 278.0 |
| Sources: Statistics Canada, Canadian Employer–Employee Dynamics Database (2020 vintage); and Canadian Intellectual Property Office. | |||||||
The highest number of inventors per capita in Alberta was seen from 2010 to 2014, when there were 440.9 men inventors per every 1 million men. By contrast, the lowest number of inventors per capita was seen in the Atlantic provinces, for both men and women. In general, the number of inventors in the Atlantic provinces was less than half those of other provinces and territories.
Women inventors are more likely than men inventors to work in large firms
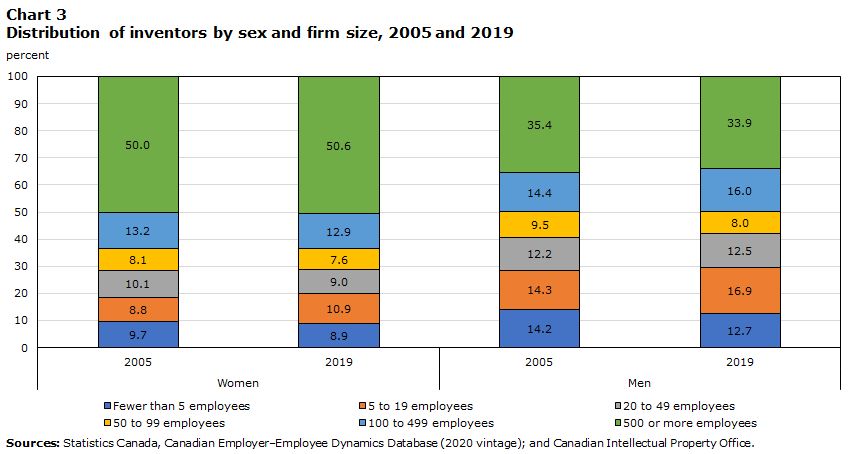
Chart 3 shows the distribution of inventors by sex and firm size in 2005 and 2019. In general, inventors are more concentrated in large firms of 500 or more employees. This is consistent with previous findings, which showed that patenting is more common among large firms (Abbes et al., 2022a). Moreover, women inventors are more present than their male counterparts in large firms—50% of women inventors worked in large firms in 2005 and 2019. For men, the rate was 33.9% in 2019, a decrease of 1.5 percentage points since 2005. Notably, from 2005 to 2019, the distributions of inventors across firm sizes varied little by sex.
While women inventors appear more likely to work in large businesses, a greater share of men inventors is observed in the smallest firms. For instance, in 2019, 29.6% of men inventors worked in firms with fewer than 20 employees, compared with 19.8% of women inventors.
Data table for Chart 3
| Women | Men | |||
|---|---|---|---|---|
| 2005 | 2019 | 2005 | 2019 | |
| percent | ||||
| Fewer than 5 employees | 9.7 | 8.9 | 14.2 | 12.7 |
| 5 to 19 employees | 8.8 | 10.9 | 14.3 | 16.9 |
| 20 to 49 employees | 10.1 | 9.0 | 12.2 | 12.5 |
| 50 to 99 employees | 8.1 | 7.6 | 9.5 | 8.0 |
| 100 to 499 employees | 13.2 | 12.9 | 14.4 | 16.0 |
| 500 or more employees | 50.0 | 50.6 | 35.4 | 33.9 |
| Sources: Statistics Canada, Canadian Employer–Employee Dynamics Database (2020 vintage); and Canadian Intellectual Property Office. | ||||
Women inventors are more likely than men to co-patent
The previous section showed that women inventors are more present in large firms than men inventors. A follow-up question that can be answered with these data is whether women inventors are more likely to submit patent applications with other inventors.Note That is, to what extent do they co-patent?
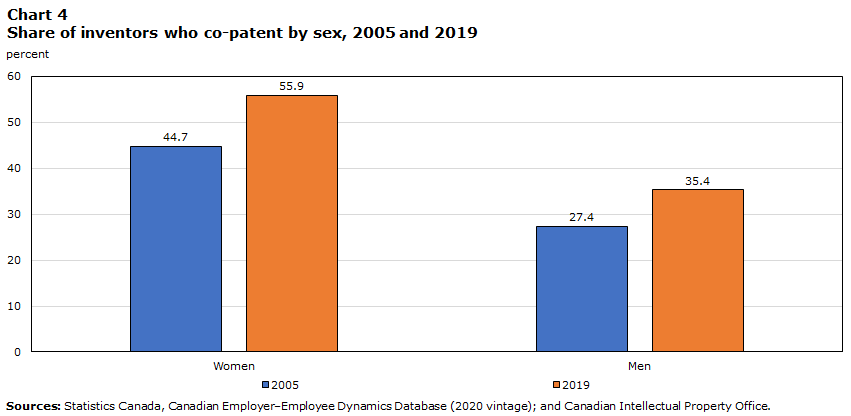
Chart 4 shows that more than 40% of women inventors submitted a patent application with co-inventors. Moreover, the share of women inventors who did so increased by 11.2 percentage points from 2005 to 2019, representing more than half of women inventors. By contrast, 35.4% of men inventors co-patented with other inventors in 2019, up from 27.4% in 2005. The greater share of women inventors who co-patent may be driven by the higher representation of women inventors in larger firms, which may lead to more collaborative opportunities with other inventors. As noted by CIPO (2017), from 2003 to 2015, there was an increase in the average number of inventors per application in Canada, which is consistent with the findings shown here.
Data table for Chart 4
| Women | Men | |
|---|---|---|
| percent | ||
| 2005 | 44.7 | 27.4 |
| 2019 | 55.9 | 35.4 |
| Sources: Statistics Canada, Canadian Employer–Employee Dynamics Database (2020 vintage); and Canadian Intellectual Property Office. | ||
In 2019, one in four women inventors were employed in professional, scientific and technical services and educational services
In 2005, the top two industries that women and men inventors worked in were manufacturing and professional, scientific and technical services, as reflected in charts 5 and 6. In 2019, fewer women inventors worked in manufacturing (12.8%), with educational services becoming the second-largest employer (18.2%). The share of women inventors working in educational services was higher than for men inventors. This may have been related to them working in academia. This is consistent with CIPO (2017), which discussed the share of women inventors in PCT applications who are affiliated with companies and the share who are affiliated with academic institutions.
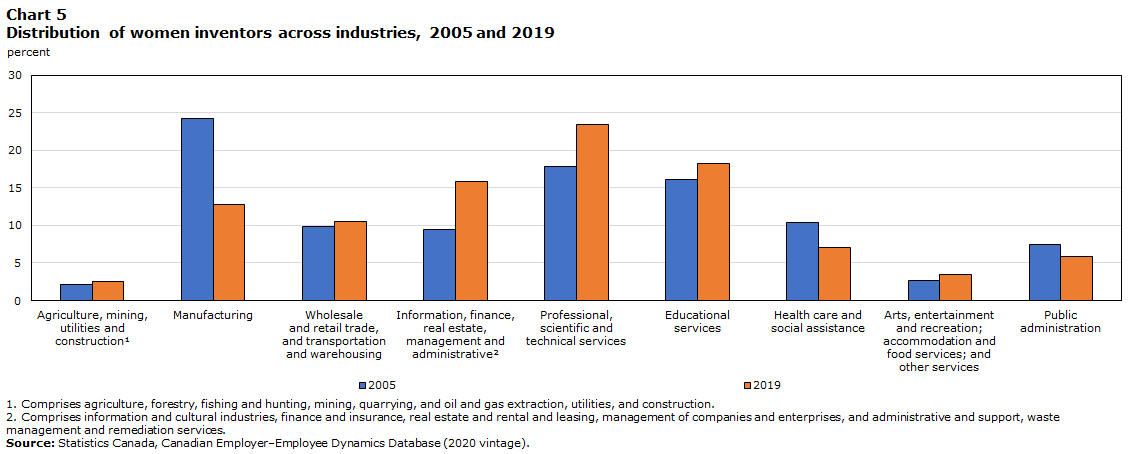
Data table for Chart 5
| 2005 | 2019 | |
|---|---|---|
| percent | ||
| Agriculture, mining, utilities and constructionData table for Chart 5 Note 1 | 2.1 | 2.6 |
| Manufacturing | 24.2 | 12.8 |
| Wholesale and retail trade, and transportation and warehousing | 9.9 | 10.5 |
| Information, finance, real estate, management and administrativeData table for Chart 5 Note 2 | 9.5 | 15.9 |
| Professional, scientific and technical services | 17.8 | 23.5 |
| Educational services | 16.1 | 18.2 |
| Health care and social assistance | 10.4 | 7.1 |
| Arts, entertainment and recreation; accommodation and food services; and other services | 2.7 | 3.5 |
| Public administration | 7.4 | 5.8 |
|
||
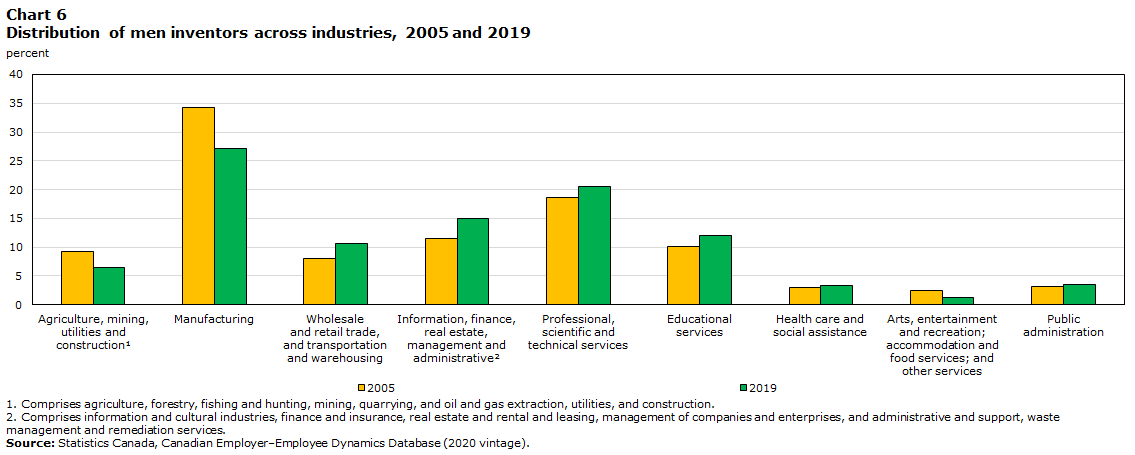
Data table for Chart 6
| 2005 | 2019 | |
|---|---|---|
| percent | ||
| Agriculture, mining, utilities and constructionData table for Chart 6 Note 1 | 9.2 | 6.5 |
| Manufacturing | 34.2 | 27.1 |
| Wholesale and retail trade, and transportation and warehousing | 8.0 | 10.7 |
| Information, finance, real estate, management and administrativeData table for Chart 6 Note 2 | 11.5 | 14.9 |
| Professional, scientific and technical services | 18.7 | 20.5 |
| Educational services | 10.1 | 12.1 |
| Health care and social assistance | 2.9 | 3.4 |
| Arts, entertainment and recreation; accommodation and food services; and other services | 2.4 | 1.3 |
| Public administration | 3.1 | 3.5 |
|
||
Women inventors are more likely to be owners of unincorporated businesses, while men inventors are more likely to be owners of incorporated businesses
Table 3 presents the average shares of inventors who are business owners, based on the total number of inventors. Throughout the three periods of 2005 to 2009, 2010 to 2014 and 2015 to 2019, on average, over 20% of women inventors were owners of unincorporated businesses. By contrast, on average, over 30% of men inventors were owners of incorporated businesses. While not shown in the table, the majority of unincorporated business owners (men and women inventors) did not have employees. By contrast, the majority of incorporated business owners had employees.
| Period | Unincorporated businesses | Incorporated businesses | Total | |||
|---|---|---|---|---|---|---|
| Women | Men | Women | Men | Women | Men | |
| share (%) | ||||||
| 2005 to 2009 | 22.4 | 25.4 | 13.6 | 30.1 | 36.0 | 55.5 |
| 2010 to 2014 | 22.3 | 25.2 | 18.5 | 32.3 | 40.9 | 57.5 |
| 2015 to 2019 | 23.8 | 25.2 | 20.1 | 34.2 | 43.9 | 59.4 |
| Sources: Statistics Canada, Canadian Employer–Employee Dynamics Database (2020 vintage); and Canadian Intellectual Property Office. | ||||||
On average, the total shares of unincorporated and incorporated businesses for both women and men inventors were highest from 2015 to 2019. Nearly 60% of men inventors were business owners in this period, 15.5 percentage points higher than for women inventors.
One-half of women inventors are repeat inventors
In this subsection, the paper analyzes the results obtained from tracking inventors from 2001 to 2019. Of particular interest is whether inventors submit more than one patent over time and whether this varies by sex. Patent grants are not considered here.
The first year of invention observed for the purposes of this analysis is 2001. Inventors (women and men) with only one invention are considered to be one-time inventors. This means that they submitted a patent application in one year only. On the other hand, inventors with more than one invention are repeat inventors. This pertains to the inventors who submitted a patent application in more than one year.
Men inventors are more likely than women inventors to be repeat inventors over time. On average, from 2001 to 2009, 64.9% of men inventors had more than one patent application, compared with 50.0% of women inventors. Both groups experienced a similar decline in the share of repeat inventors from 2010 to 2019, while both also saw growth in the number of one-time inventors.
| Women | Men | |||||
|---|---|---|---|---|---|---|
| 2001 to 2009 | 2010 to 2019 | Change between 2001 to 2009 and 2010 to 2019 | 2001 to 2009 | 2010 to 2019 | Change between 2001 to 2009 and 2010 to 2019 | |
| number | percent | number | percent | |||
| Average number of inventors with only one invention | 246 | 289 | 17.6 | 1,483 | 1,631 | 10.0 |
| Average number of inventors with more than one invention | 246 | 249 | 1.2 | 2,748 | 2,643 | -3.8 |
| Total average number of inventors | 492 | 538 | 9.4 | 4,231 | 4,274 | 1.0 |
| share (%) | ||||||
| Average number of inventors with more than one invention | 50.0 | 46.3 | Note ...: not applicable | 64.9 | 61.8 | Note ...: not applicable |
|
... not applicable Sources: Statistics Canada, Canadian Employer–Employee Dynamics Database (2020 vintage); and Canadian Intellectual Property Office. |
||||||
Conclusion
This paper presented a profile of Canadian women inventors, compared with men inventors, who file patents at CIPO. Similar to findings from an earlier study by CIPO (2017), men inventors outnumbered women. Despite this, the number of women inventors grew at a faster pace than that of their male counterparts from 2005 to 2019.
This paper found important differences between men and women inventors, in terms of their demographic characteristics. Women inventors were more likely to be younger, and a higher proportion of them were immigrants. This paper also found that the employment trajectories of men and women inventors were distinct. Women inventors were more heavily concentrated in large businesses, and a higher proportion worked in professional, scientific and technical services. Moreover, they were more likely than men inventors to co-patent, that is, submit patent applications with other inventors. In addition, women inventors were more likely to be owners of unincorporated businesses, while men inventors were more likely to be owners of incorporated businesses.
Tracking inventors over time provided evidence that women inventors were less likely than men inventors to be repeat inventors. According to Nählinder (2010), men and women end their innovative efforts for different reasons.
Overall, the period from 2010 to 2019 showed a higher total average number of both women and men inventors, compared with the previous period (2001 to 2009).
The foundational work done in this study can lead to other research in the future, such as the factors that may explain differences in invention rates by sex, the role the movement of inventors plays in knowledge diffusion, the agglomeration effects of inventors and the role of diversity in innovation. Moreover, because the study focused on patenting in Canada, extending the analysis to patents abroad may provide a more comprehensive picture of inventors. Extending the measurement of other forms of IP, such as trademarks, may also be explored.
References
Abbes, C., Baldwin, J., & Leung D. (2022a). Patenting activity of Canadian-resident businesses. Economic and Social Reports, March 2022, Statistics Canada Catalogue no. 36-28-0001.
Abbes, C., Baldwin, J., Gibson, R., & Leung D. (2022b). Canadian Patent Research Database. (Analytical studies: methods and references, 2371-3429; no. 043) Statistics Canada.
Abbes, C., Lafrance-Cooke, A., & Leung D. (2023). Patenting activity of women-owned businesses in Canada. Economic and Social Reports, February 2023, Statistics Canada Catalogue no. 36-28-0001.
Acemoglu, D., Bimpikis, K., & Ozdaglar, A. (2011). Experimentation, patents, and innovation. American Economic Journal: Microeconomics, 3(1), 37-77.
Acs, Z. J., Anselin, L., & Varga, A. (2002). Patents and innovation counts as measures of regional production of new knowledge. Research policy, 31(7), 1069-1085.
Blit, J., Skuterud, M., & Zhang, J. (2018). An analysis of the patenting rates of Canada’s ethnic populations. Canadian Public Policy, 44(S1), S125-S145.
Canadian Intellectual Property Office. (2017). Women’s Participation in Patenting: An Analysis of Patent Cooperation Treaty Applications Originating in Canada. Innovation, Science and Economic Development Canada.
Canadian Intellectual Property Office. (2020). IP Canada Report. Innovation, Science and Economic Development Canada.
Corbin, R.M. (2010). Intellectual Property in the 21st Century. Technology and Innovation. Conference Board of Canada. Government of Canada. (2017). Budget 2017.
Grekou, D., Li, J., & Liu, H. (2018). The Measurement of Business Ownership by Gender in the Canadian Employer–Employee Dynamics Database. (Analytical Studies: Methods and References, No. 17) Statistics Canada.
Kaltenberg, M., Jaffe, A.B., & Lachman, M.E. (2022). Invention and the life course: Age differences in patenting. Research Policy. Volume 52, Issue 1.
Martinez, G., Raffo, J., & Saito, K. (2016). Identifying the Gender of PCT Inventors. (Economic Research Working Paper, No. 33) World Intellectual Property Organization.
Moser, P. (2013). Patents and innovation: evidence from economic history. Journal of Economic Perspectives, 27(1), 23-44.
Nählinder, J. (2010). Where are all the female innovators? Nurses as innovators in a public sector innovation project. Journal of technology management & innovation, 5(1), 13-29.
Nikzad, R. (2014). Canadian worldwide patent activity: An industrial level analysis. World Patent Information, 38, 12-18.
Ostrovsky, Y., & Picot, G. (2020). Innovation in Immigrant-owned Firms in Canada. (Analytical Studies Branch Research Paper Series). Statistics Canada.
Schmookler, J. (1957). Inventors past and present. The Review of Economics and Statistics, 321-333.
Statistics Canada. (2022). Table 17-10-0005-01 Population estimates on July 1st, by age and sex (Data table).
Statistics Canada. (2022, November 30). Canada leads the G7 for the most educated workforce, thanks to immigrants, young adults and a strong college sector, but is experiencing significant losses in apprenticeship certificate holders in key trades. The Daily.
- Date modified: