
Analytical Studies: Methods and References
Canadian Patent Research Database
by Chahreddine Abbes, John Baldwin, Robert Gibson and Danny Leung
Skip to text
Text begins
Abstract
This paper documents the use of the Worldwide Patent Statistical Database (PATSTAT), a global patent application database created by the European Patent Office, to create the Canadian Research Patent Database at Statistics Canada. Innovation is an important driver of the economy, and patent statistics are recognized as a useful measure of innovative activity. The current version of the Canadian Research Patent Database focuses on the worldwide patent applications of businesses with an address in Canada (Canada-resident businesses). These data are linked to Statistics Canada’s administrative data holdings to enable studies on describing patenting trends by Canada-resident businesses and the relationship between the input and output of the innovation process and their impact on firm performance.
This paper describes the creation of the Canadian Research Patent Database and presents some basic facts from it. It is found that patent activity, as measured by the number of patent applications, has increased slightly by 0.7% per year over the period from 2001 to 2015. Behind this relative stability, there have been stronger increases in patenting by smaller firms with 0 to 19 employees in a number of service industries, and a decline in patenting activity in large firms with 500 or more employees in the manufacturing sector. Some of the technical areas in which patent activity is growing the most include civil engineering, medical technology, IT methods for management, computer technology, transport, thermal processes and apparatus, and mechanical elements.
1 Introduction
Statistics Canada is committed to integrating public data into its core databases to provide new, more relevant and useful data to the Canadian public. Understanding the nature of a country’s innovation system provides a foundation for the development of policy that supports this activity. Fundamental to this exercise are data on innovation. This paper describes the creation of a new source that can be used for analysis on innovation in Canada. It consists of data generated by linking the European Patent Office (EPO) Worldwide Patent Statistical Database (PATSTAT),Note a database listing patents and their characteristics, to data maintained at Statistics Canada on firm characteristics such as sales, employment, expenditures on research and development (R&D), and intangible capital.
Considered one of the most used forms of intellectual property (IP) rights, patents are defined by the Canadian Intellectual Property Office (CIPO) as rights granted by the government to an inventor, essentially to exclude others from making, using or selling their invention in Canada without authorization. Most economists believe that, by granting a patent, a society is trading short-term exclusive rights to the use of an invention for compensation for more incentives to innovate, made possible through extensive diffusion and an early publication of information about the innovation and its enablement. As clearly explained by Hall (2009), without such a trade-off, fewer innovations would be produced, and most would be kept as secret as possible to avoid misappropriation.
The usefulness of patent statistics as an innovation indicator is discussed by Griliches (1990), the Organisation for Economic Co-operation and Development (OECD, 2009) and Nakaoka et al. (2010). Other data that measure inputs to the innovation process, such as R&D, have also been used extensively for the study of innovation. The two measures are indeed closely related. Scherer (1983) uses line of business data and finds a close relationship between the tendency to patent and R&D expenditures. The connection between R&D and patenting has also been examined at the firm level by Pakes and Griliches (1984), Crepon et al. (1998), and Bound et al. (1984).
Patents are a useful measure of inventive activity because they protect the IP embedded in an invention. Admittedly, not every invention leads to a patent. It must have specific characteristics—novelty, inventive steps and industrial usefulness—to receive a patent. And even when an invention has these characteristics, seeking protection for it via a patent is costly, so other methods may be used instead, or in addition (Arundel, 2001; Cohen et al., 2000; Levin et al., 1987). Despite the plethora of instruments for protection, studies have found that patent-using firms feel they substantially increase the costs of imitation by others (Mansfield, 1986).
Not all inventions are patented because the new product or process may not be easily patentable, but patent intensity measures are nevertheless useful for studies of interindustry differences in innovation intensity—especially if they are used in conjunction with other forms of protection and are therefore closely related to overall innovation intensity. According to the EPO and the European Union Intellectual Property Office (2019), IP-intensive industries are characterized by higher economic performance relative to non-IP-intensive industries, and they are more resilient to shocks and crises.
The construction of a linked file between patent applications and grants, and innovation expenditures, can provide the foundation for an analysis that focuses on the relationship between patenting and other aspects of the innovation process, like R&D expenditures, and the types of innovation with which patents are closely related. It can also be used for studies on differences in the innovation process across firms that differ in size, or by other characteristics, such as R&D intensity or multinational status.
Most studies in this area lack comprehensive databases that link patent data with information on the firms that engage in patenting activity. PATSTAT contains primarily patent data. The National Bureau of Economic Research database (Hall et al., 2002) links patent data to limited firm data. Trajtenberg (2000) makes use of data from the United States on Canadian patent grants but has relatively little information on the nature of the firms.Note
Previous Canadian innovation studies have been heavily dependent on data drawn from surveys of innovation conducted by Statistics Canada (Baldwin and Hanel, 2003; Gault, 2003).Note These surveys were developed to provide information on the extent of innovation because of a dearth of data from other sources, such as patent registers and administrative data on innovation expenditures, including research and development.
The absence of administrative data that provide information on the innovation system has meant that surveys of innovation activity and information on R&D expenditures have been used as the main information source for measures of innovation intensity. The linked patent–intangible capital database that is developed here complements these innovation surveys. It comes from data sources that have more complete industry coverage, have greater continuity over time and offer less expensive alternative data.
While developing a more comprehensive patent–intangible expenditure database potentially expands sources of information on innovation, its usefulness depends to some extent on whether the innovation activity, measured using patents and IP investments, is related to the innovation activity captured by surveys. There are several studies that suggest this is the case in Canada. Using several different Canadian innovation surveys from the 1990s, Baldwin (1997), Baldwin and Hanel (2003), and Hanel (2005) establish the connection between innovation activity and patenting in Canada.Note More recently, data from the Survey on Financing and Growth of Small and Medium Enterprises show that firms with IP rights are more likely to export, and to develop product, marketing, process and organizational innovations.Note
In the next section, the creation of the Canadian Patent Research Database is described. The patent application data from PATSTAT for businesses with an address in Canada are first extracted. This is then combined with data on the characteristics of patenting firms—sales, employment, R&D expenditures—derived from Statistics Canada’s microdata holdings. The following sections then provide results from the Canadian Patent Research Database that illustrate its usefulness.
2 Creation of the Canadian Patent Research Database
The main data source for the Canadian Patent Research Database is PATSTAT, a product created by the EPO with patent data from IP offices around the world.Note Included are data from CIPO, the United States Patent and Trademark Office (USPTO), the EPO, the World Intellectual Property Organization (WIPO), the Japan Patent Office, and many other industrialized and developing countries. The database contains a range of information on patent applications, such as the application authority (CIPO, USPTO, EPO, WIPO, etc.), filing date, whether the application is granted, the technological nature of the patent, whether the patent belongs to a patent family, the size of the patent family to which the application belongs, whether the patent application was made under the Paris Convention, the number and identity of applicants, the number and identity of inventors, the country of residence of each applicant and inventor, the sector to which the applicants and inventors belong (individuals, companies, governmental and non-governmental organizations such as universities and hospitals), the application type (e.g., patent, utility model, design patent), and the number of forward citations.
Given the wealth of information available in PATSTAT, there are many interesting questions that could be addressed. The OECD (2009) discusses a number of topics that could be investigated using patent data, including the technological performance of countries or companies, emerging technologies, the diffusion of knowledge, the geography of invention, networks of inventors, the value of inventions, the performance and mobility of researchers, the role of universities in technological development, the globalization of innovative activities, and patenting strategies by companies.
The number of patent applications contained in PATSTAT provides a measure of innovative activity, since an application is a direct measure of a firm’s or inventor’s engagement in activities that created a new and important innovation, warranting an application for the protection of the IP embedded within it (Brydon et al., 2014).
The number of grants reveals whether applicants chose to pursue the application to the grant stage, and whether the granting authority assessed the invention as truly new and useful. Not all applications receive a grant, either because the innovation does not meet the standards required for approval, or because the applicant chooses not to proceed to the final stage in the approval process. For example, an applicant may file a patent application to provide evidence of due diligence as a new product is being brought to market and capital sources are being sought.Note
The patent database identifies both applicants and inventors. Applicants are the owners of the invention, often the firm that employs the inventor. But an individual who invents a new product may not be associated with any firm and may be listed as both applicant and inventor. An analysis of the overlap between these categories reveals whether inventions come to various patent authorities with potential financial backing that is greater than what the inventor possesses (because a company is involved), or whether inventions are dependent on just the inventor or another individual for financial support.
The patent database also contains the correspondence addresses of both the applicants and inventors. These can be used to assess the inventiveness of the innovation systems of different countries—whether firms within a country are applying for IP protection for inventive activity and where. An application to one country does not automatically result in the patent being recognized in other countries. Mapping the geography of inventors to applications also allows for an assessment of the extent to which inventive activity requires multiple innovators from multiple countries. At the same time, comparing applicant countries of origin can determine the extent to which any particular country (i.e., Canada) potentially benefits from inventive activity from both domestic and foreign sources, and pinpoints which of those foreign sources is the most important. Comparing countries where firms choose to file applications provides a map of the potential foreign markets of those firms (either via exports or direct production) and allows for studies on the internationalization of inventive activity. Examining whether there is a single applicant or multiple applicants reveals how often inventive activity requires collaboration across firms.
The patent files contain dates of application that allow linkage to economic activity variables for the same or similar periods, such as firm size and R&D expenditures, to analyze the relationship between the results of innovative activity and inputs into the process, e.g., size of R&D expenditures.
The wealth of information available in PATSTAT will be processed and used in stages to create the Canadian Patent Research Database. The first stage will focus on the applications of Canada-resident businesses; the trends in those applications; and the relationship between them, R&D and firm performance. To do this, PATSTAT data are linked to Statistics Canada administrative data holdings on firms. The Canadian Patent Research Database will be expanded and the documentation updated after other areas of research are tackled.
Figure 1 describes how relevant data are extracted from PATSTAT. Applications that involve a Canada-resident applicant or inventor, and all applications to CIPO, are extracted from the database. A Canada-resident entity is defined as an entity (individual, company, university, etc.) with an address in Canada on the application. From this subset of data, the focus will initially be on applications from Canada-resident businesses. Whether an applicant is an individual, business, etc. is indicated in the patent data. An application can have more than one applicant, and there can be multiple businesses on the application. The aim is not to examine trends in applications, including duplicates, by counting applications multiple times when there is more than one applicant. Only the first Canadian business on a single application is linked to other Statistics Canada sources.

Description for Figure 1
The title of the figure is European Patent Office Worldwide Patent Statistical Database and the Canadian Patent Research Database. The purpose of figure is to illustrate how information from the European Patent Office Worldwide Patent Statistical Database was used to create the Canadian Patent Research Database.
At the top part of the figure is a large oval shape labelled European Patent Office Worldwide Patent Statistical Database. This large oval represents the entirety of the information found in the database. Within this large oval shape is a smaller oval shape labelled applications by Canadian residents and applications by non-residents to the Canadian Intellectual Property Office (CIPO).
Three arrows pointing downward emanate from the smaller oval. These arrows point to three rectangles located below and outside of the large oval. The rectangle on the left is labelled other applications by individuals, governments and other entities residing in Canada. The rectangle in the middle is labelled applications involving at least one Canada-resident business. The rectangle on the right is labelled applications to CIPO by non-residents.
Under the middle rectangle is an arrow pointing down to another rectangle below this middle rectangle. This rectangle is labelled applications by the first Canada-resident business that appears on the application form. Inside this rectangle is a list of the variables that are included in this set of applications. The variables are: application ID; year of application; application authority; technology sector and fields; patent granted (for all except WIPO); patent family ID; Paris Convention flag; other patent characteristics; firm ID and firm profile (e.g., size, industry).
Under this rectangle with the list of variables is another arrow pointing down towards another rectangle. This final rectangle at the bottom of the page is labelled firm-level patent data. It shows the list of firm-level variables derived from the patent application-level variables above. This firm-level variable list includes: number of applications; number of applications by application authority; number of inventions; number of patent grants.
Although the 2018 version of PATSTAT is the data source, only data from 2001 to 2015 are considered. While data up to 2018 are available, they are not complete. There is an 18-month period from when an application is made to when a patent is published, during which the application is confidential. It also takes time for the EPO to collect information from patent offices around the world. Design patents that protect only the esthetic characteristics of an object, utility model patents that have a shorter lifespan (6 to 10 years, rather than 20 years for a standard patent), and provisional patents at the USPTO that allow applicants to claim a filing date are excluded. Translated applications are also retained. While it is possible to file for a patent through the EPO in one of three languages (English, French and German) and have it granted for all member countries, the applicant must still have it validated at a national office for it to be effective. This validation may require translation and the payment of additional fees. A translated application is considered a separate application, as it is necessary to obtain protection in that particular country. Applications to WIPO under the Paris Convention are also retained. These allow a single application as a first step to obtaining patent grants in countries that have signed the Paris Convention. WIPO does not grant patents, but provides an international search report and written opinion on patentability. Once this stage is complete, the application is transferred to various regional and national offices for assessment. By applying to WIPO, the search stage at each regional and national office can be avoided. When the WIPO application is transferred to another office, it generates an application at that office, which is also captured by PATSTAT and included in the Canadian Patent Research Database.
The patent applications are linked by name and address to Statistics Canada’s administrative data holdings, including the Business Register (to obtain the industry of the business), T2 Corporation Income Tax Return (to obtain firm financial information), T4 Statement of Remuneration Paid (to obtain payroll information), and PD7 payroll deductions (to obtain employment). The linkage rate by application authority is shown in Table 1. From 2001 to 2015, Canada-resident businesses made roughly 165,000 patent applications. Of these applications, 93.7% are linked to Statistics Canada data on firm performance. The linkage rate is equally good for each application authority, at 95.4% for applications made to CIPO, 96.1% to the USPTO, 91.3% to the EPO, 92.0% to other national patent offices, and 91.0% to WIPO. The linkage rates fluctuate between 91% and 96%, but this variation has little impact on the time series of patent applications. Chart 1 shows that the time series of all and linked patent applications move in tandem. The use of the linked data to break down trends observed in all applications is informative.
| All | Canadian Intellectual Property Office | United States Patent and Trademark Office | European Patent Office | Offices other than CIPO, the USPTO and the EPO | World Intellectual Property Organization | |
|---|---|---|---|---|---|---|
| percent | ||||||
| Linkage rate | 93.7 | 95.4 | 96.1 | 91.3 | 92 | 91 |
|
Notes: CIPO is the Canadian Intellectual Property Office; USPTO is the United States Patent and Trademark Office; EPO is the European Patent Office. Source: Statistics Canada, Canadian Patent Research Database. |
||||||

Data table for Chart 1
| All | Linked | |
|---|---|---|
| number of applications | ||
| 2001 | 9,588 | 8,700 |
| 2002 | 10,197 | 9,289 |
| 2003 | 10,560 | 9,688 |
| 2004 | 10,496 | 9,821 |
| 2005 | 11,489 | 10,798 |
| 2006 | 11,744 | 11,227 |
| 2007 | 12,164 | 11,566 |
| 2008 | 11,227 | 10,819 |
| 2009 | 10,341 | 9,979 |
| 2010 | 11,442 | 10,950 |
| 2011 | 11,566 | 10,960 |
| 2012 | 10,924 | 10,051 |
| 2013 | 11,117 | 10,133 |
| 2014 | 11,495 | 10,614 |
| 2015 | 10,514 | 9,912 |
| Source: Statistics Canada, Canadian Patent Research Database. | ||
3 Patent applications by application authority and firm characteristics
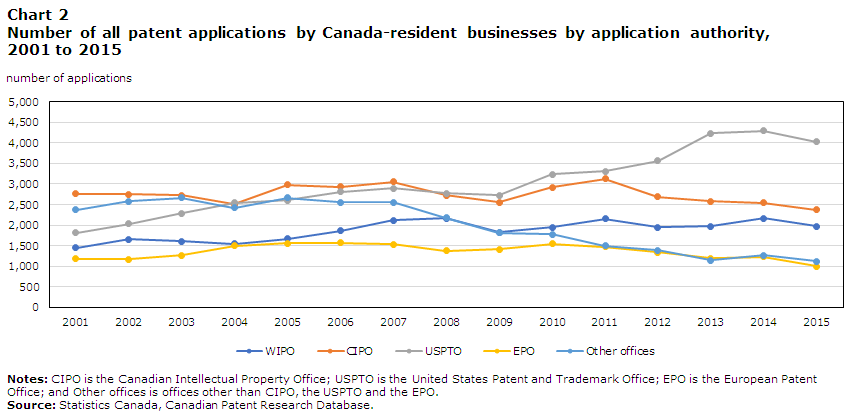
Overall, the number of patent applications made by Canada-resident businesses is relatively stable over time, rising from 9,600 in 2001 to 10,500 in 2015. This stability hides changes by application authority. Chart 2 shows that applications made to the USPTO have risen over time, and strongly since 2009. From 2001 to 2009, the number of applications to the USPTO rose by 900, while from 2009 to 2015, it rose by 1,300. By contrast, applications to CIPO, the EPO and all other patent offices have fallen. The largest decline was in the other application authorities, where applications fell by 1,250 over the entire period.
Data table for Chart 2
| WIPO | CIPO | USPTO | EPO | Other offices | |
|---|---|---|---|---|---|
| number of applications | |||||
| 2001 | 1,451 | 2,757 | 1,817 | 1,185 | 2,378 |
| 2002 | 1,656 | 2,751 | 2,034 | 1,174 | 2,582 |
| 2003 | 1,605 | 2,726 | 2,288 | 1,271 | 2,670 |
| 2004 | 1,541 | 2,502 | 2,540 | 1,496 | 2,417 |
| 2005 | 1,670 | 2,985 | 2,607 | 1,557 | 2,670 |
| 2006 | 1,862 | 2,937 | 2,811 | 1,576 | 2,558 |
| 2007 | 2,115 | 3,057 | 2,897 | 1,539 | 2,556 |
| 2008 | 2,168 | 2,724 | 2,777 | 1,376 | 2,182 |
| 2009 | 1,832 | 2,552 | 2,727 | 1,418 | 1,812 |
| 2010 | 1,953 | 2,917 | 3,237 | 1,552 | 1,783 |
| 2011 | 2,156 | 3,133 | 3,308 | 1,475 | 1,494 |
| 2012 | 1,943 | 2,685 | 3,566 | 1,342 | 1,388 |
| 2013 | 1,977 | 2,576 | 4,228 | 1,190 | 1,146 |
| 2014 | 2,164 | 2,538 | 4,297 | 1,230 | 1,266 |
| 2015 | 1,977 | 2,377 | 4,032 | 1,004 | 1,124 |
|
Notes: WIPO stands for the World Intellectual Property Organization. CIPO stands for the Canadian Intellectual Property Office. USPTO stands for the United States Patent and Trademark Office. EPO stands for the European Patent Office. Other offices are offices other than CIPO, the USPTO and the EPO. Source: Statistics Canada, Canadian Patent Research Database. |
|||||
Applications to WIPO rose by around 500 applications over the period. This indicates that Canada-resident businesses intended to submit applications in more than one country. WIPO applications can be considered at national or regional patent offices once the international or search phase has been completed. Increasingly, this method is being used to obtain patents in the United States. In 2005, 16% of WIPO applications by Canada-resident businesses that transitioned to a regional or national office went to the USPTO, 31% went to CIPO, 25% went to the EPO and 29% went to other patent offices. In 2015, 33% went to the USPTO, 27% went to CIPO, 20% went to the EPO and 21% went to other offices. Patent applications made by Canada-resident businesses directly to the USPTO also rose, by 56%, over the period from 2001 to 2015.
The linkage of the PATSTAT database to Statistics Canada’s administrative data holdings permits the examination of these trends in patent applications by firm-level characteristics, such as employment size of firm and industry. Table 2 compares the shares of patent applications in 2001 by employment size of firm (0 to 19 employees, 20 to 99 employees, 100 to 499 employees and 500 or more employees) with their shares in the change in patent applications from 2001 to 2015. The comparison shows whether a particular firm size category has contributed disproportionately to the overall change. This analysis excludes applications to WIPO, as these also appear in data from other patent offices when applications are transferred to various regional or national offices.
| Applications in 2001 | Applications in 2015 | Change in applications from 2001 to 2015 | ||||||||||||
|---|---|---|---|---|---|---|---|---|---|---|---|---|---|---|
| CIPO | USPTO | EPO | Other | Total | CIPO | USPTO | EPO | Other | Total | CIPO | USPTO | EPO | Other | |
| number | ||||||||||||||
| Total | 2,757 | 1,817 | 1,185 | 2,378 | 8,137 | 2,377 | 4,032 | 1,004 | 1,124 | 8,537 | -380 | 2,215 | -181 | -1,254 |
| percent | ||||||||||||||
| Employment size of firm | ||||||||||||||
| 0 to 19 | 25.8 | 23.0 | 24.4 | 25.9 | 25.4 | 38.5 | 38.0 | 38.3 | 38.0 | 37.7 | -55.9 | 50.1 | -56.4 | 13.1 |
| 20 to 99 | 18.6 | 13.8 | 15.6 | 18.4 | 17.5 | 17.6 | 19.2 | 13.1 | 19.4 | 17.4 | 25.1 | 23.6 | 30.1 | 17.4 |
| 100 to 499 | 15.1 | 14.3 | 15.7 | 16.0 | 15.1 | 10.0 | 14.2 | 12.2 | 12.3 | 12.0 | 47.3 | 14.1 | 35.6 | 19.9 |
| 500 or more | 40.6 | 48.9 | 44.4 | 39.7 | 42.0 | 33.8 | 28.6 | 36.4 | 30.3 | 33.0 | 83.6 | 12.2 | 90.8 | 49.6 |
| Total | 100.0 | 100.0 | 100.0 | 100.0 | 100.0 | 100.0 | 100.0 | 100.0 | 100.0 | 100.0 | 100.0 | 100.0 | 100.0 | 100.0 |
| Industry | ||||||||||||||
| Unclassified | 10.1 | 11.5 | 9.5 | 14.2 | 11.0 | 7.4 | 5.9 | 6.5 | 3.2 | 6.3 | 27.4 | 1.4 | 26.4 | 25.9 |
| Other goods industries | 2.0 | 0.9 | 2.2 | 2.0 | 1.8 | 3.1 | 2.2 | 1.7 | 1.4 | 2.2 | -4.9 | 3.3 | 4.9 | 2.7 |
| Mining, oil and gas | 7.3 | 1.4 | 1.1 | 2.3 | 3.5 | 9.9 | 2.8 | 1.4 | 2.7 | 8.3 | -8.9 | 3.9 | -0.6 | 1.9 |
| Manufacturing | 50.3 | 58.3 | 55.2 | 50.0 | 52.0 | 36.7 | 30.7 | 37.7 | 38.5 | 33.1 | 137.2 | 8.4 | 157.1 | 62.3 |
| Trade | 3.5 | 3.6 | 4.0 | 5.1 | 4.0 | 9.1 | 9.9 | 6.5 | 6.2 | 8.1 | -32.0 | 15.1 | -11.0 | 4.1 |
| Professional, scientific and technical services | 17.9 | 16.4 | 19.5 | 17.8 | 19.0 | 18.3 | 24.3 | 23.0 | 32.1 | 23.2 | 15.3 | 30.7 | -0.6 | 2.8 |
| Other service industries | 8.9 | 7.9 | 8.6 | 8.4 | 8.6 | 15.6 | 24.2 | 23.2 | 15.9 | 18.8 | -34.0 | 37.3 | -76.1 | 0.5 |
| Total | 100.0 | 100.0 | 100.0 | 100.0 | 100.0 | 100.0 | 100.0 | 100.0 | 100.0 | 100.0 | 100.0 | 100.0 | 100.0 | 100.0 |
|
Notes: CIPO is the Canadian Intellectual Property Office; USPTO is the United States Patent and Trademark Office; EPO is the European Patent Office; and Other offices is offices other than CIPO, the USPTO and the EPO. Source: Statistics Canada, Canadian Patent Research Database. |
||||||||||||||
In 2001, the largest firms with 500 or more employees accounted for the largest share of patent applications at 42.0% (Table 2). Firms with 0 to 19 employees accounted for 25.4%, firms with 20 to 99 employees accounted for 17.5% and mid-sized firms with 100 to 499 employees accounted for 15.1%. The distributions for each patent office are similar. The largest firms with 500 or more employees contributed the highest share of patent application at the USPTO (at 48.9%), CIPO (at 40.6%), EPO (at 44.4%) and at other offices (at 39.7%).
Chart 2 showed an increase in patent applications at the USPTO and decreases at other patent offices (CIPO, EPO and other offices). When these categories are combined, there is a slight increase. Table 2 suggest that increase in applications at the USPTO between 2001 and 2015 is mainly due to firms with 0 to 19 employees. These firms account for 50.1% of the increase, despite only accounting for 23.0% of patents applications at the USPTO in 2001. Firms with 20 to 99 employees also contribute disproportionately to the increase. They account for 23.6% of the increase, but only 13.8% of applications. Mid-sized firms with 100 to 499 employees account proportionately to the increase, while the largest firms with 500 or more employees only account for 12.2% of the increase in applications, despite account for 48.9% of applications in 2001.
Similar results are found for other patent offices. At CIPO and EPO, patent applications increase between 2001 and 2015 for firms with 0 to 19 employees, despite the overall declines in these offices. Firms with 500 or more employees accounted for 83.6% of the decline in applications at CIPO and 90.8% of the decline in applications at EPO. The results for other patent offices are less skewed. The smallest firms with 0 to 19 employees contribute less to the decline between 2001 and 2015 (13.1%) than their share in patent applications in 2001 (25.9%), and the largest firms with 500 or more contribute disproportionately to the increase (49.6% compared to their share of patent applications of 39.7% in 2001).
Similar analysis can be conducted by industry.Note The results are shown in Table 2. In 2001, the manufacturing industry accounted for 52.0% of all patent applications. Professional, scientific, and technical services contributed the next largest proportion at 19.0%. Again, the distributions by industry as similar across patent offices. The bottom half of Table 3 shows that the manufacturing industry contributed only a small amount (8.4%) to the increase in patent application between 2001 and 2015 at the USPTO, especially compared to its 58.3% share in applications in 2001. The increase in patent applications at the USPTO is concentrated in other service industries, trade (wholesale and retail trade combined), and professional, scientific and technical services. Although other service industries (finance and insurance, real estate and rental and leasing, management of companies and enterprises, administrative support, waste management and remediation, educational services, health care and social assistance, arts, entertainment and recreation, accommodation and food services and other services) accounted for only 7.9% of applications in 2001, it accounted for 37.3% of the increase. Trade accounted for only 3.6% of applications in 2001, but 15.1% of the increase. Professional, scientific and technical services accounted for 16.4% of patent applications in 2001, but 30.7% of the increase.
| Share of patent applications in 2001 | Percentage change in patent applications from 2001 to 2015 | Change in patent applications from 2001 to 2015 | |
|---|---|---|---|
| percent | number | ||
| Chemistry | 23.0 | -10.7 | -200 |
| Electrical engineering | 36.4 | -14.2 | -419 |
| Instruments | 13.0 | 8.4 | 89 |
| Mechanical engineering | 19.1 | 31.9 | 494 |
| Other fields | 8.5 | 54.8 | 380 |
| Source: Statistics Canada, Canadian Patent Research Database. | |||
Findings for the USPTO are mirrored at CIPO, the EPO and other patent offices—the manufacturing industry accounted for all or a disproportionate share of the decline in those offices; applications in trade and other service industries to CIPO and the EPO increased over time; and professional, scientific and technical services contributed less to the declines in each office than their share of patent applications in 2001.
In summary, the linkage of PATSTAT to firm-level data at Statistics Canada shows that behind the modest increase in patent applications overall and the increase in applications to the USPTO are strong increases in patent applications by firms with 0 to 19 employees in other service industries; trade; and professional, scientific and technical services. Slowdowns and declines in patenting among large firms in the manufacturing industry are also behind this.
4 Patent applications by technology field
Patent data can also provide insight about the technological areas relevant to Canadian businesses. Patent applications are classified into areas using a taxonomy created by the International Patent Classification (IPC) system. An invention is classified based on a subjective evaluation of its nature by a patent examiner, and its accuracy depends on the expertise of the examiner. The Canadian Patent Research Database includes two variables from PATSTAT on the classification of patent IPC codes by WIPO. A variable classifies patents into 5 technological sectors (chemistry, electrical engineering, instruments, mechanical engineering and other fields), and a technological field variable further disaggregates the sectors into 35 different fields. A patent can belong to more than one field, so a weight is also included (e.g., a patent application might indicate that an invention is 50% in the digital communications field and 50% in the computer technology field).
Table 3 shows that in 2001, Canada-resident businesses mostly filed patent applications in the electrical engineering sectorNote (36.4%), followed by chemistryNote (23.0%), mechanical engineeringNote (19.1%) and the other fields sectorNote (8.5%). From 2001 to 2015, the number of applications in the two top areas declined, and that in other fields and mechanical engineering increased.
Table 4 presents more detail on the areas that Canada-resident businesses have focused on increasingly. It identifies the top five areas, based on the largest increases in weighted patent counts in level and percentage terms from 2001 to 2015.Note Based on the change in counts, the top five growing fields are civil engineering, medical technology, IT methods for management, computer technology and transport. Based on the percentage change in counts, the top five fields are IT methods for management, thermal processes and apparatus, civil engineering, medical technology, and mechanical elements. More details on these fields can be found in a report by Schmoch (2008). Civil engineering refers to the construction of buildings and roads, and some mining infrastructure. Medical technology includes high-tech diagnostic and surgical equipment, while the IT methods for management field includes data processing software for administrative, commercial, financial, managerial or forecasting purposes. Computer technology includes electrical digital processing, such as image processing and speech recognition, but excludes IT methods for management. Transport includes all types of transport technology, such as automobiles, rail and air, while the thermal processes and apparatus field includes elements related to steam generation, combustion, heating, cooling or heat exchange. The mechanical elements field includes fluid-circuit elements, joints, shafts, couplings, valves, pipeline systems or mechanical control devices.
| Change in patent applications | Growth in patent applications | |
|---|---|---|
| number | percent | |
| Top five based on largest increase in number of applications | ||
| Civil engineering | 317 | 78.5 |
| Medical technology | 198 | 71.5 |
| IT methods for management | 153 | 123.9 |
| Computer technology | 139 | 24.4 |
| Transport | 127 | 35.3 |
| Top five based on highest percentage change | ||
| IT methods for management | 153 | 123.9 |
| Thermal processes and apparatus | 72 | 97.9 |
| Civil engineering | 317 | 78.5 |
| Medical technology | 198 | 71.5 |
| Mechanical elements | 114 | 68.2 |
| Bottom five based on largest decline in number of applications | ||
| Basic communications processes | -102 | -77.8 |
| Digital communications | -160 | -18.6 |
| Optics | -203 | -73.4 |
| Pharmaceuticals | -218 | -37.5 |
| Telecommunications | -417 | -69.1 |
| Bottom five based on lowest percentage change | ||
| Macromoleular chemistry, polymers | -53 | -46.6 |
| Analysis of biological materials | -61 | -62.8 |
| Telecommunications | -471 | -69.1 |
| Optics | -203 | -73.4 |
| Basic communications processes | -102 | -77.8 |
| Other fields of interest | ||
| Environmental technology | 28 | 22.6 |
| Biotechnology | -11 | -5.1 |
| Source: Statistics Canada, Canadian Patent Research Database. | ||
Table 4 also shows where patent applications have declined the most, in terms of level and percentage. Based on the largest declines in the number of applications, the bottom five areas are telecommunications, pharmaceuticals, optics, digital communications, and basic communications processes. Based on the largest percentage declines, the bottom five areas are basic communications processes, optics, telecommunications, analysis of biological materials, and macromolecular chemistry and polymers.
Finally, Table 4 also includes the changes for two fields of interest—environmental technology and biotechnology. The number of patent applications in environmental technology by Canada-resident businesses has been increasing, but the increase in applications per year (+28) is small, relative to the top five. Biotechnology is often cited as an area where innovation is strong in Canada.Note In 2015, 213 patent applications were made by Canada-resident businesses in this field, 18th of the 35 technological fields in the field ranking that year. From 2001 to 2015, the number of applications per year has declined slightly, by 11 applications.
Table 5 provides some insights into whether the development of these fields is being driven by smaller or larger firms. It presents the size distribution of firms filing patent applications over are from the 100 to 499 employee size category, and 4.4% are from the 500 or more employee size category. Firms filing for patents are disproportionately from the largest size category. Excluding firms with no employees, Innovation, Science and Economic Development Canada (2020) shows that in 2019, 97.9% of businesses are in the 1 to 99 employee category and only 0.2% are in the 500 or more employee category. In all of the fasting growing technology fields, there is strong participation by firms with 500 or more employees. In each of these fields, firms with more than 500 employees are disproportionately represented compared to the overall size distribution of firms filing patent applications for the entire 2001 to 2015 time period. Firms with 0 to 19 employees play a disproportionate role only in medical technology field.
| 0 to 19 employees | 20 to 99 employees | 100 to 499 employees | 500 or more employees | |
|---|---|---|---|---|
| percent | ||||
| All fields | 68.1 | 19.5 | 8.0 | 4.4 |
| Civil engineering | 59.5 | 22.6 | 10.9 | 7.0 |
| Medical technology | 71.7 | 16.8 | 6.3 | 5.2 |
| IT methods for management | 68.2 | 18.1 | 6.3 | 7.3 |
| Computer technology | 65.2 | 21.7 | 7.2 | 5.9 |
| Transport | 55.4 | 23.0 | 11.5 | 10.2 |
| Thermal processes and apparatus | 57.2 | 19.9 | 11.4 | 11.5 |
| Mechanical elements | 53.0 | 21.8 | 13.4 | 11.8 |
| Source: Statistics Canada, Canadian Patent Research Database. | ||||
5 Patent grants
Not all applicants are successful in obtaining a grant—either because the innovative idea does not meet the requirements of originality and usefulness, or because the applicant chooses not to pursue the application to the grant stage. The Canadian Patent Research Database retains information on whether an application has been granted. Grants can be tabulated in the PATSTAT database by the year an application was filed, but not by the year a grant was obtained.
From 2001 to 2011,Note the grant rate (rate at which an application was made during this period) was 59.4% for all offices except WIPO.Note The grant rate for Canada-resident businesses applying to CIPO over the same period was 52.3%. By contrast, the rate was higher for applications made to the USPTO (82.2%), lower for those made to the EPO (42.7%), and roughly the same for those made to other patent offices (52.9%). Chart 3 also shows differences in grant rate trends by application authority. Grant rates have fallen over time for the USPTO, the EPO and other offices, while they have increased slightly for CIPO. Grant rates for all offices (except WIPO) have also declined over time.

Data table for Chart 3
| CIPO | USPTO | EPO | Other offices | |
|---|---|---|---|---|
| percent | ||||
| 2001 | 45 | 98 | 49 | 60 |
| 2002 | 47 | 94 | 54 | 63 |
| 2003 | 47 | 91 | 53 | 60 |
| 2004 | 50 | 90 | 49 | 61 |
| 2005 | 54 | 83 | 46 | 54 |
| 2006 | 54 | 79 | 44 | 46 |
| 2007 | 57 | 73 | 40 | 48 |
| 2008 | 59 | 75 | 41 | 51 |
| 2009 | 56 | 77 | 36 | 49 |
| 2010 | 57 | 74 | 33 | 49 |
| 2011 | 49 | 70 | 26 | 39 |
|
Notes: CIPO stands for the Canadian Intellectual Property Office. USPTO stands for the United States Patent and Trademark Office. EPO stands for the European Patent Office. Other offices are offices other than CIPO, the USPTO and the EPO. Source: Statistics Canada, Canadian Patent Research Database. |
||||
The Canadian Patent Research Database can be used to investigate some of the possible causes for the decline in grant rates. Here, the role of firm size is explored. Chart 4 shows the grant rates for all patent applications (except those to WIPO) by firm size category. Larger firms with 100 or more employees have consistently shown higher success rates at converting patent applications into patent grants. The grant rate for firms with 500 or more employees is 64.1% and that for firms with 100 to 499 employees is 62.4%. By comparison, the grant rate for firms with 0 to 19 employees is 53.6% and that for firms with 20 to 99 employees is 56.0%. All firm sizes showed a decline in grant rates. Firms with 20 to 99 employees exhibited the smallest decline, of 1.6 percentage points. All other groups experienced a decline of about 12 percentage points.

Data table for Chart 4
| 0 to 19 employees | 20 to 99 employees | 100 to 499 employees | 500 or more employees | |
|---|---|---|---|---|
| percent | ||||
| 2001 | 59 | 53 | 67 | 65 |
| 2002 | 62 | 59 | 66 | 67 |
| 2003 | 61 | 57 | 65 | 66 |
| 2004 | 58 | 57 | 63 | 71 |
| 2005 | 50 | 55 | 62 | 69 |
| 2006 | 48 | 56 | 62 | 64 |
| 2007 | 49 | 54 | 57 | 64 |
| 2008 | 52 | 55 | 64 | 64 |
| 2009 | 51 | 58 | 62 | 61 |
| 2010 | 52 | 59 | 63 | 59 |
| 2011 | 47 | 52 | 55 | 54 |
| Source: Statistics Canada, Canadian Patent Research Database. | ||||
6 Patent applications and research and development
The introduction of this paper highlighted the importance of patent data in the study of the innovation process and its outcomes on the economic performance of firms. Patent applications are an indicator of inventions that may lead to performance-improving innovations for firms. They are not a perfect indicator because firms may not choose to protect inventions with a patent for various reasons. R&D is another indicator of innovative activity. It too is imperfect, as a company may perform R&D without claiming related expenditures on its tax returns, and R&D activity may not be successful at leading to an invention. Therefore, it is useful to have a set of indicators that can be used to gauge the extent of activities in the innovation process. Table 6 underlines the complementarity between patent applications and R&D expenditures.Note It shows that 49.7% of firms that filed for a patent application also had R&D expenditures. Firms with 19 employees or fewer had the lowest incidence of such expenditures, at 39.9%, and firms in the larger size categories had a similar incidence, ranging from 65.7% to 71.9%. Not all firms that make patent applications also have R&D expenditures.
| Percent | |
|---|---|
| 0 to 19 employees | 39.9 |
| 20 to 99 employees | 71.9 |
| 100 to 499 employees | 71.5 |
| 500 or more employees | 65.7 |
| All firms | 49.7 |
| Source: Statistics Canada, Canadian Patent Research Database. | |
7 Conclusion
This paper reports on the newly developed Canadian Patent Research Database created by linking the worldwide patent activities of businesses with an address in Canada from PATSTAT to Statistics Canada’s administrative data holdings on firms (data on sales, employment and R&D expenditures). This database provides useful insight into the innovation process because of the close connection between the number of patents taken out and measures of innovation intensity in the Canadian economy.
It is shown that patent activity by Canada-resident businesses, as measured by the number of patent applications, has increased by 0.7% per year from 2001 to 2015. This small increase hides larger changes by firm size and industry. There have been strong increases in patenting by smaller firms with 0 to 19 employees in a number of service industries, and a decline in patenting activity in large firms with 500 or more employees in the manufacturing sector. There is also substantial heterogeneity across technical fields. Patenting in civil engineering, medical technology, IT methods for management, computer technology, transport, thermal processes and apparatus, and mechanical elements has grown the most. Meanwhile, declines in patenting activity by Canada-resident businesses have been the greatest in telecommunications, pharmaceuticals, optics, digital communications, basic communications processes, analysis of biological material, and macromolecular chemistry and polymers.
This document will be updated as the Canadian Research Patent Database is expanded to enable more areas of study.
References
Arundel, A. (2001). The relative effectiveness of patents and secrecy for appropriation. Research Policy, 30(4), 611–624.
Baldwin, J. R. (1997). Innovation and intellectual property. Statistics Canada.
Baldwin, J. R., & Hanel, P. (2003). Innovation and knowledge creation in an open economy. Cambridge University Press.
Bound, J., Cummins, C., Griliches, Z., Hall, B. H., & Jaffe, A. (1984). Who does R&D and who patents. In Z. Griliches (Ed.), R&D patents and productivity. University of Chicago Press for the NBER. Brydon, R., Chesterley, N., & Dachis, B. (2014). Measuring innovation in Canada: The tale told by patent applications (E-Brief). C.D. Howe Institute.
Cohen, W., Nelson, R., & Welsh, J. (2000). Protecting their intellectual assets: Appropriability conditions and why manufacturers patent (or not) (NBER Working Paper Series, No. 7552). National Bureau of Economic Research.
Crepon, B., Duguet, E., & Mairesse, J. (1998). Research, innovation and productivity: An econometric analysis at the firm level. Economics of Innovation and New Technology, 7(2), 115–158.
De Melto, D., McMullen, K., & Wills, R. (1980). Preliminary report: Innovation and technical change in five Canadian industries (Discussion Paper No. 176). Economic Council of Canada.
European Patent Office & European Union Intellectual Property Office. (2019). Intellectual property rights intensive industries and economic performance in the European Union. Industry-level Analysis Report, September 2019, third edition.
Gault, F. (Ed.). (2003). Understanding innovation in Canadian industry. McGill-Queen’s University Press.
Graham, S., Grim, G., Islam, T., Marco, A., & Miranda, J. (2015). Business dynamics of innovating firms: Linking U.S. patent data with administrative data on workers and firms. Center for Economic Studies.
Griliches, Z. (1990). Patent statistics and economic indicators. Journal of Economic Literature, (28), 1661–1707.
Hall, B. (2009). Open innovation and intellectual property rights: The two-edged sword. https://eml.berkeley.edu/~bhhall/papers/BHH09_IPR_openinnovation.pdf
Hall, B., Jaffe, A., & Trajtenberg, M. (2002). The NBER Patent Citations Data File: Lessons, insights and methodological tools. In A. Jaffe & M. Trajtenberg (Eds.), Patents, citations and innovations (pp. 403–460). The MIT Press.
Hanel, P. (2005). Current intellectual property protection practices in manufacturing firms in Canada. In Putnam (Ed.), Intellectual property and innovation in the knowledge-based economy (pp. 2.1–2.56). Industry Canada.
Innovation, Science and Economic Development Canada. (2020). Key small business statistics-2020. Innovation Science and Economic Development Canada. https://www.ic.gc.ca/eic/site/061.nsf/vwapj/KSBS_2020-v2-ENG.pdf/$FILE/KSBS_2020-v2-ENG.pdf
Kerr, W., & Fu, S. (2008). The Survey of Industrial R&D—Patent Database Link Project. The Journal of Technology Transfer, 33(2), 176–186.
Levin, R., Klevorick, A., Nelson, R., & Winter, S. (1987). Appropriating the returns from industrial research and development. Brookings Papers on Economic Activity, (3), 783–820.
Lybbert, T., & Zolas, N. (2014). Getting patents and economic data to speak to each other: An “Algorithmic Links with Probabilities” approach joint analyses of patenting and economic activity. Research Policy, 43(3), 530–542.
Patents and innovation: An empirical study. Management Science, 32(2), 173–181.
Nakaoka, S., Motohashi, K., & Goto, A. (2010). Patent statistics as an innovation indicator. In Handbook of the economics of innovation, Volume 2 (pp. 1083–1127). Elsevier.
Organisation for Economic Co-operation and Development. (2009). OECD patent statistics manual. OECD Publishing.
Pakes, A., & Griliches, Z. (1984). Patents and R&D at the firm level: A first look. In Z. Griliches (Ed.), Research and development, patents and productivity (pp. 55–72). The University of Chicago Press.
Scherer, F. (1983). The propensity to patent. International Journal of Industrial Organization, 1(1), 107–128.
Schmoch, U. (2008). Concept of a technological classification for country comparisons: Final report to the World Intellectual Property Organization. https://www.wipo.int/export/sites/www/ipstats/en/statistics/patents/pdf/wipo_ipc_technology.pdf
Statistics Canada. (2014). Survey on Financing and Growth of Small and Medium Enterprises. https://www23.statcan.gc.ca/imdb/p2SV.pl?Function=getSurvey&SDDS=2941
Trajtenberg, M. (2000). Is Canada missing the technological boat? Evidence from the patent data (Discussion Paper No. 9). Industry Canada.
- Date modified: