
Analytical Studies: Methods and References
The Measurement of Business Ownership by Gender in the Canadian Employer–Employee Dynamics Database

Archived Content
Information identified as archived is provided for reference, research or recordkeeping purposes. It is not subject to the Government of Canada Web Standards and has not been altered or updated since it was archived. Please "contact us" to request a format other than those available.
by Douwere Grekou, Jiang Li and Huju Liu
Economic Analysis Division
Skip to text
Text begins
Acknowledgements
The authors would like to thank Danny Leung, Samuel Howorth, Sharanjit Uppal and Christian Tassé of Statistics Canada and Tamara Hudon of Status of Women Canada, as well as seminar participants at Statistics Canada for helpful comments and suggestions.
Abstract
Understanding women’s business ownership and the performance of women-owned enterprises is important for designing policies to promote gender equality in leadership, economic empowerment of women and inclusive growth. However, evidence on business ownership by gender remains scarce because of the lack of comprehensive data. The study, Women-owned Enterprises in Canada (Grekou, Li and Liu, 2018), fills the data gap by identifying business ownership by gender using a newly developed administrative dataset—the Canadian Employer–Employee Dynamics Database (CEEDD). The dataset contains business owner information for all unincorporated enterprises and private corporations in Canada. This paper discusses the methodology adopted to establish the gender structure of business ownership. It then presents estimates of business ownership by gender (men or women majority ownership and equal ownership). Finally, it analyzes the sensitivity of these estimates and compares them with those calculated using other data sources.
1 Introduction
Business ownership or entrepreneurship has long been argued to be an important driver for innovation, job creation and productivity growth. New businesses bring new ideas and products, create new jobs and increase competition. They also drive out less productive businesses in the market and thereby increase overall productivity. Entrepreneurs are regarded as risk takers, innovators, and coordinators of factors of production. They are an underlying force of “creative destruction” (Knight 1921; Schumpeter 1942).
However, a considerable gender difference exists in business ownership: men dominate business ownership. According to the Survey on Financing and Growth of Small and Medium Enterprises (SFGSME), the proportion of women-owned small and medium enterprises (SMEs) was lower than that of men-owned (15.7% versus 64.6%) in 2014. Many studies also find that women-owned enterprises lag men-owned enterprises in business performance such as sales, profits and employment (Fairlie and Robb 2009; Coleman and Robb 2012; Industry Canada 2015; Rosa and Sylla 2016).
Promoting women’s business ownership and improving the performance of women-owned firms not only fosters innovation and competitiveness, but it also fosters gender equality in leadership and the economic empowerment of women. Such interventions are a central component of the Gender Initiative for stronger, better and fairer growth of the Organisation for Economic Co-operation and Development’s (OECD) (Adema et al. 2014).
The lack of comprehensive data on women’s business ownership presents challenges in the development of policies to promote gender diversity in business ownership. In Canada, until now, the Labour Force Survey (LFS) has been the primary source of information for identifying the self-employed by gender for both unincorporated and incorporated businesses. However, it provides little information on these businesses. The SFGSME is the only source that provides information on both business owners and businesses, with a focus on SMEs in certain industries.Note 1 The small number of firms surveyed prevents comprehensive studies of women-owned business at a more detailed level, such as by province or territory, industry and size simultaneously.Note 2 Furthermore, neither the LFS nor the SFGSME is longitudinal in design. This makes tracking gender changes in ownership over time difficult.
This paper serves as a technical guide and reference for the study Women-owned Enterprises in Canada (Grekou, Li and Liu, 2018). The work underpinning this study fills these gaps by identifying business ownership by gender, using a large-scale linked administrative dataset—the Canadian Employer–Employee Dynamics Database (CEEDD). The CEEDD is a matched database between workers and firms, covering all individual and corporate tax filers since 2001. The Business Owner Module—derived from the CEEDD—covers business owners of all private corporations and unincorporated businesses in Canada.Note 3 These business owners are linked to individual tax files (T1) for their demographic information (i.e., age, gender, immigrant status) and to business tax records for their business characteristics. Both workers and firms can also be tracked over time in the CEEDD. The large number of observations, the multifaceted information and the longitudinal nature of the CEEDD enable comprehensive studies on women’s business ownership and the performance of women-owned enterprises.
The rest of the paper is organized as follows. Section 2 describes the CEEDD and its Business Owner Module. Section 3 details the methodology adopted in the paper to identify business ownership by gender using the CEEDD. Section 4 presents main estimates of business ownership by gender and sensitivity analysis. Section 5 concludes the analysis.
2 The Canadian Employer–Employee Dynamics Database and its Business Owner Module
This section first describes the CEEDD and its Business Owner Module. It then assesses the scope of the Business Owner Module by comparing it with the National Accounts Longitudinal Microdata File (NALMF).
2.1 The Canadian Employer–Employee Dynamics Database and its Business Owner Module
The CEEDD is a matched database between Canadian firms and workers. It links several administrative tax files including:
- individual tax files (T1 General – Income Tax and Benefit Return)
- unincorporated business owner files (T1 Financial Declaration, or T1FD)
- individual employment remuneration files (T4, Statement of Remuneration Paid)
- Longitudinal Immigration Database (IMDB)
- Corporation Income Tax Return (T2)
- unincorporated business tax files (T1 Business Declaration, or T1BD).
At the present time, the CEEDD covers the universe of individual and corporate tax filers in Canada, from 2001 to 2013. Three main modules can be developed using the CEEDD: the Paid Employee Module, the Business Module and the Business Owner Module. The Paid Employee Module consists of the demographics of paid workers and the characteristics of the businesses where they work.Note 4 The Business Module consists of information on each business, including information on the composition of the business’s workforce.Note 5
The Business Owner Module consists of information on all business owners—incorporated and unincorporated—and their owned businesses. Corporate business owners are defined as shareholders of private corporations. In Canada, all private corporations (non-publicly traded)—Canadian-controlled or other—are required to file a Schedule 50 (Shareholder Information) as part of their Corporation Income Tax Return (T2).Note 6Note 7 Three sets of information are available from this schedule: type of shareholders (i.e., company, individual and income trust), type of share (i.e., common or preferred) and percentage of shares owned by shareholder.Note 8 Individual shareholders are then linked to individual tax files (T1) for their demographic information and to corporate tax files (T2) for information on their owned businesses.
Unincorporated business owners are identified from T1FDs. T1FDs are a collection of all financial declarations filed by individuals who report any sort of self-employment income including business, professional, commission, farming, fishing and rental income. A financial declaration consists of an individual’s name, contact information, social insurance number (SIN), business number (BN), business name and address, industry classification and other business-related financial variables. The financial declarations file is supplemented by the Statement of Partnership Income (Form T5013) to identify limited partnerships and partnerships. All financial declaration records are then aggregated up to the business level to form the T1BD. Therefore, the T1BD contains one record for each unincorporated business for the current reference year.
The linkage between T1FD and individual tax files (T1) through SINs thus provides demographic information for unincorporated owners, while the linkage between T1FD and T1BD files through a unique business identifier (BI) provides business-related information.
Administrative records on incorporated business owners and their businesses are available from 2001, whereas tax records on unincorporated businesses are available only from 2005. As such, the Business Owner Module is available for 2005 onward for both unincorporated and incorporated businesses. Moreover, the businesses included in the Module resemble SMEs because publicly traded corporations do not file a Schedule 50.
In summary, the CEEDD Business Owner Module (CEEDD-BOM) offers several advantages over other data sources such as the SFGSME and LFS. Unlike the SFGSME, the Module enables longitudinal analysis on business and business ownership; both business owners and their businesses are followed through time with consistent identifiers established in administrative records. In addition to demographic information on business owners—similar to what the LFS offers—the Module consists of information on their owned businesses such as sales, revenue and employment. Moreover, it includes all unincorporated self-employed individuals who report any sort of self-employment income, as well as shareholders of privately controlled corporations. The significantly expanded coverage of businesses provides a more complete picture of business ownership in various dimensions such as province or territory, industry and firm size.
2.2 A comparison with the National Accounts Longitudinal Microdata File
To assess the scope of businesses covered by the CEEDD-BOM, this subsection compares the Module with the NALMF.Note 9 The NALMF is an administrative databank created by joining several Canada Revenue Agency (CRA) tax data files:
- Corporation Income Tax Return (T2)
- Payroll Account Deductions (PD7A)
- Statement of Remuneration Paid (T4)
- Goods and services tax/harmonized sales tax (GST/HST).
The target population of the NALMF consists of all enterprises that file a T2, PD7A, or T4. Hence, the NALMF covers both privately owned and publicly traded corporations, and unincorporated enterprises with employees. Unincorporated enterprises with no employees are excluded from NALMF. In contrast, the target population of the CEEDD-BOM consists of all privately owned corporations and unincorporated businesses.
With respect to number of enterprises with employment, the NALMF is more comprehensive than the CEEDD-BOM. The NALMF essentially covers all employment in the business sector, as it includes publicly traded corporations with employees, privately owned corporations with employees, and unincorporated enterprises with employees. On the other hand, the CEEDD-BOM includes only the latter two types of employers. The comparison of the NALMF and the CEEDD-BOM below basically gives the percentage of business sector employment covered by the CEEDD-BOM.
With respect to the number of enterprises, neither file is more comprehensive. The NALMF excludes unincorporated enterprises with no employees (essentially self-employed workersNote 10), but it includes publicly traded corporations. The CEEDD-BOM includes the former, but excludes the latter. Given the number of unincorporated enterprises without employees is larger than the number of publicly traded corporations, the number of enterprises in the CEEDD-BOM is larger than that in the NALMF.
Table 1-1 summarizes the comparison between the two sources for number of enterprises, number of enterprises with employment and the associated employment. From 2005 to 2013, the NALMF included on average over 2.3 million enterprises (Column 1).Note 11 About one-half of them (1.2 million) are employer enterprises (Column 2). These employer enterprises employ roughly 16.0 million workers each year (Column 3).Note 12 Each enterprise hires on average approximately 14 workers (Column 4). In comparison, the CEEDD-BOM covers over 5.1 million enterprises. About one-sixth of them, or 858,000 enterprises, employ 7.8 million workers each year on average (Columns 5 to 7). The fraction of enterprises with employment is much smaller in the CEEDD-BOM than in the NALMF. This occurs, as explained earlier, because the former also includes unincorporated businesses that do not hire any employees (mostly self-employed individuals).
Table 1-2 focuses on enterprises from the CEEDD-BOM that can also be found in the NALMF. The CEEDD-BOM–NALMF linkage includes 1.7 million enterprises overall and 858,000 enterprises with employment each year (Columns 8 and 9). They account for 71.8% of all enterprises and 74.2% of enterprises with employment in the NALMF (Columns 12 and 13). These enterprises hire 7.8 million employees, accounting for nearly one-half of the employment in the NALMF business sector (Columns 10 and 14). The average size of enterprise—measured by number of workers per enterprise—is 9 workers in the CEEDD-BOM–NALMF linkage (Column 11), which is smaller than the 14 workers in the NALMF.
In summary, the CEEDD-BOM covers a significant portion on the number of employer enterprises and the number of employees in the business sector. Ownership information is available for roughly 74% of employer enterprises, and these employer enterprises account for approximately 49% of employment. The employer enterprises for which ownership information is not available in the CEEDD-BOM are the publicly traded corporations.Note 13
| NALMF | CEEDD-BOM | ||||||
|---|---|---|---|---|---|---|---|
| Number of enterprises | Number of enterprises with employment | Total employment | Average number of employees per enterprise with employment | Number of enterprises | Number of enterprises with employment | Total employment | |
| Column 1 | Column 2 | Column 3 | Column 4 | Column 5 | Column 6 | Column 7 | |
| number | |||||||
| 2005 | 2,104,500 | 1,070,300 | 15,411,100 | 14.4 | 4,732,900 | 776,200 | 7,486,300 |
| 2006 | 2,174,100 | 1,096,100 | 15,768,100 | 14.4 | 4,825,000 | 804,700 | 7,760,000 |
| 2007 | 2,249,500 | 1,129,900 | 16,077,000 | 14.2 | 4,934,500 | 833,500 | 7,848,000 |
| 2008 | 2,321,100 | 1,150,900 | 16,225,700 | 14.1 | 5,076,300 | 857,000 | 7,933,700 |
| 2009 | 2,356,700 | 1,159,100 | 15,928,500 | 13.7 | 5,106,200 | 865,900 | 7,842,800 |
| 2010 | 2,409,100 | 1,175,300 | 16,062,700 | 13.7 | 5,169,000 | 879,900 | 7,879,300 |
| 2011 | 2,452,200 | 1,191,800 | 16,315,500 | 13.7 | 5,338,700 | 896,700 | 7,847,900 |
| 2012 | 2,485,700 | 1,207,800 | 16,419,100 | 13.6 | 5,425,300 | 897,600 | 7,828,400 |
| 2013 | 2,504,000 | 1,219,000 | 16,543,600 | 13.6 | 5,604,500 | 909,500 | 8,046,300 |
| Average | 2,339,600 | 1,155,600 | 16,083,500 | 13.9 | 5,134,700 | 857,900 | 7,830,300 |
|
Note: Column 4 is derived by dividing Column 3 by Column 2. Sources: Statistics Canada, Canadian Employer–Employee Dynamics Database Business Owner Module (CEEDD-BOM) and National Accounts Longitudinal Microdata File (NALMF). |
|||||||
| CEEDD-BOM linked to the NALMF | |||||||
|---|---|---|---|---|---|---|---|
| Number of enterprises | Number of enterprises with employment | Total employment | Average number of employees per enterprise with employment | Share of NALMF enterprises | Share of NALMF enterprises with employment | Share of NALMF employment | |
| Column 8 | Column 9 | Column 10 | Column 11 | Column 12 | Column 13 | Column 14 | |
| number | percent | ||||||
| 2005 | 1,473,500 | 776,200 | 7,486,300 | 9.6 | 70.0 | 72.5 | 48.6 |
| 2006 | 1,541,200 | 804,700 | 7,760,000 | 9.6 | 70.9 | 73.4 | 49.2 |
| 2007 | 1,609,100 | 833,500 | 7,848,000 | 9.4 | 71.5 | 73.8 | 48.8 |
| 2008 | 1,669,200 | 857,000 | 7,933,700 | 9.3 | 71.9 | 74.5 | 48.9 |
| 2009 | 1,704,400 | 865,900 | 7,842,800 | 9.1 | 72.3 | 74.7 | 49.2 |
| 2010 | 1,745,100 | 879,900 | 7,879,300 | 9.0 | 72.4 | 74.9 | 49.1 |
| 2011 | 1,777,100 | 896,700 | 7,847,900 | 8.8 | 72.5 | 75.2 | 48.1 |
| 2012 | 1,759,800 | 897,600 | 7,828,400 | 8.7 | 70.8 | 74.3 | 47.7 |
| 2013 | 1,847,700 | 909,500 | 8,046,300 | 8.8 | 73.8 | 74.6 | 48.6 |
| Average | 1,680,800 | 857,900 | 7,830,300 | 9.1 | 71.8 | 74.2 | 48.7 |
|
Note: Column 11 is derived by dividing Column 10 by Column 9; Column 12, by dividing Column 8 by Column 1 (Table 1-1); Column 13, by dividing Column 9 by Column 2 (Table 1-1); and Column 14, by dividing Column 10 by Column 3 (Table 1-1). Sources: Statistics Canada, Canadian Employer–Employee Dynamics Database Business Ownwer Module (CEEDD-BOM) and National Accounts Longitudinal Microdata File (NALMF). |
|||||||
3 Methodology
This section details the steps taken to define business ownership by gender. A business can be men-owned, women-owned or equally owned. A business is men-owned when the share owned by one or more men owners is greater than or equal to 51%. Similarly, a business is women-owned when the share of women owners is 51% or more. When men and women owners each own 50%, the enterprise is defined as equally owned. To build ownership structure by gender in the CEEDD, three general steps are taken sequentially: derive ownership share, aggregate business ownership to the enterprise level, and identify gender dominance.
3.1 The measurement of ownership share in the Canadian Employer–Employee Dynamics Database
The CEEDD is maintained at the BI level for unincorporated businesses and at the BN level for corporations. For an unincorporated business, a BI is created by Statistics Canada to identify businesses with any sort of self-employment income.Note 14 For an incorporated business, a BN is a 15-digit number assigned by the CRA. A business requires a BN in order to hire employees, engage in import or export activities, and remit GST/HST. Not all businesses have a BN.
For private corporations, the ownership share is derived from the shares reported in Schedule 50 of their Corporation Income Tax Return (T2). Several factors need to be considered to ensure ownership share is clearly defined at the BN level.
First, the measurement of ownership share differs between businesses with a single share type (either common or preferred shares) and two share types (both common and preferred shares). In Schedule 50, only the percentages of common shares and preferred shares are reported. Most businesses only have one share type, so the ownership shares can be taken directly from Schedule 50. In the case of businesses with two share types, the average of the two ownership shares is used to create a single measure of ownership share for each shareholder.Note 15
Second, ownership share is reported on a fiscal-year basis and needs to be converted to a calendar-year basis to be consistent with other tax-based files.Note 16 As part of a T2, a Schedule 50 is reported every fiscal year. To convert ownership share to a calendar-year basis, each reported ownership share is first prorated according to the number of days in the calendar year covered by each reported fiscal period. These weighted shares are then aggregated to the corresponding calendar year from multiple fiscal-year records.Note 17
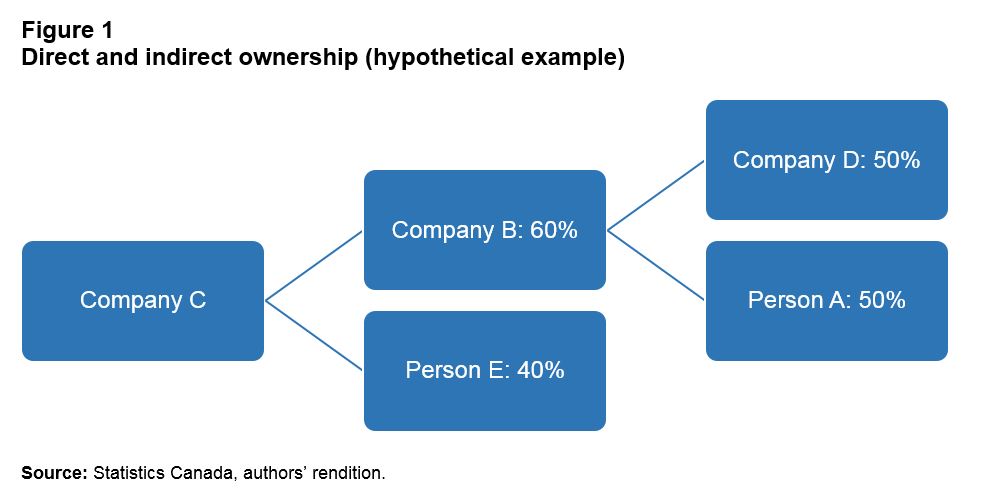
Third, both direct and indirect ownership need to be considered. Schedule 50 provides information on direct ownership only. It is possible that a person has an ownership stake in a company through another company. For example, Person A owns Company B, which in turn owns Company C. This makes Person A an indirect owner of Company C. To take indirect ownership into account, direct ownership is traced backwards, and the total ownership share is calculated as by multiplying the direct ownership shares. Figure 1 shows a hypothetical example of direct and indirect ownership. Person A owns 50% of Company B. At the same time, Company B owns 60% of Company C. As a result, Person A directly owns 50% of Company B and indirectly owns 30% (50% multiplied by 60%) of Company C. In comparison, Person E is a direct owner of Company C with a 40% share.
Description for Figure 1
The title of figure 1 is “Direct and indirect ownership (hypothetical example).”
This figure is a diagram that describes a hypothetical example of direct and indirect ownership. In the example, Company C has two owners: Company B with 60% of share and Person E with 40% of share. Company B also has two owners: Company D with 50% of share and Person A with 50%. As a result, Person A directly owns 50% of Company B and indirectly owns 30% (50% multiplied by 60%) of Company C.
The source of the figure is “Statistics Canada, authors’ rendition.”
For unincorporated businesses, the information to calculate ownership share is found in the T1FD, T1BD and Form T5013, Statement of Partnership Income. The information for larger, more complex partnerships (e.g., partnerships with more than five partnerships, partnerships over a certain revenue or asset size, and partnerships that have a corporation or another partnership as a partner) come from Form T5013. Smaller partnerships and sole proprietorships are covered in the T1FD and T1BD. Where information on partnership shares exists, it is used as the ownership share. When that information does not exist, the ownership share is imputed and set equal to each owner’s share of net income within the business. If net income is missing, the ownership share is assumed to be equal among all owners.
3.2 The aggregation of ownership shares to the enterprise level
As noted, ownership share in the CEEDD is derived at the BI level for unincorporated businesses and at the BN level for corporations. Neither of these identifiers correspond to a statistical unit, or unit of measurement, used at Statistics Canada. They can, however, be aggregated to the enterprise level. An enterprise is a unit which directs and controls the allocation of resources and which produces a complete set of financial statements.
For incorporated businesses, the enterprise structure is well defined with a clear concordance between BNs and enterprises. For simple enterprises with a single BN, the ownership information at the enterprise level is the same as that at the BN level. For complex enterprises with multiple BNs, the ownership shares at the enterprise level are weighted average of those at the BN level. The weights are derived using the total assets of all businesses within the same enterprise. In the case of missing total assets, all the businesses within the same enterprise are assigned equal weights.Note 18
In contrast, the enterprise structure for unincorporated businesses that are partnerships is difficult to establish for two reasons. First, unlike private corporations, many partnerships do not have BNs or enterprise identifiers. This is the primary reason Statistics Canada creates BIs. Second, multiple identifiers may exist for certain records, such as the BI, BN, parent operating entity number and partnership account number. This makes establishing the business hierarchy complex.Note 19
The following strategy is adopted to sort through different scenarios and to group BIs into entities that approximate an enterprise. Note that the concept of unincorporated enterprises used in this paper is experimental in nature.
Scenario 1: When a partnership account number exists (i.e., for larger, more complex partnerships that have filed a Form T5013), the partnership is considered an enterprise.
Scenario 2: If the business has no partnership account number but a parent operating entity number exists, the parent operating entity is considered an enterprise.
Scenario 3: If neither a partnership nor a parent operating entity exists but a BN exists, the BN is considered an enterprise.
Scenario 4: If neither a partnership, parent operating entity nor a BN identifier is available, then the BI is considered an enterprise. This scenario also includes a particular case where sometimes a BN may exist. However, the BI is used as the “enterprise” identifier if the BN can be linked to the corporations in the NALMF. The reason is that the concepts of unincorporated business and corporation are mutually exclusive. If an unincorporated business shares its BN with a corporation, then the corporation is presumably entitled to the BN.
Table 2 presents the number of enterprises and their corresponding 2013 share in each of these scenarios. Enterprises defined by a parent operating entity accounts form the largest share—over three-quarters of all unincorporated businesses in 2013—followed by enterprises defined by a BI with 19.4%. The relative size of each scenario remains unchanged even though their shares fluctuate from year to year.
| Enterprises | Share | |
|---|---|---|
| number | percent | |
| Scenario 1: Partnership as enterprise | 48,600 | 1.2 |
| Scenario 2: Parent operating entity as enterprise | 3,109,500 | 79.3 |
| Scenario 3: Business number as enterprise | 2,300 | 0.1 |
| Scenario 4: Business identifier as enterprise | 760,300 | 19.4 |
| Total | 3,920,700 | 100.0 |
| Source: Statistics Canada, Canadian Employer–Employee Dynamics Database (CEEDD). | ||
Once the unincorporated enterprise structure is established, the ownership information is aggregated to the enterprise level from the BI level. Revenue is used to set weights because asset information is not reported by unincorporated businesses.
3.3 The identification of ownership by gender
After the ownership share is aggregated to the enterprise level, the dominant gender is determined by the gender with the highest share. That is, when the total share owned by men is greater than or equal to 51%, the enterprise is defined as men-owned, and when the total share owned by women is greater than or equal to 51%, the enterprise is defined as women-owned. When men and women each own 50%, the enterprise is equally owned.
Assigning majority ownership or equal ownership is straightforward if ownership shares add up to 100% within an enterprise. However, this is not the case for every enterprise in the Business Owner Module. For example, only the shareholders with at least 10% of the shares of a private corporation are reported in Schedule 50. As well, shareholders’ information is misfiled or missing from time to time.
Consider the five hypothetical examples in Table 3, wherein the ownership shares do not add up to 100%. Although less than 100% of shares are identified, the gender of ownership can be determined in scenarios 1 and 2 because either men or women own at least 51% of shares. In contrast, the gender of ownership cannot be determined in scenarios 3 and 4 since neither men nor women own at least 51% of shares. Similarly, the gender structure in scenario 5 cannot be determined even though the enterprise appears to be equally owned by men and women among the identified shares. It is unclear whether the remaining 30% of shares are be controlled by solely men or women owners or be equally split between them.
| Scenario | |||||
|---|---|---|---|---|---|
| 1 | 2 | 3 | 4 | 5 | |
| Men-owned shares (number) | 55 | 10 | 50 | 40 | 35 |
| Women-owned shares (number) | 10 | 80 | 45 | 50 | 35 |
| Total identified shares (number) | 65 | 90 | 95 | 90 | 70 |
| Gender of ownership | Male-owned | Female-owned | Unclassified | Unclassified | Unclassified |
| Source: Statistics Canada, authors' compilation. | |||||
To build a well-defined ownership structure by gender, the paper includes only businesses wherein either 100% of shares can be identified or gender dominance (a gender owing at least 51%) can be determined. This is referred to as the benchmark sample.
To assess the sample’s coverage, Table 4 compares the benchmark sample to the NALMF. On average over the examined period, 1.5 million businesses in the benchmark sample can be found in the NALMF. Enterprises with employment total an average of 798,000, accounting for 5.7 million employees. Compared with the NALMF (Table 1-1), the benchmark sample represents about 65.8% of all NALMF enterprises, 69.1% of enterprise with employment and 35.2% of employment in the NALMF. A comparison with Columns 12 to 14 in Table 1-2 suggests that the benchmark sample excludes businesses that tend to be larger; the ownership structure is likely to be more complex in larger firms than in smaller ones.
| CEEDD-BOM benchmark sample linked to the NALMF business sector | |||||||
|---|---|---|---|---|---|---|---|
| Number of enterprises | Number of enterprises with employment | Total employment | Average number of employees per enterprise with employment | As share of the NALMF business sector | |||
| Number of enterprises | Number of enterprises with employment | Total employment | |||||
| number | percent | ||||||
| 2005 | 1,351,000 | 723,000 | 5,374,500 | 7.4 | 64.2 | 67.6 | 34.9 |
| 2006 | 1,412,500 | 749,200 | 5,500,700 | 7.3 | 65.0 | 68.4 | 34.9 |
| 2007 | 1,474,800 | 776,400 | 5,631,500 | 7.3 | 65.6 | 68.7 | 35.0 |
| 2008 | 1,530,100 | 798,000 | 5,707,800 | 7.2 | 65.9 | 69.3 | 35.2 |
| 2009 | 1,564,400 | 806,900 | 5,615,200 | 7.0 | 66.4 | 69.6 | 35.3 |
| 2010 | 1,601,100 | 819,500 | 5,724,900 | 7.0 | 66.5 | 69.7 | 35.6 |
| 2011 | 1,628,600 | 833,800 | 5,770,600 | 6.9 | 66.4 | 70.0 | 35.4 |
| 2012 | 1,613,000 | 834,700 | 5,771,100 | 6.9 | 64.9 | 69.1 | 35.1 |
| 2013 | 1,688,700 | 843,100 | 5,893,600 | 7.0 | 67.4 | 69.2 | 35.6 |
| Average | 1,540,500 | 798,300 | 5,665,500 | 7.1 | 65.8 | 69.1 | 35.2 |
|
Note: All the numbers are rounded to the nearest 100. Source: Statistics Canada, Canadian Employer–Employee Dynamics Database Business Owner Module (CEEDD-BOM), and National Accounts Longitudinal Microdata File (NALMF). |
|||||||
Chart 1 compares the benchmark sample to the NALMF by employment size of enterprise for 2013. Table 4 showed that, in 2013, the number of enterprises in the benchmark sample was 67.4% of that in the NALMF, and that the employment associated with enterprises in the benchmark sample was 35.6% that of the NALMF. When these numbers are presented by employment size of enterprise in Chart 1, it is found that the benchmark sample tends to have a better coverage for smaller enterprises. The coverage is better for enterprises with less than 20 employees, accounting for around 71% of all enterprises and employment in the same size categories in the NALMF.Note 20 The shares decline as size of enterprise increases, down to about 50% for enterprises with 50 to 99 employees. The shares drop to around 30% for medium-sized enterprises (with 100 to 499 employees) and to only 11% (number of enterprises) and 5% (employment) for large enterprises (with 500 or more employees).

Data table for Chart 1
| Number of employees | Number of enterprises | Employment |
|---|---|---|
| percent | ||
| 0 | 67.55 | 0.00 |
| 1 to 4 | 67.26 | 70.05 |
| 5 to 19 | 72.93 | 71.34 |
| 20 to 49 | 60.57 | 59.73 |
| 50 to 99 | 49.28 | 48.64 |
| 100 to 499 | 35.84 | 32.72 |
| 500 or more | 11.06 | 5.28 |
| Sources: Statistics Canada, Canadian Employer–Employee Dynamics Database Business Owner Module (CEEDD-BOM) and National Accounts Longitudinal Microdata File (NALMF). | ||
A similar pattern is found in Chart 2, which compares the distribution of employment by size of enterprise in the CEEDD-BOM benchmark sample with that in the NALMF. The distribution in the benchmark sample is right-tailed, with the mass of the distribution concentrated on small firms. In comparison, the distribution of employment in the NALMF is left-tailed, with the mass of the distribution concentrated on medium and large firms. This suggests that the benchmark sample over-represents small firms (with less than 100 employees) and underrepresents large firms (with 500 or more employees).
Data table for Chart 2
| Number of employees | NALMF | CEEDD-BOM benchmark sample |
|---|---|---|
| percent | ||
| 1 to 4 | 9.26 | 18.21 |
| 5 to 19 | 15.01 | 30.06 |
| 20 to 49 | 11.77 | 19.74 |
| 50 to 99 | 8.65 | 11.82 |
| 100 to 499 | 15.55 | 14.28 |
| 500 or more | 39.75 | 5.89 |
| Sources: Statistics Canada, Canadian Employer–Employee Dynamics Database Business Owner Module (CEEDD-BOM) and National Accounts Longitudinal Microdata File (NALMF). | ||
4 Results and sensitivity analysis
This section presents key estimates of business ownership by gender for the enterprises included in the benchmark scenario where the ownership share can be 100% identified or the gender dominance can be observed and linked to the NALMF business sector.Note 21 Sensitivity analysis with an alternative measure of majority ownership—51% versus 50%—and comparison of results with the SFGSME are also presented.
4.1 Estimates of business ownership by gender
Over the period from 2005 to 2013, more than 1 million men-owned enterprises employed 4.1 million workers on an annual basis (Table 5). In contrast, the number of women-owned enterprises (275,300) and associated employment (828,700) were much smaller. The number of women-owned enterprises remained a fraction of that of men-owned enterprises on average (27%), as did the employment of women-owned enterprises (20%). The numbers for equally owned enterprises were the smallest among the three types of ownership.
Estimates of business ownership by gender across provinces or territories, industries and enterprise employment size are presented in Tables A.2 to A.4.
| Men-owned private enterprises | Women-owned private enterprises | Equally-owned private enterprises | ||||
|---|---|---|---|---|---|---|
| Number of enterprises | Total employment |
Number of enterprises | Total employment |
Number of enterprises | Total employment |
|
| number | ||||||
| 2005 | 906,400 | 3,960,700 | 232,800 | 754,400 | 197,300 | 657,300 |
| 2006 | 945,600 | 4,035,100 | 244,200 | 782,200 | 207,300 | 680,700 |
| 2007 | 987,100 | 4,120,700 | 257,800 | 809,500 | 218,300 | 699,400 |
| 2008 | 1,018,700 | 4,171,100 | 270,600 | 818,900 | 227,900 | 717,000 |
| 2009 | 1,034,500 | 4,082,500 | 280,900 | 819,300 | 233,000 | 712,700 |
| 2010 | 1,055,200 | 4,156,900 | 290,000 | 845,300 | 238,800 | 721,600 |
| 2011 | 1,066,400 | 4,183,200 | 296,800 | 863,800 | 247,400 | 722,800 |
| 2012 | 1,055,800 | 4,177,400 | 295,800 | 866,500 | 249,700 | 726,600 |
| 2013 | 1,104,700 | 4,256,500 | 308,700 | 897,900 | 260,500 | 738,800 |
| Average | 1,019,400 | 4,127,100 | 275,300 | 828,700 | 231,100 | 708,600 |
|
Note: All numbers are rounded to the nearest 100. Source: Statistics Canada, Canadian Employer–Employee Dynamics Database Business Owner Module (CEEDD-BOM). |
||||||
Thus far, business ownership by gender is defined according to the shares collectively owned by gender. Interestingly, most private enterprises where ownership shares can be identified are owned by a single dominant owner. Over the period from 2005 to 2013, an average of about 89% of men-owned enterprises were owned by a single dominant man owner. The share of women-owned enterprises that were owned by a single dominant women owner was even higher, about 92%.
4.2 Sensitivity analysis
Definition of majority. An enterprise is defined in the benchmark sample as men-owned if men owners own at least 51% of shares and as women-owned if women owners own at least 51% of shares. Alternatively, the threshold of majority could be defined as 50%. As shown in Table 6, the gender composition of business ownership is almost identical under the two definitions, with a negligibly small shift to men-owned from equally owned enterprises.
| Men-owned enterprise | Women-owned enterprise | Equally-owned enterprise | ||||
|---|---|---|---|---|---|---|
| >=51% | >50% | >=51% | >50% | >=51% | >50% | |
| percent | ||||||
| 2005 | 67.8 | 67.9 | 17.4 | 17.4 | 14.8 | 14.7 |
| 2006 | 67.7 | 67.7 | 17.5 | 17.5 | 14.9 | 14.8 |
| 2007 | 67.4 | 67.5 | 17.6 | 17.6 | 14.9 | 14.9 |
| 2008 | 67.1 | 67.1 | 17.8 | 17.8 | 15.0 | 15.0 |
| 2009 | 66.8 | 66.8 | 18.1 | 18.1 | 15.1 | 15.0 |
| 2010 | 66.6 | 66.6 | 18.3 | 18.3 | 15.1 | 15.1 |
| 2011 | 66.2 | 66.2 | 18.4 | 18.4 | 15.4 | 15.4 |
| 2012 | 65.9 | 65.9 | 18.5 | 18.5 | 15.6 | 15.6 |
| 2013 | 66.0 | 66.0 | 18.5 | 18.5 | 15.6 | 15.5 |
| Source: Statistics Canada, benchmark sample of the Canadian Employer–Employee Dynamics Database Business Owner Module. | ||||||
Comparison with the SFGSME. To ensure estimates of ownership from the CEEDD-BOM are comparable to those from the SFGSME, businesses in the benchmark sample are restricted to those with less than 500 employees and to industries covered by the SFGSME.Note 22 The estimates from the two data sources are close. The shares of men-owned enterprises in the CEEDD and the SFGSME were very similar in 2011, 66.7% vs. 66.3%, and the former is also within the 95% confidence interval of the latter estimate (Table 7). The share of women-owned enterprises was slightly higher in the CEEDD (17.6%) than that in the SFGSME (15.6%) and the share of equally owned enterprises was lower in the CEEDD than in the SFGSME, both estimates from the CEEDD also outside the 95% confidence intervals of the estimates from the SFGSME. The estimates of women-owned enterprises are also similar for 2007 between the two sources and larger in the 2013 CEEDD than 2014 SFGSME, the latest years in the two data sources.
| 2007 | 2011 | 2013 | 2014 | |||
|---|---|---|---|---|---|---|
| CEEDD-BOM | SFGSME | CEEDD-BOM | SFGSME | CEEDD-BOM | SFGSME | |
| percent | ||||||
| Men-owned | 67.7 | 64.3 | 66.7 | 66.3 | 66.6 | 64.6 |
| 95% confidence interval | ||||||
| Lower bound | Note ...: not applicable | 61.0 | Note ...: not applicable | 64.7 | Note ...: not applicable | 63.5 |
| Upper bound | Note ...: not applicable | 67.5 | Note ...: not applicable | 68.0 | Note ...: not applicable | 65.8 |
| Women-owned | 16.8 | 16.4 | 17.6 | 15.6 | 17.6 | 15.7 |
| 95% confidence interval | ||||||
| Lower bound | Note ...: not applicable | 13.8 | Note ...: not applicable | 14.2 | Note ...: not applicable | 14.7 |
| Upper bound | Note ...: not applicable | 19.0 | Note ...: not applicable | 16.9 | Note ...: not applicable | 16.6 |
| Equally-owned | 15.5 | 19.3 | 15.8 | 18.1 | 15.8 | 19.7 |
| 95% confidence interval | ||||||
| Lower bound | Note ...: not applicable | 16.7 | Note ...: not applicable | 16.8 | Note ...: not applicable | 18.8 |
| Upper bound | Note ...: not applicable | 22.0 | Note ...: not applicable | 19.4 | Note ...: not applicable | 20.7 |
|
... not applicable Sources: Statistics Canada, Canadian Employer–Employee Dynamics Database Business Owner Module (CEEDD-BOM) and Survey on Financing and Growth of Small and Medium Enterprises (SFGSME). |
||||||
5 Conclusion
The lack of comprehensive data on women’s business ownership presents challenges for designing policies to promote gender diversity and equality in business ownership. The work plan behind the study fills the gap by identifying business ownership by gender using new administrative data—the Canadian Employer–Employee Dynamics Database (CEEDD). The CEEDD contains information on all business owners and their owned businesses. This paper discusses the methodology adopted to establish the gender structure of business ownership and presents estimates of business ownership by gender. These estimates are robust to alternative definitions of majority ownership and are comparable to those published using the Survey on Financing and Growth of Small and Medium Enterprises.
The CEEDD’s significantly expanded business coverage, longitudinal nature, and multifaceted information on both owners and their businesses creates potential in the study of business ownership. The CEEDD can be used to study the relative performance of women-owned enterprises, compared with men-owned enterprises, in job creation, growth, survival, productivity, research and development, trade, investment, and their underlying forces. It can also be expanded to study other types of business ownership such as ownership by youth, seniors, immigrants and indigenous people.
6 Appendix
| Enterprise size | NALMF | CEEDD-BOM benchmark sample | ||
|---|---|---|---|---|
| Number of enterprises | Total employment | Number of enterprises | Total employment | |
| number | ||||
| No employees | 1,286,100 | 0 | 868,800 | 0 |
| Fewer than 5 employees | 859,600 | 1,532,300 | 578,100 | 1,073,400 |
| 5 to 19 employees | 257,700 | 2,483,100 | 187,900 | 1,771,500 |
| 20 to 49 employees | 63,500 | 1,948,000 | 38,500 | 1,163,600 |
| 50 to 99 employees | 20,800 | 1,431,700 | 10,200 | 696,400 |
| 100 to 499 employees | 13,500 | 2,572,200 | 4,900 | 841,700 |
| 500 employees or more | 2,800 | 6,576,300 | 300 | 347,100 |
| Source: Statistics Canada, Canadian Employer–Employee Dynamics Database Business Owner Module (CEEDD-BOM) and National Accounts Longitudinal Microdata File (NAMLF). | ||||
| Geographic area | Men-owned private enterprises | Women-owned private enterprises | Equally-owned private enterprises | |||
|---|---|---|---|---|---|---|
| Number of enterprises | Total employment |
Number of enterprises | Total employment |
Number of enterprises | Total employment |
|
| number | ||||||
| Newfoundland and Labrador | 8,400 | 44,000 | 2,500 | 12,500 | 1,400 | 7,800 |
| Nova Scotia | 22,400 | 105,700 | 5,300 | 18,900 | 3,600 | 12,400 |
| Prince Edward Island | 4,200 | 21,900 | 1,000 | 3,200 | 700 | 2,700 |
| New Brunswick | 19,400 | 96,900 | 4,400 | 18,200 | 3,100 | 12,500 |
| Quebec | 246,300 | 1,143,500 | 56,700 | 199,400 | 22,900 | 88,300 |
| Ontario | 369,700 | 1,423,100 | 109,100 | 303,700 | 81,600 | 264,600 |
| Manitoba | 26,600 | 128,100 | 6,900 | 25,300 | 8,300 | 28,900 |
| Saskatchewan | 32,200 | 104,600 | 7,000 | 22,000 | 10,000 | 26,300 |
| Alberta | 147,800 | 495,500 | 38,200 | 94,200 | 52,400 | 121,000 |
| British Columbia | 140,300 | 553,500 | 43,600 | 128,800 | 46,800 | 141,900 |
| Territories | 1,900 | 10,200 | 600 | 2,400 | 500 | 2,100 |
| Canada | 1,019,400 | 4,127,100 | 275,300 | 828,700 | 231,100 | 708,600 |
|
Note: All the numbers are rounded to the nearest 100; they may not add up to the total. Source: Statistics Canada, benchmark sample of the Canadian Employer–Employee Dynamics Database Business Owner Module. |
||||||
| Men-owned private enterprises | Women-owned private enterprises | Equally-owned private enterprises | ||||
|---|---|---|---|---|---|---|
| Number of enterprises | Total employment | Number of enterprises | Total employment | Number of enterprises | Total employment | |
| number | ||||||
| Agriculture, forestry, fishing and hunting | 54,900 | 163,100 | 6,800 | 18,800 | 12,900 | 34,100 |
| Mining, quarrying, and oil and gas extraction and utilities | 8,600 | 33,800 | 1,000 | 2,900 | 2,800 | 6,000 |
| Construction | 128,600 | 595,700 | 11,900 | 37,600 | 22,500 | 76,800 |
| Manufacturing | 36,200 | 474,300 | 6,500 | 51,900 | 7,000 | 44,800 |
| Wholesale trade | 41,100 | 268,500 | 8,200 | 34,100 | 8,500 | 32,200 |
| Retail trade | 65,500 | 634,900 | 25,800 | 142,100 | 19,600 | 119,600 |
| Transportation and warehousing | 50,500 | 195,500 | 5,400 | 20,500 | 8,100 | 25,300 |
| Information and cultural industries | 12,000 | 40,500 | 3,700 | 5,700 | 2,000 | 4,200 |
| FIRE and management of companies and enterprises | 165,200 | 188,500 | 49,400 | 36,500 | 38,100 | 28,000 |
| Professional, scientific and technical services | 123,700 | 283,900 | 37,500 | 58,800 | 32,600 | 46,300 |
| Administrative and support, waste management and remediation services | 40,300 | 284,800 | 14,300 | 85,500 | 8,700 | 46,600 |
| Educational services | 5,100 | 19,800 | 3,700 | 16,100 | 1,800 | 6,900 |
| Health care and social assistance | 40,100 | 160,300 | 22,800 | 87,300 | 6,400 | 31,900 |
| Arts, entertainment and recreation | 9,200 | 48,400 | 3,900 | 13,400 | 2,200 | 9,200 |
| Accommodation and food services | 32,800 | 457,700 | 13,800 | 130,700 | 11,700 | 133,000 |
| Other services (except public administration) | 42,200 | 162,700 | 15,600 | 53,900 | 9,800 | 35,600 |
| All industries | 1,019,400 | 4,127,100 | 275,300 | 828,700 | 231,100 | 708,600 |
|
Notes: FIRE: finance, insurance, real estate and rental and leasing. A fraction of enterprises are missing North American Industry Classification System codes, accounting for about 19% of all private enterprises included in the benchmark scenario. However, they only account for only 3% to 4% of total employment. All the numbers are rounded to the nearest 100; they may not add up to the total. Source: Statistics Canada, benchmark sample of the Canadian Employer–Employee Dynamics Database Business Owner Module. |
||||||
| Men-owned private enterprises | Women-owned private enterprises | Equally-owned private enterprises | ||||
|---|---|---|---|---|---|---|
| Number of enterprises | Total employment | Number of enterprises | Total employment | Number of enterprises | Total employment | |
| number | ||||||
| No employees | 503,300 | 0 | 141,300 | 0 | 111,200 | 0 |
| Fewer than 5 employees | 352,900 | 664,000 | 94,700 | 172,700 | 85,200 | 170,300 |
| 5 to 19 employees | 124,100 | 1,176,700 | 32,200 | 296,500 | 28,800 | 269,000 |
| 20 to 49 employees | 27,200 | 825,600 | 5,300 | 159,100 | 4,600 | 135,900 |
| 50 to 99 employees | 7,800 | 528,900 | 1,300 | 85,600 | 1,000 | 64,600 |
| 100 employees or more | 4,100 | 931,900 | 500 | 114,900 | 400 | 68,700 |
| All sizes | 1,019,400 | 4,127,100 | 275,300 | 828,700 | 231,100 | 708,600 |
|
Note: Size of enterprise is measured by employment. All numbers are rounded to the nearest 100; they may not add up to the total. Source: Statistics Canada, benchmark sample of the Canadian Employer–Employee Dynamics Database Business Owner Module. |
||||||
References
Adema, W., N. Ali, V. Frey, H. Kim, M. Lunati, M. Piacentini, and M. Queisser. 2014. Enhancing Women’s Economic Empowerment Through Entrepreneurship and Business Leadership in OECD Countries. Paris: OECD (Organisation for Economic Co-operation and Development).
Canada Revenue Agency. 2016. T2 Corporation – Income Tax Guide. Available at: https://www.canada.ca/content/dam/cra-arc/migration/cra-arc/formspubs/prioryear/t4012/t4012-16e.pdf (accessed January 8, 2018).
Coleman, S., and A. Robb. 2012. “Gender-based firm performance difference in the United States: Examining the roles of financial capital and motivations.” In Global Women’s Entrepreneurship Research: Diverse Settings, Questions, and Approaches, ed. K.D. Hughes and J.E. Jennings, p. 75–92. United Kingdom: Edward Elgar Publishing.
Fairlie, R., and A. Robb. 2009. “Gender differences in business performance: Evidence from the characteristics of Business Owners Survey.” Small Business Economics 33: 375–395.
Green, D., H. Liu, Y. Ostrovsky, and G. Picot. 2016. Immigration, Business Ownership, and Employment in Canada. Analytical Studies Branch Research Paper Series, no. 375. Statistics Canada Catalogue no. 11F0019M. Ottawa: Statistics Canada.
Grekou, D., J. Li, and H. Liu. 2018. Women-owned Enterprises in Canada. Economic Insights, no. 083. Statistics Canada Catalogue no. 11-626-X. Ottawa: Statistics Canada.
Grekou, D., and H. Liu. 2018. The Entry Into and Exit out of Self-employment and Business Ownership in Canada. Analytical Studies Branch Research Paper Series, no. 407. Statistics Canada Catalogue no. 11F0019M. Ottawa: Statistics Canada.
Industry Canada. 2015. Majority Female-Owned Small and Medium-Sized Enterprises. Special Edition: Key Small Business Statistics. May 2015. Ottawa: Industry Canada.
Knight, F. 1921. Risk, Uncertainty, and Profit. Boston: Houghton Mifflin.
Levine, R., and Y. Rubinstein. 2017. “Smart and Illicit: Who Becomes an Entrepreneur and Do They Earn More?” Quarterly Journal of Economics 132 (2): 963–1018.
Light, A., and R. Munk. 2015. Business Ownership vs. Self-Employment. Ohio State University. Mimeo.
Rollin, A.M. 2014. “Developing a longitudinal structure for the National Accounts Longitudinal Microdata File (NALMF).” In Producing Reliable Estimates from Imperfect Frames: Proceedings: Statistics Canada’s International Methodological Symposium, October 16–18, 2013, p. 306–311. Statistics Canada Catalogue no. 11-522-X. Ottawa: Statistics Canada.
Rosa, J., and D. Sylla. 2016. A Comparison of the Performance of Majority Female-owned and Majority Male-owned Small and Medium-sized Enterprises. Centre for Special Business Projects. Ottawa: Innovation, Science and Economic Development Canada.
Schumpeter, J.A. 1942. Capitalism, Socialism, and Democracy. New York: Harper.
Wolfson, M., M. Veall, N. Brooks, and B. Murphy. 2016. “Piercing the veil: Private corporations and the income of the affluent.” Canadian Tax Journal 64 (1): 1–30.
- Date modified: