
Economic and Social Reports
Patenting activity of Canadian-resident businesses
DOI: https://doi.org/10.25318/36280001202200300005-eng
Skip to text
Text begins
Abstract
This article presents some initial findings from a new longitudinal database created from administrative data sources to study patenting in Canada. The study of patenting is important, as patenting is a measure of innovative activity and has been linked to positive economic outcomes for firms. Over the 2001-to-2015 period, Canadian-resident businesses increasingly filed patent applications in the United States, and that the increase was accounted for by smaller, younger firms in service industries. Patent applications to other patent offices by Canadian-resident business declined over the same period. Technical areas where applications to the United States increased the most include civil engineering, medical technology, information technology methods for management, computer technology, transport, and digital communications. Finally, evidence is presented that suggests, for Canadian-resident businesses, the economic outcomes associated with filing a patent in the United States are similar to those of filing for a patent application in Canada. Once firm and industry characteristics are controlled for, data show that filing for a patent is associated with a 7.5% increase in the probability of experiencing high employment growth and a 12.9% increase in the probability of experiencing high revenue growth.
Authors
Chahreddine Abbes, John Baldwin and Danny Leung are with the Economic Analysis Division at Statistics Canada.
Introduction
Innovation is said to be a major contributor to economic growth.Note While innovation can refer to a number of things, for the purpose of measurement and comparison of innovation in businesses, the Organisation for Economic Co-operation and Development and Eurostat (2018) recommend that innovation refer to product (good or service) innovations or business process innovations that differ significantly from previous products and processes. Like many countries, Canada collects data on innovation through surveys, such as the Survey of Innovation and Business Strategy.Note
Considering the lack of universal definition of the notion of “innovation,” researchers have used intellectual property (IP) to measure it. As stated by Corbin (2010), IP constitutes the measurable component of innovation. IP allows the broad concept of innovation to be concretized by a set of measurable economic components (e.g., patents, industrial designs, trademarks, etc). It facilitates the study of the relationshIP between innovation and economic benefit, despite the fact that not all innovations are protected by IP rights, and not all IP rights have economic value.Note Various countries and world organizations have used the number of patents, trademarks, industrial designs and registered copyrights as proxy measures of country innovativeness.
Patents, along with other forms of IP, are an important tool used by businesses to protect their innovations. Patents can be sought for inventions that are novel, are inventive and have industrial usefulness.Note Patent holders have the right to stop others from making, using or selling their inventions for a period of 20 years from the filing date in the country in which the patent was granted. Patent statistics have also been used by some as an alternative measure of innovation.Note Statistics Canada’s 2019 Intellectual Property Awareness and Use Survey shows that innovation and patent statistics can be complementary.Note It found that not all businesses engaged in innovative activities were patent owners,Note and not all patent owners were engaged in innovative activities.Note It also found that 60.3% of patent owners were innovators, while 7.8% of businesses engaged in innovative activities were patent owners.
Patent statistics can also be important because they shed light on an aspect of the innovation process, which, for policy makers and businesses, can be as important as measuring innovation itself.Note Understanding the factors and inputs that contribute to inventions, and the strategies and circumstances that lead to the successful introduction of those inventions to market, informs the development of economic policy.
To complement the existing survey data already being collected, Statistics Canada has developed from administrative data sources the Canadian Patent Research Database, which can be used for analysis on innovation in Canada. The Canadian Patent Research Database was created from the European Patent Office Worldwide Patent Statistical Database (PATSTAT) and linked to administrative data sources at Statistics Canada on business performance and business activities.Note For businesses with operations in Canada, the Canadian Patent Research Database gives the year of application, application authority, technological sector and field of the patent, whether the patent was granted, and other patent application characteristics for the period from 2001 to 2015. When linked to other Statistics Canada administrative data sources, it can be used to examine trends in patenting by firm characteristics. It complements existing survey data by providing a longer-run view of patenting activity in Canada. It offers the ability to disaggregate the data further because it contains data on all firms patenting in Canada and the ability to conduct longitudinal analysis (for example, to study the link between patenting and firm growth). This article highlights some of the initial findings from the database.
The article first looks at aggregate trends in patenting activity of Canadian-resident businesses (businesses with operations in Canada). It finds that there is a shift toward applications made to the United States Patent and Trademark Office (USPTO) underlying a modest increase in patent applications overall. The article takes advantage of the newly constructed database to examine the drivers of these trends by firm size, firm age, industry and technology field. It then presents evidence on whether there are economic consequences to the shift in applications toward the USPTO.
The number of patent applications made by Canadian-resident businesses has increased slightly over the 2001-to-2015 period. All of the increase was accounted for by an increase in patent activity in the United States. The number of patent applications filed at other patent offices, including the Canadian office, declined. The increase in applications in the United States was accounted for by smaller, younger firms in service industries, while the decrease in applications at all other offices was traced to larger firms and firms in manufacturing. The top five technical areas in which patent applications increased include civil engineering, medical technology, information technology (IT) methods for management, computer technology and transport. An area in which applications increased in the United States, but not at other offices, is digital communications. Finally, evidence is presented that suggests that, for Canadian-resident businesses, the economic outcomes associated with filing for a patent application in the United States are similar to those of filing for a patent application in Canada. Furthermore, filing for a patent is found to be positively correlated with the probability of experiencing high employment and revenue growth.
Canadian-resident businesses are increasingly filing for patent applications in the United States
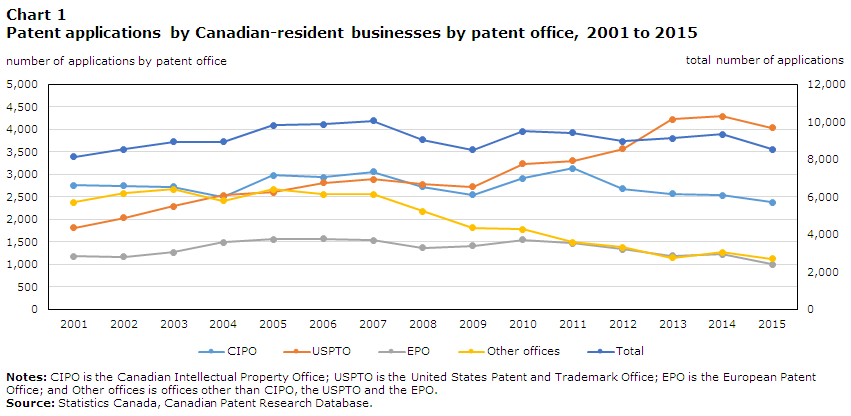
The number of patent applications made by Canadian-resident businesses has increased modestly over the 2001-to-2015 time period (Figure 1). It has increased from around 8,100 applications in 2001 to 8,500 applications in 2015. This small increase obscures larger changes to where Canadian-resident businesses are filing for their patent applications. Canadian-resident businesses are increasingly filing for patents at the USPTO. Patent applications to the USPTO rose from around 1,800 applications in 2001 to about 4,000 in 2015. Since 2008, the USPTO has been the leading destination for patent applications by Canadian-resident businesses. This increase has been offset by declines in patent applications at the Canadian Intellectual Property Office (CIPO), the European Patent Office (EPO) and other offices around the world.Note The largest decrease in the number of applications was to the other offices category, which fell from 2,400 applications in 2001 to 1,100 applications in 2015.
The observation that patent applications by Canadian residents have increased at the USPTO has been made before by Greenspon and Rodrigues (2017).Note However, because the Canadian Patent Research Database is linked to other firm-level data sources, additional insights can be gained on what is behind the increase.Note
Data table for Chart 1
| CIPO | USPTO | EPO | Other offices | Total | |
|---|---|---|---|---|---|
| Number of applications by patent office | |||||
| 2001 | 2757 | 1817 | 1185 | 2378 | 8137 |
| 2002 | 2751 | 2034 | 1174 | 2582 | 8541 |
| 2003 | 2726 | 2288 | 1271 | 2670 | 8955 |
| 2004 | 2502 | 2540 | 1496 | 2417 | 8955 |
| 2005 | 2985 | 2607 | 1557 | 2670 | 9819 |
| 2006 | 2937 | 2811 | 1576 | 2558 | 9882 |
| 2007 | 3057 | 2897 | 1539 | 2556 | 10049 |
| 2008 | 2724 | 2777 | 1376 | 2182 | 9059 |
| 2009 | 2552 | 2727 | 1418 | 1812 | 8509 |
| 2010 | 2917 | 3237 | 1552 | 1783 | 9489 |
| 2011 | 3133 | 3308 | 1475 | 1494 | 9410 |
| 2012 | 2685 | 3566 | 1342 | 1388 | 8981 |
| 2013 | 2576 | 4228 | 1190 | 1146 | 9140 |
| 2014 | 2538 | 4297 | 1230 | 1266 | 9331 |
| 2015 | 2377 | 4032 | 1004 | 1124 | 8537 |
|
Notes: CIPO is the Canadian Intellectual Property Office; USPTO is the United States Patent and Trademark Office; EPO is the European Patent Office; and Other offices is offices other than CIPO, the USPTO and the EPO. Source: Statistics Canada, Canadian Patent Research Database. |
|||||
Smaller, younger firms in service industries are responsible for the increase in patenting by Canadian-resident businesses in the United States
Patent are applied for by both young and small firms and older and larger firms (Table 1). In 2001, small firms with 0 to 19 employees accounted for about one-quarter of patent applications at each patent office, while firms with 500 or more employees accounted for about 40% or more. At the same time, new firms (0 to 1 year of age) accounted for around 13% of applications, while older firms (11 years of age and older) accounted for around 50%. In 2001, patent applications were concentrated in the manufacturing industry (over 50%), but a large fraction was also in the professional, scientific and technical services industry (around 20%).
Between 2001 and 2015, there were some changes in these shares. Although small firms with 0 to 19 employees accounted for 23.0% of USPTO patent applications in 2001, they accounted for 38.0% in 2015. USPTO patent applications rose by 2,215 between 2001 and 2015, and small firms accounted for 50.1% of that change. In contrast, large firms with 500 or more employees accounted for 48.9% of USPTO patent applications in 2001, but for 28.6% of them in 2015. Large firms accounted for 12.2% of the change in the number of USPTO patent applications between 2001 and 2015.
The changes by firm age were less stark. The youngest firms, those 0 to 1 year of age, accounted for 10.8% of USPTO patent applications in 2001 and 16.2% of the change between 2001 and 2015. The oldest firms, those aged 11 or older, accounted for 60.1% of USPTO applications in 2001 and 47.8% of the change in applications.
However, there were more significant changes by industry. Although businesses in manufacturing accounted for the majority of USPTO patent applications in 2001 (58.3%), they accounted for 8.4% of the change between 2001 and 2015. Most of the change was because of trade (15.1%); professional, scientific and technical services (30.7%); and other service industries (37.3%).
The source of the decreases in the number of patent applications at other offices almost mirrors the explanation for the increase in applications at the USPTO. Larger firms were mainly responsible for the decrease in the number of applications at the other patent offices examined, but especially at CIPO and the EPO. In 2001, large firms with 500 or more employees accounted for 40.6% and 44.4% of patent applications at CIPO and the EPO, respectively. By 2015, the large firm share of patent applications at CIPO and the EPO fell to 33.8% and 36.4%, respectively. Large firms with 500 or more employees accounted for 83.6% of the (-380) decrease in applications at CIPO, 90.8% of the (-181) decrease in applications at the EPO, and 49.6% of the (-1,254) decrease in applications at other patent offices.
When the decreases in applications are broken down by firm age, firms that are 2 to 5 years old were primarily responsible. In fact, 77.2% of the decline in patent applications at CIPO were because of these firms, compared with 73.0% at the EPO and 34% at other patent offices.
Finally, most of the declines in the number of applications at CIPO, the EPO and other patent offices were because of declines in applications made by businesses in manufacturing. Businesses in manufacturing accounted for 137.2% of the decline at CIPO, 157.1% of the decline at the EPO and 62.3% of the decline at other patent offices. The decline in the number of applications at CIPO and the EPO was offset somewhat by increases in the number of applications, most notably, in trade and other service industries.
| Applications in 2001 | Applications in 2015 | Change in applications between 2001 and 2015 | ||||||||||||
|---|---|---|---|---|---|---|---|---|---|---|---|---|---|---|
| CIPO | USPTO | EPO | Other | Total | CIPO | USPTO | EPO | Other | Total | CIPO | USPTO | EPO | Other | |
| number | ||||||||||||||
| Total | 2,757 | 1,817 | 1,185 | 2,378 | 8,137 | 2,377 | 4,032 | 1,004 | 1,124 | 8,537 | -380 | 2,215 | -181 | -1,254 |
| percent | ||||||||||||||
| Employment size of firm | ||||||||||||||
| 0 to 19 employees | 25.8 | 23.0 | 24.4 | 25.9 | 25.4 | 38.5 | 38.0 | 38.3 | 38.0 | 37.7 | -55.9 | 50.1 | -56.4 | 13.1 |
| 20 to 99 employees | 18.6 | 13.8 | 15.6 | 18.4 | 17.5 | 17.6 | 19.2 | 13.1 | 19.4 | 17.4 | 25.1 | 23.6 | 30.1 | 17.4 |
| 100 to 499 employees | 15.1 | 14.3 | 15.7 | 16.0 | 15.1 | 10.0 | 14.2 | 12.2 | 12.3 | 12.0 | 47.3 | 14.1 | 35.6 | 19.9 |
| 500 or more employees | 40.6 | 48.9 | 44.4 | 39.7 | 42.0 | 33.8 | 28.6 | 36.4 | 30.3 | 33.0 | 83.6 | 12.2 | 90.8 | 49.6 |
| Total | 100.0 | 100.0 | 100.0 | 100.0 | 100.0 | 100.0 | 100.0 | 100.0 | 100.0 | 100.0 | 100.0 | 100.0 | 100.0 | 100.0 |
| Age of business | ||||||||||||||
| 0 to 1 year | 13.5 | 10.8 | 11.7 | 12.6 | 12.8 | 10.7 | 13.8 | 10.5 | 9.6 | 11.8 | 31.1 | 16.2 | 18.4 | 15.7 |
| 2 to 5 years | 22.7 | 16.3 | 23.3 | 23.7 | 22.0 | 14.2 | 16.9 | 14.8 | 14.0 | 15.3 | 77.2 | 17.4 | 73.0 | 34.0 |
| 6 to 10 years | 14.7 | 12.9 | 16.0 | 17.1 | 15.2 | 11.2 | 16.0 | 11.7 | 16.9 | 13.6 | 36.9 | 18.6 | 41.1 | 17.3 |
| 11 or more years | 49.1 | 60.1 | 49.0 | 46.6 | 50.0 | 63.9 | 53.3 | 63.0 | 59.5 | 59.3 | -45.2 | 47.8 | -32.5 | 33.0 |
| Total | 100.0 | 100.0 | 100.0 | 100.0 | 100.0 | 100.0 | 100.0 | 100.0 | 100.0 | 100.0 | 100.0 | 100.0 | 100.0 | 100.0 |
| Industry | ||||||||||||||
| Unclassified | 10.1 | 11.5 | 9.5 | 14.2 | 11.0 | 7.4 | 5.9 | 6.5 | 3.2 | 6.3 | 27.4 | 1.4 | 26.4 | 25.9 |
| Other goods industries | 2.0 | 0.9 | 2.2 | 2.0 | 1.8 | 3.1 | 2.2 | 1.7 | 1.4 | 2.2 | -4.9 | 3.3 | 4.9 | 2.7 |
| Mining, oil and gas | 7.3 | 1.4 | 1.1 | 2.3 | 3.5 | 9.9 | 2.8 | 1.4 | 2.7 | 8.3 | -8.9 | 3.9 | -0.6 | 1.9 |
| Manufacturing | 50.3 | 58.3 | 55.2 | 50.0 | 52.0 | 36.7 | 30.7 | 37.7 | 38.5 | 33.1 | 137.2 | 8.4 | 157.1 | 62.3 |
| Trade | 3.5 | 3.6 | 4.0 | 5.1 | 4.0 | 9.1 | 9.9 | 6.5 | 6.2 | 8.1 | -32.0 | 15.1 | -11.0 | 4.1 |
| Professional, scientific and technical services | 17.9 | 16.4 | 19.5 | 17.8 | 19.0 | 18.3 | 24.3 | 23.0 | 32.1 | 23.2 | 15.3 | 30.7 | -0.6 | 2.8 |
| Other service industries | 8.9 | 7.9 | 8.6 | 8.4 | 8.6 | 15.6 | 24.2 | 23.2 | 15.9 | 18.8 | -34.0 | 37.3 | -76.1 | 0.5 |
| Total | 100.0 | 100.0 | 100.0 | 100.0 | 100.0 | 100.0 | 100.0 | 100.0 | 100.0 | 100.0 | 100.0 | 100.0 | 100.0 | 100.0 |
|
Notes: CIPO is the Canadian Intellectual Property Office; USPTO is the United States Patent and Trademark Office; EPO is the European Patent Office; and Other offices is offices other than CIPO, the USPTO and the EPO. Source: Statistics Canada, Canadian Patent Research Database. |
||||||||||||||
Canadian-resident businesses are increasingly patenting in the technology field of civil engineering
Overall, the number of patent applications by Canadian-resident businesses increased the most in civil engineering (for example, the construction of buildings and roads, and some mining infrastructure).Note Between 2001 and 2015, the weightedNote number of patent applications in civil engineering grew by 317. Medical technology (+198), IT methods for management (+153), computer technology (+153) and transport (+127) were the four other areas that showed the largest increases between 2001 and 2015.
When only patent applications to the USPTO are considered, the top fields are similar. Between 2001 and 2015, the weighted number of applications increased the most in the field of computer technology (+300), civil engineering (+235), digital communications (+227), medical technology (+185), transport (+142) and IT methods for management (+132). Interestingly, despite the increase in patenting in digital communications at the USPTO, overall, Canadian-resident businesses are patenting less in the area of digital technologies (-160). There were declines in the number of patent applications in digital communications at CIPO, the EPO and other patent offices.
Data show that Canadian-resident businesses that file for patent applications are more likely to experience an episode of high growth, regardless of where the patent application is made in Canada or the United States
The increase in patent applications made to the USPTO by Canadian-resident businesses could be motivated by a number of factors. Zhao (2020) notes several differences in the patent systems in Canada and the United States. The USPTO allows for patents in areas related to medical methods and software and business methods, while CIPO requires a technical solution (a computer) as an essential element of a construed claim in these cases;Note patents proceed to examination automatically at the USPTO, while a separate request for examination is required at CIPO; and there are annual maintenance fees for patents and patent applications at CIPO, while maintenance fees are due only three times over the life of a patent at the USPTO. Ultimately, differences in the potential monetary benefits from holding a patent in the United States versus Canada because of differences in the size of the markets may be an important factor, but it is not clear why this factor has changed over time.
Investigating further the reasons behind the increase in patenting in the United States is beyond the scope of this first article using the new Canadian Patent Research Database. Instead, some evidence on the relationship between filing for patents and growth at the firm level is presented to see whether the economic outcomes of applying at CIPO and the USPTO are different.
Table 2 shows that firms that applied for at least one patent over the 2001-to-2015 period to any patent office had a 25.2 percentage point higher chance of experiencing at least one episode of high employment growth over that same period and a 36.0 percentage point higher chance of experiencing at least one episode of high revenue growth.Note When controls for industry sector, firm employment size, age of firm, whether the firm had research and development expenditures at least once over the period, and year of observation are included, applying for at least one patent is still found to be correlated with experiencing an episode of high employment and revenue growth. Filing for a patent is associated with a 7.5 percentage point higher probability of experiencing high employment growth and a 12.9 percentage point higher chance of experiencing high revenue growth.
When similar analysis is carried out controlling for where the patent application is filed, there is little difference in the relationship between filing a patent application in Canada and the United States and the probability of experiencing either high employment or revenue growth. When other firm characteristics are taken into account, making at least one patent application at CIPO over the 2001-to-2015 period is associated with a 4.4 percentage point higher chance of having an episode of high employment growth, compared with a 4.1 percentage point higher chance when a patent application is filed at the USPTO. The results are similar for revenue growth. Firms that file patent applications at CIPO have a 7.0 percentage point higher chance of having high revenue growth, compared with a 5.7 percentage point higher chance for firms filing applications at the USPTO.Note
The relationship between filing a patent application at the EPO or other patent offices and high employment or revenue growth is less strong and not always statistically significant. It might be the case that applications to the EPO and other patent offices are often accompanied by or preceded by applications to CIPO and the USPTO, and disentangling the relationships requires more sophisticated analysis. Nevertheless, the analysis presented here suggests that patenting in the United States is associated with similar economic outcomes to patenting in Canada, and that the increase in patenting in the United States by Canadian-resident businesses may not be of concern.
| Probability of high employment growth | Probability of high revenue growth | |||||||
|---|---|---|---|---|---|---|---|---|
| No controls | With controls | No controls | With controls | No controls | With controls | No controls | With controls | |
| Filed a patent application | ||||||||
| Coefficient | 0.252 | 0.075 | Note ...: not applicable | Note ...: not applicable | 0.360 | 0.129 | Note ...: not applicable | Note ...: not applicable |
| P-value | (0.000) | (0.000) | Note ...: not applicable | Note ...: not applicable | (0.000) | (0.000) | Note ...: not applicable | Note ...: not applicable |
| CIPO | ||||||||
| Coefficient | Note ...: not applicable | Note ...: not applicable | 0.149 | 0.044 | Note ...: not applicable | Note ...: not applicable | 0.218 | 0.070 |
| P-value | Note ...: not applicable | Note ...: not applicable | (0.000) | (0.000) | Note ...: not applicable | Note ...: not applicable | (0.000) | (0.000) |
| USPTO | ||||||||
| Coefficient | Note ...: not applicable | Note ...: not applicable | 0.114 | 0.041 | Note ...: not applicable | Note ...: not applicable | 0.151 | 0.057 |
| P-value | Note ...: not applicable | Note ...: not applicable | (0.000) | (0.000) | Note ...: not applicable | Note ...: not applicable | (0.000) | (0.000) |
| EPO | ||||||||
| Coefficient | Note ...: not applicable | Note ...: not applicable | 0.023 | 0.008 | Note ...: not applicable | Note ...: not applicable | 0.025 | 0.016 |
| P-value | Note ...: not applicable | Note ...: not applicable | (0.016) | (0.351) | Note ...: not applicable | Note ...: not applicable | (0.012) | (0.088) |
| Other offices | ||||||||
| Coefficient | Note ...: not applicable | Note ...: not applicable | 0.006 | 0.007 | Note ...: not applicable | Note ...: not applicable | 0.034 | 0.032 |
| P-value | Note ...: not applicable | Note ...: not applicable | (0.511) | (0.440) | Note ...: not applicable | Note ...: not applicable | (0.001) | (0.001) |
|
... not applicable Notes: CIPO is the Canadian Intellectual Property Office; USPTO is the United States Patent and Trademark Office; EPO is the European Patent Office; and Other offices is offices other than CIPO, the USPTO and the EPO. P-values are in parentheses. Control variables include employment size of firm, age of firm, whether the firm conducted research and development, industry, and year of observation. Source: Statistics Canada, Canadian Patent Research Database. |
||||||||
Conclusion
This article presents some initial findings from the new Canadian Patent Research Database. Over the 2001-to-2015 period, the number of patent applications made by Canadian-resident businesses increased modestly, but there was a stronger increase in patent applications made in the United States. This increase in patenting in the United States can be traced to the increased activity of smaller, younger firms in service industries and in the technological fields of computer technology, civil engineering, digital communications, medical technology, transport, and IT methods for management.
It is not clear why Canadian-resident firms are increasingly patenting in the United States, but evidence suggests it is not detrimental. Canadian-resident firms that file patent applications in the United States are as likely to experience high employment or revenue growth as firms that make applications in Canada.
Future research using the Canadian Patent Research Database will take full advantage of the longitudinal nature of the database to examine the causal impact of patenting on firm outcomes, and the ability to disaggregate results along a number of dimensions, including whether businesses are owned by men or women. The database will also be further developed to include data on individual inventors, in addition to business applicants. These developments will facilitate studies on, for example, the role inventors play in the success of businesses and knowledge diffusion through the movement of inventors between businesses.
References
Abbes, C., Baldwin, J. R., Gibson, R., & Leung, D. (2022). Canadian Patent Research Database (Analytical Studies: Methods and References, No. xx). Statistics Canada.
Arundel, A. (2001). The relative effectiveness of patents and secrecy for appropriation. Research Policy, 30(4), 611–624.
Brydon, R., Chesterley, N., Dachis, B., & Jacobs, A. (2014). Measuring innovation in Canada: The tale told by patent applications. (E-Brief - Essential Policy Intelligence, No. 191). C. D. Howe Institute.
Cohen, W., Nelson, R., & Welsh, J. (2000). Protecting their intellectual assets: Appropriability conditions and why manufacturers patent (or not). (Working Paper, No. 7552). National Bureau of Economic Research.
Corbin, R. (2010). Intellectual property in the 21st century. Conference Board of Canada.
Czarnitzki, D., Hussinger, K., & Leten, B. (2020). How valuable are patent blocking strategies? Review of Industrial Organization, (56), 409–434.
Dziallas, M., & Blind, K. (2019). Innovation indicators throughout the innovation process: An extensive literature analysis. Technovation, (80–81), 3–29.
Greenspon, J., & Rodrigues, E. (2017). Are trends in patenting reflective of innovation activity in Canada? (Centre for the Study of Living Standards Research Report, No. 2017-02). Centre for the Study of Living Standards.
Griliches, Z. (1990). Patent statistics and economic indicators. Journal of Economic Literature, (28), 1661–1707.
Levin, R., Klevorick, A., Nelson, R., & Winter, S. (1987). Appropriating the returns from industrial research and development. Brookings Papers on Economic Activity, (3), 783–820.
Nakaoka, S., Motohashi, K., & Goto, A. (2010). Patent statistics as an innovation indicator. In Handbook of the economics of innovation Vol. 2 (pp. 1083-1127). Elsevier.
OECD (Organisation for Economic Co-operation and Development). (2009). OECD patent statistics manual. OECD Publishing.
Organisation for Economic Co-operation and Development & Eurostat. (2018). Oslo manual 2018: Guidelines for collecting, reporting and using data on innovation, 4th edition, the measurement of scientific, technological and innovation activities. OECD Publishing. https://doi.org/10.1787/9789264304604-en
Schmoch, U. (2008). Concept of a technological classification for country comparisons: Final report to the World Intellectual Property Organisation. World Intellectual Property Organization. https://www.wipo.int/export/sites/www/ipstats/en/statistics/patents/pdf/wipo_ipc_technology.pdf
Schumpeter, J. (1942). Capitalism, socialism, and democracy. Harper & Bros.
Zhao, L. (2020). Essays on locational patenting behaviour of innovators [Doctoral dissertation, University of Alberta], University of Alberta Library Education and Research Archive.
- Date modified: