
Economic and Social Reports
Patenting activity of women-owned businesses in Canada
DOI : https://doi.org/10.25318/36280001202300200003-eng
Skip to text
Text begins
Abstract
This article examines the patenting activity of women-owned businesses and compares it with that of men- and equally owned businesses, and businesses where gender of ownership cannot be determined. It adds to the literature on the gender n gap in patenting—most of the focus has been on women as researchers or inventors, and not as business owners. From 2001 to 2019, men-owned businesses accounted for a larger share of patent applications than women- and equally owned businesses, and the gender gap did not narrow over the period. The most striking differences between the men- and women-owned businesses that patent were in the propensity to conduct research and development (R&D) and the amount spent on R&D. Men-owned businesses were 16.5 percentage points more likely to have conducted R&D, and, conditional on conducting R&D, spent 70% more. This could help explain why men-owned firms that patent have more applications per firm, and why they have a higher rate of granted applications.
Keywords: business performance, ownership, patents, copyrights, trademarks
Authors
Chahreddine Abbes, Amélie Lafrance-Cooke and Danny Leung are with the Economic Analysis Division, Statistics Canada.
Introduction
In today’s knowledge-based economy, innovative activity and intellectual property (IP) are of increasing importance. Over time, firms have been investing more in intangible assets, relative to tangible assets.Note An important component of intangible assets is innovative property, which includes IP.Note In fact, innovative property as a share of gross fixed capital formation doubled to nearly 14% from 1976 to 2016 (Gu and Macdonald, 2020).
To protect their invention from imitation and to appropriate the benefit of their creativity, firms may apply for various forms of IP rights. IP rights are the legal rights that result from obtaining a patent or registering an industrial design, trademark or copyright to protect intellectual activity in the industrial, scientific, literary and artistic fields.Note IP has become an asset for disseminating knowledge and, above all, a means to increase the profitability and growth of the firm.
A patent is a particular form of IP granted by a government authority that is widely used for both conventional and strategic reasons (Eckert and Langinier, 2014).Note A patent can be used to commercialize products and services, recoup research and development (R&D) spending, secure financing, and more. The fundamental premise behind the patent system is, among other things, to provide an incentive for innovation and creativity while ensuring access to the latest technologies and ideas.
By comparing Canada’s level of competitiveness and innovativeness with the rest of the world, various reports—such as Dutta et al.’s (2022) Global Innovation IndexNote and Schwab and Zahidi’s (2020) Global Competitiveness Report—found that despite Canada’s high ability to innovate, its ranking is significantly affected by its low innovation performance, as measured by IP rights such as patents, industrial designs and trademarks. To spur innovation, the Government of Canada launched its national IP Strategy in 2018. This strategy was designed to support the objectives of the Innovation and Skills Plan, such as fostering an ecosystem that supports businesses to grow.Note
Among the many policy initiatives included in the strategy, particular focus has been prescribed to identify how businesses in Canada understand and use IP, including groups that are traditionally less likely to use it, such as women. While broader than the IP Strategy, the Government of Canada’s Innovation and Skills Plan recognized people as one of Canada’s competitive advantages and sought to foster the participation of traditionally underrepresented groups in the innovation economy as a key activity (ISED, 2019).
Furthermore, studying gender participation in patent filings is useful to understand the systemic barriers that women may face, not only during their education but also during their careers (CIPO, 2017).
This paper focuses on the patenting behaviour of women-owned businesses. It adds to the literature on the gender gap in patenting by examining key trends of the patenting activity of Canadian-resident businesses, both domestically and abroad, by gender of ownership. Most of the studies on women’s participation in IP have focused on researchers or inventors. Women also participate in the innovation ecosystem as business owners, which is the concept explored in this study. Such an exercise helps delineate the patenting gap issue and may initiate discussion about the need to identify its sources.
Existing literature on the underrepresentation of women in patenting
In 2016, the Institute for Women’s Policy Research published a study exploring the underrepresentation of women among patent holders and their ability to secure a patent relative to men applicants; data from the United States Patent and Trademark Office (USPTO) were used (Milli et al., 2016).Note By examining the number of patents with listed women inventors, the fields of technology where women are the most active and the rate of success in getting their patents granted, Milli et al. (2016) reached the following conclusions:
- Women were dramatically underrepresented among patent holders.
- When collaborating with men, women tended to produce the most successful patents, as determined by the number of patent citations, compared with men- or women-only teams.
- Increasing diversity and enhancing women’s participation in commercial science would lead to the development of more effective technologies in the future.
In the same year, the World Intellectual Property Organization published a similar study that looked at the state of women’s participation by analyzing the gender of approximately 9 million inventors and individual applicants for patents who filed applications through the Patent Cooperation Treaty (PCT) system (Martinez et al., 2016). Martinez et al. (2016) found that despite the increase in the share of women inventors of the total listed inventors in PCT applications from 9.5% in 1995 to 15.1% in 2015, less than one-third of all PCT applications included women inventors; women were less likely toile f for a PCT application without men’s participation; and women were less likely to be the only applicant in a PCT application.
Following Martinez et al. (2016), the Canadian Intellectual Property Office (CIPO) (2017) explored women’s participation in PCT applications by Canadians and obtained similar results. This shows that, despite the significant increase (377%) in the share of PCT applications involving women inventors between 1997 and 2015, relative to that for men inventors (285%), the latter still outnumbered women by a ratio of 7:1.
To explain the causes of the gender gap in patenting behaviour, Martinez et al. (2016) examined the evolution of the gender gap across fields of technology and industry sectors. They showed that women have reached a higher gender-balance score in certain key fields of technology, such as biotechnology and pharmaceuticals—fields that have the greatest female researcher participation. However, increasing the number of women in science, technology, engineering and mathematics (STEM) occupations alone will not address the gender gap. Burk (2018) noted that women engage with the patent system less frequently than men across STEM occupations. Women scientists and engineers were less than half as likely to apply for or obtain a patent for their research, relative to their male colleagues. The gap was consistent across all ages and cohorts of women, even as the total number of women in STEM fields was growing over time. CIPO (2017) also found that in STEM fields, the patenting activity of women has been persistently lower than the share of jobs they occupy.
There is limited evidence on the gender gap in patenting among businesses. Using data from the Annual Survey of Entrepreneurs in the United States, Williams-Baron et al. (2018) investigated differences in the IP holdings of women- and men-owned firms and their innovation activity, R&D spending and business outcomes. They found that women-owned businesses were less likely to hold any form of IP, relative to men-owned businesses; men-owned businesses were two times more likely to have a patent granted than women-owned businesses; and across industry sectors, women-owned businesses were less likely to hold any form of IP rights in 13 of 20 industries that include most IP-intensive industries.
Data
This paper relies on a newly created database, the Canadian Patent Research Database (CPRD). This database links the European Patent Office’s Worldwide Patent Statistical Database (PATSTAT),Note which includes data on patents and their characteristics, to Statistics Canada’s administrative data on firms (corporations with or without employees and unincorporated business with employees) to obtain characteristics such as sales, employment, R&D expenditures, tangible and intangible assets, and export activities.Note Overall, roughly 250,000 patent applications by Canadian-resident businesses (a business with an address in Canada) during the period from 2001 to 2019 were extracted from PATSTAT, and 96.1% of those were linked to create the CPRD. In cases where more than one business was listed on a patent application, each business was counted as an applicant and the application was counted more than once. For more information on this data linkage, see Gibson and Leung (2023).
To classify businesses based on the gender of their owners, the paper uses the Canadian Employer–Employee Dynamics Database (CEEDD), which contains business owner information for all unincorporated enterprises and private corporations in Canada. The CEEDD links multiple administrative tax files, such as individual tax files (T1 Personal Income Tax and Benefit Return), individual business ownership files (T1 Financial Declaration for unincorporated business owners and T2 Schedule 50 for incorporated business owners), corporate income tax returns (T2) and unincorporated business tax files (T1 business declaration). This dataset can be used to conduct detailed longitudinal analysis on business ownership and performance (Grekou et al., 2018).
This paper follows the same approach as Grekou et al. (2018) to allocate businesses based on owner gender. To define business ownership by gender, three categories have been used: men-owned businesses, women-owned businesses and equally owned businesses. A business is considered men-owned if the shares owned by one or more men are greater than or equal to 51%; in a women-owned business, one or more women own 51% or more of the business. Finally, for equally owned businesses, men and women own equal shares.
In some cases, it is not possible to assign a gender to the ownership of the business. This occurs when information on ownership is incomplete. The owners of businesses cannot be identified in cases such as governments and some large firms, such as publicly traded firms, where owners are shareholders. Furthermore, some firms can be foreign-owned, and other private firms could have many individual owners with less than 10% ownership (the identity of owners with less than a 10% share is not captured in the T2 Schedule 50). As shown by Abbes et al. (2022), large firms (with 500 or more employees) account for a substantial fraction of patents (e.g., in 2001, 42% of patents were filed by large firms). Because of this, a considerable share of patent applications and patenting firms fall into an unclassified category where gender of ownership cannot be determined.
The proportion of men-owned businesses that patent is greater than that of women-owned businesses
Considering the small number of patent applications for specific groups of firms for certain years, an average number of applications has been calculated over five-year periods for the following four periods: 2001 to 2005, 2006 to 2010, 2011 2015 and 2016 to 2019.
The data show that there are 8 to 10 times more men-owned businesses that patent than women-owned businesses, depending on the period (Table 1). This result translates into an even bigger gap in terms of patent applications, with men-owned businesses accounting for 9 to 12 times more patent applications than women-owned businesses. The gap in the number of patent applications by gender is highest in the most recent period, from 2016 to 2019.
A potential reason that more men-owned businesses patent, compared with women-owned businesses, is because there are more men-owned businesses than women-owned businesses. In the period from 2016 to 2019, there were, on average, 749,400 men-owned businesses and 246,600 women-owned businesses. In other words, there were about three times more men-owned business than women-owned businesses, smaller than the ratio of men-owned businesses that patent to women-owned businesses that patent. As a result, the proportion of men-owned businesses that patent (0.07%) is higher than the proportion of women-owned businesses that patent (0.02%) in the period from 2016 to 2019. These results are consistent with Williams-Baron et al. (2018), who found that men-owned businesses are more likely to file patents than women-owned businesses.
| Period | Men-owned | Women-owned | Equally owned | Unclassified | Total | Men-owned | Women-owned | Equally owned | Unclassified | Total |
|---|---|---|---|---|---|---|---|---|---|---|
| number of patents | number of firms | |||||||||
| 2001 to 2005 | 837 | 89 | 62 | 9,033 | 10,022 | 352 | 40 | 33 | 1,426 | 1,851 |
| 2006 to 2010 | 816 | 74 | 91 | 10,238 | 11,219 | 353 | 35 | 34 | 1,505 | 1,927 |
| 2011 to 2015 | 1,121 | 114 | 98 | 10,756 | 12,089 | 443 | 54 | 45 | 1,739 | 2,280 |
| 2016 to 2019 | 1,258 | 106 | 87 | 8,939 | 10,389 | 519 | 54 | 45 | 1,798 | 2,416 |
| percent | ||||||||||
| Percent change between 2001 to 2005 and 2016 to 2019 | 50.2 | 18.0 | 39.8 | -1.0 | 3.7 | 47.5 | 35.0 | 37.2 | 26.1 | 30.6 |
| Sources: Canadian Patent Research Database and Canadian Employer-Employee Dynamics Database. | ||||||||||
Over time, while the average number of firms and patents increased across all ownership categories where gender of ownership could be identified, men-owned businesses had the highest percentage increases in number of patents (50.2%) and number of firms that patent (47.5%). Equally owned businesses had the next-largest percentage increases in number of patents (39.8%) and number of firms that patent (37.2%), while women-owned businesses had the lowest (18.0% and 35.0% for number of patents and number of patenting firms, respectively). As a result, the gender gap that existed in the period from 2001 to 2005 has widened over time.
Patenting in the United States grew in importance across all business types
In terms of patent applications by application authority, the patenting activity of Canadian-resident businesses has been assessed based on three main application authorities: CIPO, the USPTO and other patent offices (e.g., the European Patent Office and the Japan Patent Office).Note
| Ownership type and patent office | Period | Period | ||||||
|---|---|---|---|---|---|---|---|---|
| 2001 to 2005 | 2006 to 2010 | 2011 to 2015 | 2016 to 2019 | 2001 to 2005 | 2006 to 2010 | 2011 to 2015 | 2016 to 2019 | |
| number | percent | |||||||
| Men-owned | ||||||||
| CIPO | 309 | 284 | 319 | 371 | 36.9 | 34.7 | 28.5 | 29.5 |
| USPTO | 230 | 284 | 491 | 603 | 27.4 | 34.8 | 43.8 | 48.0 |
| Other | 299 | 249 | 310 | 283 | 35.7 | 30.5 | 27.7 | 22.5 |
| Total | Note ...: not applicable | Note ...: not applicable | Note ...: not applicable | Note ...: not applicable | 100.0 | 100.0 | 100.0 | 100.0 |
| Women-owned | ||||||||
| CIPO | 35 | 25 | 33 | 34 | 38.7 | 33.3 | 29.4 | 32.5 |
| USPTO | 19 | 24 | 48 | 54 | 21.7 | 32.8 | 42.3 | 50.7 |
| Other | 35 | 25 | 32 | 18 | 39.6 | 33.9 | 28.3 | 16.8 |
| Total | Note ...: not applicable | Note ...: not applicable | Note ...: not applicable | Note ...: not applicable | 100.0 | 100.0 | 100.0 | 100.0 |
| Equally-owned | ||||||||
| CIPO | 22 | 25 | 30 | 30 | 34.9 | 27.4 | 30.5 | 33.8 |
| USPTO | 16 | 22 | 49 | 44 | 26.3 | 24.6 | 49.8 | 50.4 |
| Other | 24 | 44 | 19 | 14 | 38.8 | 48.0 | 19.7 | 15.8 |
| Total | Note ...: not applicable | Note ...: not applicable | Note ...: not applicable | Note ...: not applicable | 100.0 | 100.0 | 100.0 | 100.0 |
| Unclassified | ||||||||
| CIPO | 2549 | 2670 | 2656 | 2190 | 28.2 | 26.1 | 24.7 | 24.5 |
| USPTO | 2304 | 3127 | 4628 | 4433 | 25.5 | 30.5 | 43.0 | 49.6 |
| Other | 4180 | 4440 | 3472 | 2317 | 46.3 | 43.4 | 32.3 | 25.9 |
| Total | Note ...: not applicable | Note ...: not applicable | Note ...: not applicable | Note ...: not applicable | 100.0 | 100.0 | 100.0 | 100.0 |
| Total | ||||||||
| CIPO | 2914 | 3004 | 3038 | 2625 | 29.1 | 26.8 | 25.1 | 25.3 |
| USPTO | 2569 | 3458 | 5217 | 5133 | 25.6 | 30.8 | 43.2 | 49.4 |
| Other | 4538 | 4758 | 3834 | 2631 | 45.3 | 42.4 | 31.7 | 25.3 |
| Total | Note ...: not applicable | Note ...: not applicable | Note ...: not applicable | Note ...: not applicable | 100.0 | 100.0 | 100.0 | 100.0 |
|
... not applicable Notes: CIPO = Canadian Intellectual Property Office, and USPTO = United States Patent and Trademark Office. Sources: Canadian Patent Research Database and Canadian Employer-Employee Dynamics Database. |
||||||||
From 2001 to 2005, women-owned businesses that patent were more likely to file an application at CIPO (38.7%), compared with men-owned businesses (36.9%), equally owned businesses (34.9%) and unclassified businesses (28.2%) (Table 2). For all Canadian-resident businesses and for each of the categories by gender of ownership, including women-owned businesses, the USPTO share of applications was the lowest from 2001 to 2005.
Over time, the distribution of patent applications by application authority changed significantly in favour of the USPTO for all categories. From 2016 to 2019, the USPTO share of patent applications was estimated at 50.7% for women-owned businesses, 50.4% for equally owned businesses, 48.0% for men-owned businesses and 49.6% for unclassified businesses. Such an evolution in Canadian-resident businesses can be attributed to a significant increase in patenting activity at the USPTO during this period, when patenting activity at CIPO and other jurisdictions has been falling over time. The observation that patent applications by Canadian residents have increased at the USPTO has been made recently by Abbes et al. (2022).
Men-owned businesses that patent were more likely to conduct R&D, and conducted it more intensively
In this section, the characteristics of businesses that patent, by ownership gender are presented. Because only a small number of businesses file patent applications, and a fraction of those are made by businesses where gender of ownership can be identified, only the data for the entire period from 2001 to 2019 are presented.
Table 3 confirms that unclassified businesses that patent are, on average, much larger than businesses where gender of ownership can be identified. Unclassified businesses that patent had, on average, 443.1 employees, compared with 34.7 for men-owned businesses, 32.7 for women-owned businesses and 10.0 for equally owned businesses. Unclassified businesses were also much larger in other ways. On average, they spent almost 10 times more in R&D than men-owned businesses, the group of businesses with the second-largest R&D spending. Their stock of tangible capital net of depreciation was over 80 times higher than that of men-owned businesses. They were also the most likely to export and had the highest payroll per worker.
Among the businesses that patent where gender of ownership can be identified, men-owned businesses had, on average, slightly more employees than women-owned businesses, and both were much larger than equally owned businesses. Capital is the other important input for production, and women-owned businesses had slightly more tangible capital net of depreciation ($1.49 million compared with $1.39 millionNote ). Both men- and women-owned businesses had much larger tangible assets than equally owned businesses, with $0.34 million in tangible assets, on average.
In regard to spending on intangible capital, men-owned businesses that patent were more likely to conduct R&D (60.3%) than women-owned businesses (43.8%) and equally owned businesses (38.9%). Among the patenting businesses that did conduct R&D, those that were men-owned expended $507,800 in R&D, on average, compared with $299,500 for women-owned businesses—a difference of approximately 70%. Equally owned businesses trailed both men- and women-owned businesses, with an average expenditure of $252,800. The higher spending in R&D by men-owned businesses may help explain the higher number of patent applications per firm, compared with women- and equally owned businesses in Table 1.
Table 3 also contains some other characteristics of businesses: age, whether the firm is an exporter, average pay (total annual payroll divided by average monthly employment) and industry. The average ages of men-owned, women-owned and equally owned businesses that patent were similar, all close to 11.5 years. Men-owned businesses that patent were more likely to export, compared with women-owned businesses (18.8% vs. 14.2%) and had a higher payroll per employee ($65,200 vs. $56,600).
Across industries, while both men- and women-owned businesses that patent exhibited similar patterns in terms of the sector of business activity, the data show some differences in magnitude. For example, in each category, businesses that patent most belong to the manufacturing sector, with shares of 30.4% and 27.2%, respectively. However, a higher share of men-owned businesses that patent were in professional, scientific and technical services (23.5%), while a higher share of women-owned businesses were in trade (16.6%). For equally owned businesses, a greater proportion of firms that patent were in professional, scientific and technical services (30.9%), followed by manufacturing (24.8%).
| Men-owned | Women-owned | Equally owned | Unclassified | |
|---|---|---|---|---|
| Average age (years) | 11.7 | 11.4 | 11.6 | 9.5 |
| Average employment (number) | 34.7 | 32.7 | 10.0 | 443.1 |
| Net tangible capital (thousands of dollars) | 1,389.3 | 1,491.0 | 339.8 | 114,838.0 |
| Conducts R&D (percent) | 60.3 | 43.8 | 39.2 | 58.3 |
| R&D expenditures (thousands of dollars) | 489.8 | 285.9 | 217.0 | 4,732.8 |
| Average payroll per employee (dollars) | 65,200.0 | 56,600.0 | 64,300.0 | 79,100.0 |
| Exporter (percent) | 18.8 | 15.4 | 14.2 | 19.1 |
| Distribution across industries (percent) | ||||
| Unclassified | 21.1 | 23.3 | 13.8 | 24.0 |
| Other goods industries | 4.4 | 3.1 | 8.5 | 5.2 |
| Manufacturing | 30.4 | 27.2 | 24.8 | 27.4 |
| Trade | 9.5 | 16.6 | 10.3 | 7.7 |
| Professional, scientific and technical services | 23.5 | 19.6 | 30.9 | 21.9 |
| Other service industries | 11.1 | 10.2 | 11.5 | 13.8 |
| Total | 100.0 | 100.0 | 100.0 | 100.0 |
|
Note: R&D = research and development. Sources: Canadian Patent Research Database and Canadian Employer-Employee Dynamics Database. |
||||
The patent applications of men-owned businesses are more likely to be successful
While many businesses file patent applications, not all applications are granted. From 2001 to 2012, 64.7% of patents filed were granted.Note The data show a small variation in the share of patents granted by gender of ownership. Men-owned businesses were found to be more successful in securing a patent, relative to women- or equally owned businesses. Their grant rate was 58.8%, compared with 55.9% for women-owned businesses and 56.8% for equally owned businesses (Chart 1). The higher grant rate for men-owned businesses could be related to their higher spending on R&D, compared with women-owned businesses.
Such findings seem to confirm those of Milli et al. (2016) and Williams-Baron et al. (2018), showing that men-owned businesses were more successful than women-owned businesses in obtaining patents. However, the gap between men- and women-owned businesses was slightly smaller among Canadian-resident businesses, compared with findings for U.S. businesses. For instance, Milli et al. (2016) found that 67.2% of all patent applications filed by women from 2000 to 2016 were eventually granted, compared with 73.0% of those filed by men.
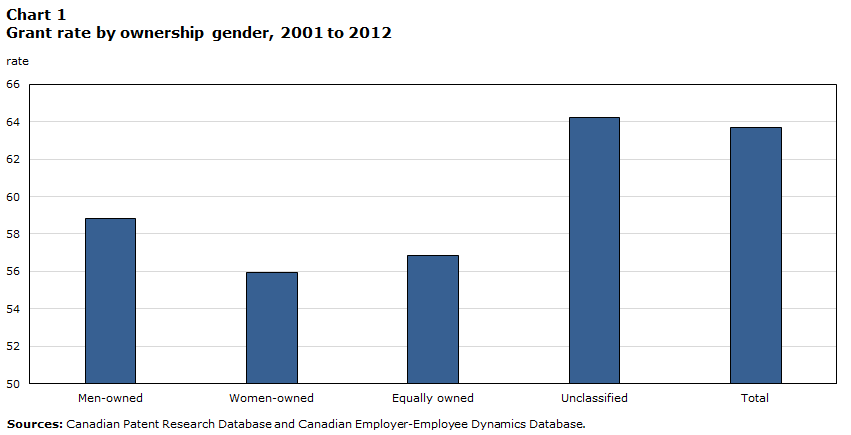
Data table for Chart 1
| Rate | |
|---|---|
| Men-owned | 58.8 |
| Women-owned | 55.9 |
| Equally owned | 56.8 |
| Unclassified | 64.2 |
| Total | 63.7 |
| Sources: Canadian Patent Research Database and Canadian Employer-Employee Dynamics Database. | |
The technology fields in which men- and women-owned businesses patent are similar
Patent applications are classified into 35 technological fields using the International Patent Classification system.Note The data show that the top three fields of patent applications were fairly similar across men-, women- and equally owned businesses, but the rankings differ. The most common fields were civil engineering, medical technology and computer technology. Men-owned businesses had the highest share of patent applications in civil engineering, while women-owned businesses were found to be more involved in the field of medical technology. These patterns are consistent with STEM fields of study by owner gender, whereby, within STEM, women are more concentrated in science and technology.Note The top field in which equally owned businesses made patent applications was civil engineering, followed by digital communications.
Conclusion
This article presents some of the first evidence on patenting by gender of business owner in Canada. As in a previous study for the United States by Williams-Baron et al. (2016), a gap in the propensity to patent between men- and women-owned businesses was found. Also, the size of the gap is not diminishing over time. A striking difference between men- and women-owned firms that could account for this gap is their R&D activity. Men-owned businesses are more likely to perform R&D and spend more on it than women-owned businesses. Future work will examine in greater depth the performance of Canadian-resident businesses and how patenting and R&D affect the growth and survival of businesses.
References
Abbes, C., Baldwin, J., & Leung, D. (2022). Patenting activity of Canadian-resident businesses. Economic and Social Reports, 2(3). https://doi.org/10.25318/36280001202200300005-eng
Burk, D.L. (2018). Bridging the Gender Gap in Intellectual Property. World Intellectual Property Organization Magazine, 2018(2). https://www.wipo.int/wipo_magazine/en/2018/02/article_0001.html
Canadian Intellectual Property Office. (2017). Women’s Participation in Patenting: An Analysis of Patent Cooperation Treaty Applications Originating in Canada. Innovation, Science and Economic Development Canada. https://publications.gc.ca/collections/collection_2018/opic-cipo/Iu71-4-45-2017-eng.pdf
Dutta, S., Lanvin, B., Leon, L., & Wunsch-Vincent, S. (2022). Global Innovation Index 2022: What Is the Future of Innovation-driven Growth? World Intellectual Property Organization.
https://www.wipo.int/edocs/pubdocs/en/wipo-pub-2000-2022-en-main-report-global-innovation-index-2022-15th-edition.pdf
Eckert, A., & Langinier, C. (2014). A Survey of the Economics of Patent Systems and Procedures. Journal of Economic Surveys. 28(5): 996-1015. https://doi.org/10.1111/joes.12034
Gibson, R., & Leung, D. (2023). Canadian Patent Research Database 2001 to 2019. (Analytical Studies: Methods and References, No. 47) Statistics Canada.
Grekou, D., Li, J., & Liu, H. (2018). The Measurement of Business Ownership by Gender in the Canadian Employer-Employee Dynamics Database. (Analytical Studies: Methods and References, No. 17) Statistics Canada. https://www150.statcan.gc.ca/n1/pub/11-633-x/11-633-x2018017-eng.htm
Gu, W., & Macdonald, R. (2020). Business Sector Intangible Capital and Sources of Labour Productivity Growth in Canada. (Analytical Studies Branch Research Paper Series, No. 442) Statistics Canada. https://www150.statcan.gc.ca/n1/pub/11f0019m/11f0019m2020005-eng.htm
ISED. (2019). Building a Nation of Innovators (canada.ca). Innovation, Science and Economic Development Canada.
https://ised-isde.canada.ca/site/innovation-better-canada/sites/default/files/attachments/New_ISEDC_19-044_INNOVATION-SKILLS_E_web.pdf
Martinez, G., Raffo, J., & Saito, K. (2016). Identifying the Gender of PCT Inventors. (Economic Research Working Paper, No. 33) World Intellectual Property Office. https://www.wipo.int/edocs/pubdocs/en/wipo_pub_econstat_wp_33.pdf
Milli, J., Williams-Baron, E., Berlan, M., Xia, J., & Gault, B. (2016). Equity in Innovation: Women Inventors and Patents. Institute for Women’s Policy Research. https://iwpr.org/wp-content/uploads/2020/12/C448-Equity-in-Innovation.pdf
Schmoch, U. (2008). Concept of a technological classification for country comparisons: Final report to the World Intellectual Property Organisation. World Intellectual Property Organization. https://www.wipo.int/export/sites/www/ipstats/en/statistics/patents/pdf/wipo_ipc_technology.pdf
Schwab, K., & Zahidi, S. (2020). The Global Competitiveness Report: How Countries are Performing on the Road to Recovery. World Economic Forum. https://www3.weforum.org/docs/WEF_TheGlobalCompetitivenessReport2020.pdf
Williams-Baron, E., Milli, J., & Gault, B. (2018). Innovation and Intellectual Property Among Women Entrepreneurs. Institute for Women’s Policy Research. https://iwpr.org/wp-content/uploads/2020/10/C472_Report-Innovation-and-Entrepreneurship-9.6.18-clean.pdf
- Date modified: