
Economic and Social Reports
High school academic performance and earnings by postsecondary field of study
DOI: https://doi.org/10.25318/36280001202300400001-eng
Skip to text
Text begins
Abstract
Selecting a field of study is an important decision made by thousands of incoming postsecondary students each year. Numerous studies have shown that graduates from engineering, business and mathematics programs earn considerably more than their counterparts from arts and humanities. These earnings disparities may reflect differences in skills that are independent of the programs themselves, rather than supply and demand conditions. Estimating earnings differences between graduates from various programs—net of pre-existing skills differences—is thus a critical first step in understanding the true value associated with the field of study choices. This article informs our understanding of this issue by estimating the earnings differences across various fields of study after adjusting for differences in high school academic performance (course marks), neighbourhood factors (income and educational attainment) and postsecondary institution effects. Using a variety of administrative data sources, British Columbia high school graduates who later completed a postsecondary certificate, diploma or bachelor’s degree program in Canada were followed in the labour market for five years after postsecondary graduation. The study found that despite important differences in high school academic performance among individuals who later completed a bachelor’s degree, the earnings ranking of the fields of study was not substantially altered after considering the differences in these measures. Interestingly, bachelor’s degree graduates of physical and life sciences and technologies programs registered average earnings (for men) or below average earnings (for women) despite being among the top academic performers in high school. By contrast, male and female graduates of business, management and public administration programs were among the highest earners despite registering average academic performance in high school. Among certificate and diploma graduates, earnings differences by field of study were smaller than among their counterparts who graduated with a bachelor’s degree, but again, high school academic performance played little to no role in understanding these differences. In general, the remaining earnings differences across postsecondary fields of study may be related to unobserved factors such as non-cognitive skills acquired before postsecondary education, or they may signal differences in the supply and demand conditions (i.e., economic returns) associated with these fields. Older survey data show that patterns in selected non-cognitive skills measured in high school are not consistent with the earnings differences by postsecondary field of study estimated in this study, suggesting that supply and demand conditions could explain earnings differences by field of study (as opposed to selection effects).
Author
Marc Frenette is with the Social Analysis and Modelling Division, Analytical Studies and Modelling Branch, Statistics Canada.
Introduction
It has been well documented that individuals with higher levels of schooling generally earn more than others shortly after postsecondary graduation (e.g., Statistics Canada 2022) and over several years following graduation (e.g., Frenette 2014). The economics literature has further demonstrated, largely through the use of natural experiments, that these earnings differences likely represent causal relationships (e.g., Lemieux and Card 2001). Similarly, several Canadian studies have demonstrated that there also exist large differences in earnings by field of study shortly after postsecondary graduation (e.g., Frenette and Handler 2020) and over several years following graduation (e.g., Ostrovsky and Frenette 2014). In general, graduates of certain science, technology, engineering and mathematics (STEM) fields—particularly those from engineering and mathematics—as well as business graduates, tend to earn more than other graduates. However, in the case of Canada, a causal relationship between the field of study choice and earnings has not been as clearly determined as in the case of the returns to different levels of schooling.Note
The purpose of this article is to further understand how field of study choice relates to individual economic outcomes by considering the role of skills that were acquired independently of the postsecondary program, as measured by high school academic performance in English, science and mathematics. Previous research has demonstrated that high school performance is a key driver of postsecondary enrolment (Frenette 2007), but it is not well established whether it plays an independent role in explaining labour market outcomes later in life. High school is the ideal time to measure skills in these areas, as it is generally the last time students are administered the same tests, and the skills were acquired independently of the postsecondary program (and thus, not related to the value of the postsecondary program).Note Note Differences in these basic skills taught in high school may be retained later in life and, as such, may affect labour market outcomes.Note
Of course, earnings may also depend on non-cognitive skills. In fact, Frenette and Frank (2017) demonstrated that the jobs held by postsecondary graduates tended to require a high level of skills in areas such as social interactions and resource management, as well as in more traditional academic areas such as writing, mathematics and science. Alternatively, earnings differences across fields of study may simply reflect supply and demand conditions (i.e., economic returns). While this study cannot consider non-cognitive skills because of data limitations, removing the influence of the more traditional academic skills represents an important step towards eventually identifying the economic returns associated with the field of study choice.
To do so, the study relies on secondary school data from British Columbia, postsecondary administrative data and personal taxation data to examine the association between the earnings of postsecondary graduates by field of study after considering differences in academic performance in high school (Grade 10 English, science and mathematics course marks).
The study then relies on older survey data to establish trends in non-cognitive skills acquired before postsecondary enrolment by field of study among postsecondary students. The non-cognitive skills examined include social engagement (participation in a community or society), self-esteem (self-worth or self-acceptance), self-efficacy (confidence to achieve a positive outcome) and mastery (having control over outcomes). Comparing these patterns across fields of study with the earnings differences estimated in this article provides additional insight into the earnings determination process by field of study.
Methodology
The analysis is based on British Columbia kindergarten to Grade 12 data, the Postsecondary Student Information System (PSIS) and the Longitudinal Worker File (LWF). The sample consists of individuals who graduated from a postsecondary certificate, diploma or bachelor’s degree program between 2010 and 2013;Note graduated from a British Columbia high school at any point and completed the provincial Grade 10 English, science and mathematics courses;Note and, for each of the five years following graduation from the postsecondary program, were not enrolled in postsecondary education, had positive T4 wages and salaries, and had no gross self-employment income.Note
An important dimension of this article is the field of study of graduates. It leans on the Classification of Instructional Programs primary groupings to operationalize this concept. Only groupings with at least 50 individuals (based on the selection criteria described above) are retained. These fields, along with their sample size in parentheses, are shown below for each of the four broader group examined (men and women with a bachelor’s degree, and men and women with a certificate or diplomaNote ).
Men with a bachelor’s degree:
- Visual and performing arts, and communications technologies (106)
- Humanities (171)
- Social and behavioural sciences and law (386)
- Business, management and public administration (868)
- Physical and life sciences and technologies (175)
- Mathematics, computer and information sciences (132)
- Architecture, engineering and related technologies (500)
- Health and related fields (103)
Women with a bachelor’s degree:
- Education (153)
- Visual and performing arts, and communications technologies (195)
- Humanities (393)
- Social and behavioural sciences and law (786)
- Business, management and public administration (902)
- Physical and life sciences and technologies (185)
- Architecture, engineering and related technologies (91)
- Health and related fields (476)
Men with a certificate or diploma:
- Visual and performing arts, and communications technologies (231)
- Social and behavioural sciences and law (102)
- Business, management and public administration (222)
- Mathematics, computer and information sciences (119)
- Architecture, engineering and related technologies (2,386)
- Agriculture (70)
- Health and related fields (143)
- Personal, protective and transportation services (497)
Women with a certificate or diploma:
- Education (104)
- Visual and performing arts, and communications technologies (268)
- Social and behavioural sciences and law (459)
- Business, management and public administration (662)
- Architecture, engineering and related technologies (157)
- Agriculture (50)
- Health and related fields (1,212)
- Personal, protective and transportation services (460)
For each of the four groups, differences in annual earnings (T4 wages and salaries)—expressed in 2021 constant
Several covariates are included in the multivariate analysis:
- Grade 10 English, science and mathematics course marks, expressed as an integer
- a binary variable indicating that the student completed the Grade 10 advanced mathematics course
- the number of course attempts in Grade 10 English, science and mathematics
- mean after-tax parental income in the neighbourhood (2021 constant dollars) and the percentage of individuals with a bachelor’s degree in the neighbourhoodNote
- age on December 31 five years after postsecondary graduation
- cohort (five years after postsecondary graduation) fixed effects
- postsecondary institution fixed effects.
From these four estimated earnings models (one for each of the four main groups in the study), the average predicted earnings were generated by field of study. To do so, predicted values for every individual in the sample were generated from the model coefficients, except that the field of study was set to a fixed value for every individual—an exercise that was repeated for every field of study. In each of these iterations (one for each field), the average predicted earnings level was recovered. While differences in these predicted values are driven by the field of study coefficients in the model, expressing the results in predicted values is visually appealing, allows for a direct comparison with unconditional results and facilitates the calculation of percentage effects. The results are shown later in charts 3 and 6.
One category of potential earnings determinants missing from the list of covariates above is non-cognitive skills. While the data used in the earnings analysis in this study do not contain measures of non-cognitive skills, it is still possible to examine patterns of non-cognitive skills by field of study among postsecondary enrollees (but not graduates) based on older data—the Youth in Transition Survey (YITS), Cohort A.
Students born in 1984 made up the target population of the YITS-A. The survey used a two-stage sampling approach. In the first stage, a random sample of schools in the 10 provinces where target students were enrolled was taken in April or May 2000 (when students were aged 15 or 16 years). In the second stage, a random sample of target students in those schools was then selected. Students were interviewed every two years for a total of six cycles (parents were also interviewed in Cycle 1). While the primary purpose of the YITS-A was to complement standardized test score data collected as part of the Programme for International Student Assessment (PISA), developed by the Organisation for Economic Co‑operation and Development (OECD), data on non-cognitive skills were also collected during Cycle 1. These data include scale measures of social engagement (participation in a community or society), self-esteem (self-worth or self-acceptance), self-efficacy (confidence to achieve a positive outcome) and mastery (having control over outcomes). Each of these scales considers responses to several questions related to the concept being measured. These non-cognitive measures can be associated with postsecondary enrolment patterns, based on data obtained in Cycle 3 (when respondents were aged 19 or 20 years). For this analysis only, men and women had to be combined in the results because of sample size limitations for certain disciplines.
Results
Science, technology, engineering and mathematics bachelor’s degree graduates were among the top students in English, science and mathematics during high school
Individuals who graduated from a STEM bachelor’s degree program had outperformed their counterparts who graduated from other programs in Grade 10 English, science and mathematics.
Beginning with men, the average (mean) marks in Grade 10 English, science and mathematics varied moderately across those who subsequently enrolled in, and graduated from, different bachelor’s degree programs (Appendix Table 1). This finding was especially true for Grade 10 English. Graduates of physical and life sciences and technologies registered an average English mark of 82.4% in Grade 10, which was followed closely by graduates of architecture, engineering and related technologies (81.7%). Other male bachelor’s degree graduates were not far behind, with average course marks ranging from 78.6% to 79.8%. The range in average marks was somewhat greater in Grade 10 science (from 77.4% for visual and performing arts, and communications technologies graduates to 87.1% for physical and life sciences and technologies graduates) and greater still in Grade 10 mathematics (from 73.9% for humanities graduates to 86.5% for architecture, engineering and related technologies graduates). Other characteristics, such as the percentage who took the advanced Grade 10 mathematics course, average parental income in the neighbourhood, percentage of individuals in the neighbourhood with an undergraduate degree and age on December 31 of the year of bachelor’s degree
The fact that academic performance in high school and other socioeconomic characteristics did not vary substantially by field of study is perhaps not surprising since, by sample design, all individuals not only enrolled in a bachelor’s degree program, but also graduated from one (both highly selective processes based largely on academic performance). However, the results in Appendix Table 1 point to average differences. Individuals who excel in a particular area (e.g., mathematics) may be far more likely to get accepted into a STEM program in their postsecondary studies.
This hypothesis is supported by the results in Chart 1, which shows the percentage of male bachelor’s degree graduates who registered a course mark of 90% or higher in Grade 10 in the three subject areas. Graduates of the following programs excelled in Grade 10 science and mathematics compared with other students: physical and life sciences and technologies; Architecture, engineering and related technologies; and mathematics, computer and information sciences. For example, 42.4% of architecture, engineering and related technologies graduates registered 90% or higher in Grade 10 mathematics, compared with 5.7% of visual and performing arts, and communications technologies graduates. Similarly, 40.6% of physical and life sciences and technologies graduates earned a course mark of at least 90% in Grade 10 science, compared with 9.1% of social and behavioural sciences and law graduates. Again, these results are not surprising given the nature of the programs involved, which typically have high entrance requirements based on science and mathematics performance in high school.
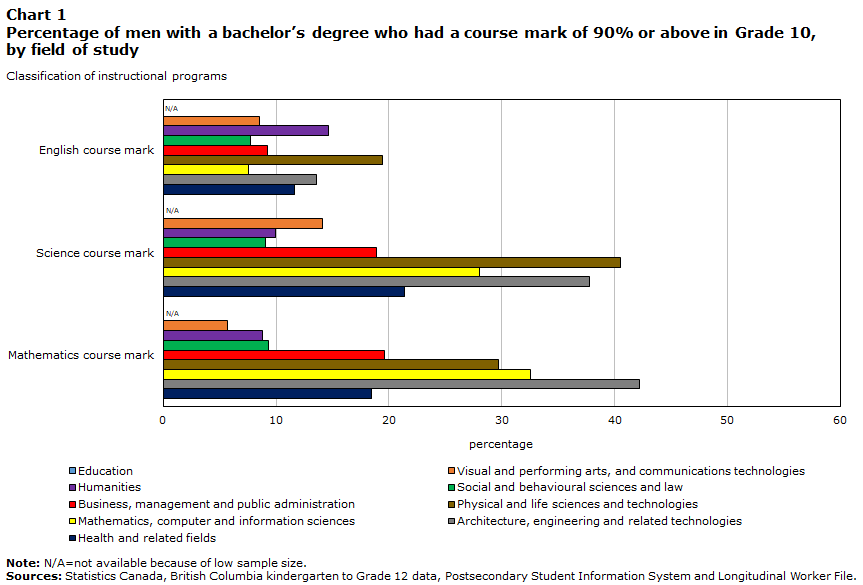
Data table for Chart 1
| English course mark | Science course mark | Mathematics course mark | |
|---|---|---|---|
| percentage | |||
| Education | N/A | N/A | N/A |
| Visual and performing arts, and communications technologies | 8.49 | 14.15 | 5.66 |
| Humanities | 14.62 | 9.94 | 8.77 |
| Social and behavioural sciences and law | 7.77 | 9.07 | 9.33 |
| Business, management and public administration | 9.22 | 18.89 | 19.59 |
| Physical and life sciences and technologies | 19.43 | 40.57 | 29.71 |
| Mathematics, computer and information sciences | 7.58 | 28.03 | 32.58 |
| Architecture, engineering and related technologies | 13.60 | 37.80 | 42.20 |
| Health and related fields | 11.65 | 21.36 | 18.45 |
|
Note: N/A=not available because of low sample size. Sources: Statistics Canada, British Columbia kindergarten to Grade 12 data, Postsecondary Student Information System and Longitudinal Worker File. |
|||
What was less well known before producing Chart 1 is the fact that physical and life sciences and technologies graduates were the most likely to be top performers in English, with 19.4% scoring at least 90% in Grade 10 courses. They were followed by graduates of humanities programs (which include English programs), with 14.6% registering at least 90% in Grade 10 English, and then by architecture, engineering and related technologies graduates (13.6% registered at least 90% in this high school course).
The results in Chart 1 (and Appendix Table 1) are interesting in light of the well-documented trends in earnings by field of study. Indeed, graduates of engineering, mathematics and business programs typically earn considerably more than graduates of other programs. However, the earnings of physical sciences graduates are usually well behind. Yet, we see from the results presented so far that physical and life sciences and technologies graduates were among the top performers in Grade 10 science, mathematics and English courses. Meanwhile, the performance of business, management and public administration graduates was about average in all three areas.
Results for women who graduated from a bachelor’s degree program are qualitatively similar, although it is important to note that it was not possible to produce estimates for female bachelor’s degree graduates in mathematics, computer and information sciences programs because of low sample sizes.
Based on average Grade 10 course marks, female bachelor’s degree graduates moderately outperformed their male counterparts regardless of their chosen field of study (Appendix Table 1). However, the patterns are more or less similar for women and men across fields of study. Specifically, average performance was highest among graduates of physical and life sciences and technologies programs and architecture, engineering and related technologies programs in all three areas (English, science and mathematics). Like men, differences across fields of study in other characteristics examined in the table were fairly small for women.
Another similarity between men and women is that STEM graduates were also the top performers (most likely to obtain a course mark of 90% or above) in all three academic areas in Grade 10. The results for women are shown in Chart 2. Slightly more than half of all female graduates of architecture, engineering and related technologies programs obtained a course mark of at least 90% in Grade 10 science (52.7%) and mathematics (50.5%). In both cases, they were followed by graduates of physical and life sciences and technologies programs (47.0% obtained 90% or higher in mathematics, whereas 40.5% did likewise in science). Much further behind were graduates of business, management and public administration programs and health and related fields.

Data table for Chart 2
| English course mark | Science course mark | Mathematics course mark | |
|---|---|---|---|
| percentage | |||
| Education | 22.22 | 12.42 | 12.42 |
| Visual and performing arts, and communications technologies | 13.85 | 8.21 | 9.74 |
| Humanities | 24.94 | 15.52 | 11.70 |
| Social and behavioural sciences and law | 15.65 | 12.60 | 13.99 |
| Business, management and public administration | 18.85 | 21.51 | 25.39 |
| Physical and life sciences and technologies | 37.30 | 40.54 | 47.03 |
| Mathematics, computer and information sciences | N/A | N/A | N/A |
| Architecture, engineering and related technologies | 28.57 | 52.75 | 50.55 |
| Health and related fields | 20.17 | 23.74 | 20.59 |
|
Note: N/A=not available because of low sample size. Sources: Statistics Canada, British Columbia kindergarten to Grade 12 data, Postsecondary Student Information System and Longitudinal Worker File. |
|||
In the case of Grade 10 English, 37.3% of all female graduates of physical and life sciences and technologies programs earned a 90% or higher course mark, followed by their counterparts from architecture, engineering and related technologies programs (38.6%). Graduates of business, management and public administration programs were in sixth place (among a total of eight fields).
Given these results, an interesting question to ask is: “How important is academic performance in understanding earnings differences across fields of study among bachelor’s degree graduates?” In interpreting the results from the next section, it is important to keep in mind that high school academic performance is a very strong predictor of postsecondary enrolment (e.g., Frenette 2007). However, conditional on enrolling in postsecondary studies, Frenette (2022) found that high school academic performance played little to no role in explaining earnings differences between students who took a gap year after high school and those who did not, and Gibson et al. (2019) found that reading proficiency at age 15 was no longer associated with earnings after leaving school once other factors were considered (including, importantly, the highest level of completed schooling). However, it is less clear how important academic performance in high school is in explaining earnings differences by field of study at the postsecondary level.
Large differences in earnings remain across bachelor’s degree fields of study after considering high school academic performance
The raw trends in mean earnings by field of study are shown in Appendix Table 1 and mirror results generated many times in the literature (e.g., Ostrovsky and Frenette 2014; Frenette and Handler 2020). For men, the fields associated with the highest annual wages and salaries (earnings) five years after graduation from a bachelor’s degree program include architecture, engineering and related technologies; mathematics, computer and information sciences; and business, management and public administration (roughly ranging from $86,000 to $91,000). They were followed by health and related fields ($74,000); physical and life sciences and technologies, and social and behavioural sciences and law ($64,000 to $66,000); and, finally, humanities, and visual and performing arts, and communications technologies ($52,000 to $57,000).
The ordering of fields of study according to mean annual earnings is almost identical for women. However, the magnitude of the disparities differs substantially in three instances. First, the gap in mean earnings between graduates from architecture, engineering and related technologies programs and their counterparts from physical and life sciences and technologies programs is much larger for women ($34,758) than for men ($24,090). This finding is explained almost entirely by the fact that earnings are considerably lower for female graduates of physical and life sciences and technologies programs. By contrast, male and female graduates of architecture, engineering and related technologies programs earn fairly similar salaries. Second, female graduates of business, management and public administration programs trail female graduates of architecture, engineering and related technologies programs by a much larger margin ($18,000) compared with their male counterparts ($5,000). Third, while graduates of humanities programs and visual and performing arts, and communications technologies programs registered the lowest annual earnings for men and women, they lagged behind other graduates considerably more in the case of male graduates from these programs.
To what extent are these trends the result of differences in academic skills in areas related to English, science and mathematics? The results in the previous section indicated some modest differences in average Grade 10 course marks in these areas across fields of study in a bachelor’s degree program, and some more notable differences with regard to top performers (i.e., those with a course mark of 90% or higher). Nevertheless, accounting for these differences, as well as differences in other characteristics shown in Appendix Table 1, did not result in any meaningful changes in the relative earnings by field of study or the rankings of the fields based on earnings or adjusted earnings.Note Chart 1 shows the adjusted earnings, along with statistical significance markers (the reference group is social and behavioural sciences and law).
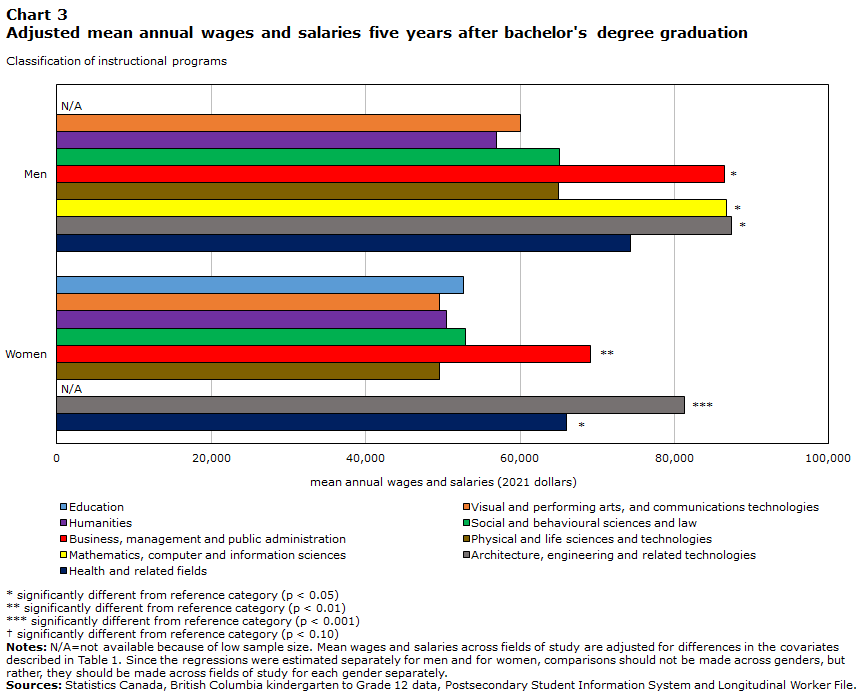
Data table for Chart 3
| Men | Women | |
|---|---|---|
| mean annual wages and salaries (2021 dollars) | ||
| Education | N/A | 52,653.10 |
| Visual and performing arts, and communications technologies | 60,100.99 | 49,541.35 |
| Humanities | 56,951.04 | 50,416.76 |
| Social and behavioural sciences and law | 65,112.70 | 52,920.68 |
| Business, management and public administration | 86,471.09Note * | 69,102.58Note ** |
| Physical and life sciences and technologies | 64,972.65 | 49,548.03 |
| Mathematics, computer and information sciences | 86,704.22Note * | N/A |
| Architecture, engineering and related technologies | 87,385.91Note * | 81,239.48Note *** |
| Health and related fields | 74,353.64 | 66,046.40Note * |
Notes: N/A=not available because of low sample size. Mean wages and salaries across fields of study are adjusted for differences in the covariates described in Table 1. Since the regressions were estimated separately for men and for women, comparisons should not be made across genders, but rather, they should be made across fields of study for each gender separately. Sources: Statistics Canada, British Columbia kindergarten to Grade 12 data, Postsecondary Student Information System and Longitudinal Worker File. |
||
The reason why accounting for differences in high school academic performance had little to no impact on the relative earnings by field of study is simple: conditional on graduating with a bachelor’s degree, high school academic performance was only weakly associated with earnings differences across fields of study.Note This finding does not mean that high school academic performance is not important for earnings. It is, but indirectly, by being a major determinant of postsecondary enrolment, based on previous research (Frenette 2007). Earnings differences across fields of study among bachelor’s degree graduates are largely not the result of differences in academic performance measured in high school.
Smaller differences in earnings exist across field of study for certificate and diploma graduates, but high school academic performance is still not a factor
Differences in average high school academic performance across certificate and diploma fields of study were somewhat smaller than what was registered among bachelor’s degree graduates (Appendix Table 2). This was also the case among top performers (charts 4 and 5), although the threshold was dropped to 80% for certificate and diploma holders since relatively few of them achieved course marks of 90% or higher in Grade 10.
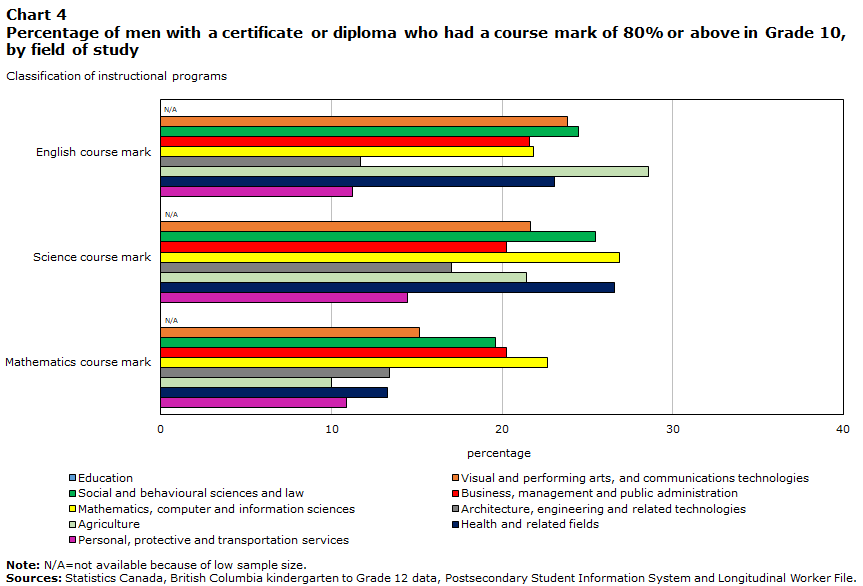
Data table for Chart 4
| English course mark | Science course mark | Mathematics course mark | |
|---|---|---|---|
| percentage | |||
| Education | N/A | N/A | N/A |
| Visual and performing arts, and communications technologies | 23.81 | 21.65 | 15.15 |
| Social and behavioural sciences and law | 24.51 | 25.49 | 19.61 |
| Business, management and public administration | 21.62 | 20.27 | 20.27 |
| Mathematics, computer and information sciences | 21.85 | 26.89 | 22.69 |
| Architecture, engineering and related technologies | 11.69 | 17.06 | 13.41 |
| Agriculture | 28.57 | 21.43 | 10.00 |
| Health and related fields | 23.08 | 26.57 | 13.29 |
| Personal, protective and transportation services | 11.27 | 14.49 | 10.87 |
|
Note: N/A=not available because of low sample size. Sources: Statistics Canada, British Columbia kindergarten to Grade 12 data, Postsecondary Student Information System and Longitudinal Worker File. |
|||
There was also considerably less variability in earnings among certificate and diploma graduates, compared with bachelor’s degree graduates (Appendix Table 2). It is thus not surprising that accounting for previous academic performance did not have any meaningful difference on the earnings patterns by field of study among certificate and diploma graduates (Chart 6). The only group whose adjusted earnings are significantly different than the reference category (social and behavioural sciences and law) was men from visual and performing arts, and communications technologies, whose adjusted earnings were well behind those of men from all other fields examined. For the most part, graduates from other disciplines generally registered fairly similar earnings.

Data table for Chart 5
| English course mark | Science course mark | Mathematics course mark | |
|---|---|---|---|
| percentage | |||
| Education | 26.92 | 13.46 | 15.38 |
| Visual and performing arts, and communications technologies | 44.78 | 26.87 | 19.78 |
| Social and behavioural sciences and law | 33.55 | 16.56 | 14.60 |
| Business, management and public administration | 36.40 | 21.75 | 17.98 |
| Mathematics, computer and information sciences | N/A | N/A | N/A |
| Architecture, engineering and related technologies | 29.30 | 21.02 | 19.11 |
| Agriculture | 52.00 | 38.00 | 22.00 |
| Health and related fields | 36.80 | 24.34 | 18.40 |
| Personal, protective and transportation services | 17.39 | 11.09 | 11.74 |
|
Note: N/A=not available because of low sample size. Sources: Statistics Canada, British Columbia kindergarten to Grade 12 data, Postsecondary Student Information System and Longitudinal Worker File. |
|||

Data table for Chart 6
| Men | Women | |
|---|---|---|
| mean annual wages and salaries (2021 dollars) | ||
| Education | N\A | 33,042.80 |
| Visual and performing arts, and communications technologies | 38,281.23Note * | 32,374.46 |
| Social and behavioural sciences and law | 53,181.84 | 38,364.06 |
| Business, management and public administration | 60,577.43 | 41,485.09 |
| Mathematics, computer and information sciences | 53,594.48 | N/A |
| Architecture, engineering and related technologies | 59,006.16 | 44,848.89 |
| Agriculture | 56,274.35 | 37,381.75 |
| Health and related fields | 52,349.03 | 43,535.08 |
| Personal, protective and transportation services | 54,622.90 | 36,194.40 |
*** significantly different from reference category (p < 0.001) † significantly different from reference category (p < 0.10) Notes: N/A=not available because of low sample size. Mean wages and salaries across fields of study are adjusted for differences in the covariates described in Table 1. Since the regressions were estimated separately for men and for women, comparisons should not be made across genders, but rather, they should be made across fields of study for each gender separately. Sources: Statistics Canada, British Columbia kindergarten to Grade 12 data, Postsecondary Student Information System and Longitudinal Worker File. |
||
Trends in non-cognitive skills in high school likely do not explain earnings differences by field of study
If pre-existing academic skills do not explain the differences in earnings by postsecondary field of study, then what does? One possibility is non-cognitive skills. Although the data used in this study contain no information on non-cognitive skills, older data from the YITS-A do. Briefly, the YITS-A sample consisted of youth born in 1984 who were initially interviewed in early 2000 (Cycle 1) and every two years thereafter, for a total of up to six interviews. A variety of questions asked of youth aged 15 or 16 years were used to develop four indexes of non-cognitive skills: social engagement (participation in a community or society), self-esteem (self-worth or self-acceptance), self-efficacy (confidence to achieve a positive outcome) and mastery (having control over outcomes). Mean values of these indexes were produced for youth who eventually enrolled in a postsecondary certificate or diploma program or in a bachelor’s degree program by the time they were aged 19 or 20 years. The results are shown in Table 1.
While there was some variability in the degree of non-cognitive skills by field of study, the patterns were generally not consistent with the adjusted earnings differences presented in charts 3 and 4. For example, youth enrolled in an architecture, engineering and related technologies bachelor’s degree program (associated with high earnings outcomes) scored relatively well in three of the four measures, and their counterparts in physical and life sciences and technologies (associated with average earnings outcomes) achieved similar scores. On all four measures, enrollees in business, management and public administration (associated with high earnings outcomes) scored lower than youth in physical and life sciences and technologies (the differences were statistically significant at 5% in each case). Education enrollees (associated with low earnings) significantly outscored students in business, management and public administration in social engagement and mastery, but the reverse was true for self-efficacy. Thus, graduates of physical and life sciences and technologies performed as well as those from architecture, engineering and related technologies in both academic and non-cognitive areas, but they still lagged in earnings.
| Social engagement (participation in a community or society) | Self-esteem (self-worth or self-acceptance) |
Self-efficacy (confidence to achieve a positive outcome) |
Mastery (having control over outcomes) |
|||||
|---|---|---|---|---|---|---|---|---|
| mean | standard error | mean | standard error | mean | standard error | mean | standard error | |
| Certificate or diploma enrollees | ||||||||
| Education | 0.244 | 0.116 | -0.248 | 0.115 | -0.192 | 0.112 | 0.134 | 0.106 |
| Visual and performing arts, and communications technologies | -0.137 | 0.064 | -0.081 | 0.060 | 0.000 | 0.055 | -0.078 | 0.062 |
| Social and behavioural sciences and law | 0.069 | 0.046 | -0.072 | 0.044 | -0.095 | 0.046 | 0.004 | 0.047 |
| Business, management and public administration | 0.089 | 0.038 | 0.041 | 0.035 | -0.106 | 0.034 | 0.002 | 0.035 |
| Mathematics, computer and information sciences | -0.212 | 0.061 | 0.230 | 0.066 | 0.340 | 0.064 | 0.148 | 0.071 |
| Architecture, engineering and related technologies | -0.156 | 0.041 | 0.018 | 0.041 | 0.069 | 0.040 | 0.038 | 0.041 |
| Agriculture, natural resources and conservation | -0.248 | 0.091 | -0.095 | 0.092 | -0.388 | 0.095 | -0.161 | 0.105 |
| Health and related fields | 0.187 | 0.047 | 0.041 | 0.051 | 0.151 | 0.048 | 0.089 | 0.052 |
| Personal, protective and transportation services | -0.103 | 0.060 | -0.034 | 0.059 | -0.234 | 0.060 | -0.043 | 0.059 |
| Bachelor's degree enrollees | ||||||||
| Education | 0.316 | 0.067 | 0.278 | 0.078 | 0.127 | 0.067 | 0.342 | 0.076 |
| Visual and performing arts, and communications technologies | -0.166 | 0.071 | 0.172 | 0.065 | 0.096 | 0.063 | -0.112 | 0.065 |
| Humanities | 0.086 | 0.036 | 0.179 | 0.035 | 0.240 | 0.032 | 0.142 | 0.033 |
| Social and behavioural sciences and law | 0.124 | 0.028 | 0.127 | 0.029 | 0.155 | 0.027 | 0.139 | 0.028 |
| Business, management and public administration | 0.039 | 0.040 | 0.166 | 0.038 | 0.281 | 0.036 | 0.049 | 0.036 |
| Physical and life sciences and technologies | 0.137 | 0.029 | 0.309 | 0.031 | 0.663 | 0.026 | 0.282 | 0.032 |
| Mathematics, computer and information sciences | -0.020 | 0.059 | 0.303 | 0.057 | 0.623 | 0.055 | 0.239 | 0.061 |
| Architecture, engineering and related technologies | -0.094 | 0.051 | 0.372 | 0.049 | 0.887 | 0.038 | 0.273 | 0.052 |
| Health and related fields | 0.185 | 0.041 | 0.190 | 0.040 | 0.226 | 0.040 | 0.151 | 0.040 |
| Source: Statistics Canada, Youth in Transition Survey, Cohort A, cycles 1 and 3. | ||||||||
Conclusion
Identifying the earnings consequences associated with fields of study is an important factor in assisting postsecondary students in their career planning. However, unlike in the literature on the returns to total educational attainment, a causal relationship between field of study choice and earnings has not been established in research. The purpose of this article was to examine the role of basic academic skills acquired before postsecondary enrolment, as measured by Grade 10 English, science and mathematics course marks, on earnings differences by field of study among a sample of postsecondary graduates.
Despite some notable differences in academic performance (particularly with regard to top performance in high school—90% or above), the study found that differences in earnings by field of study among bachelor’s degree graduates were largely unaffected after accounting for differences in performance. Interestingly, bachelor’s degree graduates of physical and life sciences and technologies programs registered average earnings (for men) or below-average earnings (for women) despite being among the top academic performers. By contrast, male and female graduates of business, management and public administration programs were among the highest earners, despite registering average academic performance in high school. Among certificate and diploma graduates, differences in earnings were somewhat smaller to begin with and, once again, largely unaffected after considering differences in performance.
What else can explain the earnings patterns by field of study? Two key possibilities are non-cognitive skills acquired before postsecondary education and economic returns (i.e., supply and demand conditions associated with the postsecondary credentials). While data limitations prevented a direct analysis of non-cognitive skills, older data suggested that the patterns of non-cognitive skills by postsecondary field of study are not consistent with the earnings differences estimated in this study. In other words, the fields of study associated with higher earnings (adjusted for academic skill differences) were not consistently associated with higher levels of non-cognitive skills. In fact, the opposite was true in many cases. An important caveat is that only four measures of non-cognitive skills could be examined: social engagement, self-esteem, self-efficacy and mastery. Other factors, such as oral communication, negotiation and persistence, may also matter.
In the end, the results presented in this article take us one step further in understanding the economic returns associated with different fields of study. Specifically, academic skills and selected non-cognitive skills acquired before postsecondary enrolment likely do not explain earnings differences by field of study. This finding suggests that these earnings differences may very well be the result of supply and demand conditions (and thus, the true economic returns) as opposed to selection effects—a finding that informs both students and policy makers.
Appendix
| Annual wages and salaries five years after bachelor's degree graduation (2021 dollars) | Grade 10 course mark | Completed the advanced Grade 10 mathematics course | Mean after-tax parental income in neighbourhood (2021 dollars) |
Percentage with a bachelor's degree in neighbourhood | Age five years after bachelor's degree graduation | |||
|---|---|---|---|---|---|---|---|---|
| English | Science | Mathematics | ||||||
| mean | ||||||||
| Men with a bachelor's degree | ||||||||
| Visual and performing arts, and communications technologies | 52,159 | 78.7 | 77.4 | 75.6 | 97.2 | 115,720 | 19.5 | 27.9 |
| Humanities | 57,111 | 79.3 | 77.9 | 73.9 | 97.7 | 113,419 | 18.8 | 27.8 |
| Social and behavioural sciences and law | 64,458 | 78.6 | 78.3 | 75.3 | 98.4 | 117,334 | 20.2 | 27.9 |
| Business, management and public administration | 85,572 | 79.7 | 81.4 | 80.0 | 99.1 | 114,455 | 19.0 | 27.7 |
| Physical and life sciences and technologies | 66,498 | 82.4 | 87.1 | 84.9 | 100.0 | 105,219 | 16.0 | 27.8 |
| Mathematics, computer and information sciences | 86,744 | 79.7 | 83.7 | 83.2 | 100.0 | 111,150 | 17.8 | 28.0 |
| Architecture, engineering and related technologies | 90,588 | 81.7 | 86.6 | 86.5 | 99.6 | 110,146 | 17.4 | 27.9 |
| Health and related fields | 74,103 | 79.8 | 81.6 | 78.1 | 99.0 | 109,083 | 16.4 | 28.0 |
| Women with a bachelor's degree | ||||||||
| Education | 52,467 | 83.7 | 80.8 | 77.0 | 99.3 | 110,872 | 14.7 | 28.2 |
| Visual and performing arts, and communications technologies | 45,639 | 80.1 | 77.4 | 74.7 | 94.4 | 112,506 | 19.5 | 27.6 |
| Humanities | 50,086 | 84.1 | 80.5 | 76.7 | 97.5 | 110,883 | 17.3 | 27.7 |
| Social and behavioural sciences and law | 53,997 | 81.7 | 79.6 | 76.6 | 98.3 | 110,966 | 18.9 | 27.8 |
| Business, management and public administration | 67,981 | 83.0 | 82.3 | 81.4 | 98.0 | 109,854 | 17.9 | 27.7 |
| Physical and life sciences and technologies | 51,056 | 86.0 | 87.9 | 87.4 | 100.0 | 104,886 | 16.8 | 27.8 |
| Architecture, engineering and related technologies | 85,814 | 85.6 | 88.2 | 88.7 | 100.0 | 117,227 | 20.1 | 27.7 |
| Health and related fields | 66,867 | 83.6 | 83.1 | 80.1 | 99.2 | 107,889 | 14.6 | 27.8 |
|
Note: The list of covariates also includes the number of course attempts (which was very close to one in all cases), high school and postsecondary institution fixed effects, and cohort (five years after graduation) fixed effects. Sources: Statistics Canada, British Columbia kindergarten to Grade 12 data, Postsecondary Student Information System and Longitudinal Worker File. |
||||||||
| Annual wages and salaries five years after certificate or diploma graduation (2021 dollars) | Grade 10 course mark | Completed the advanced Grade 10 mathematics course | Mean after-tax parental income in neighbourhood (2021 dollars) |
Percentage with a bachelor's degree in neighbourhood | Age five years after certificate or diploma graduation | |||
|---|---|---|---|---|---|---|---|---|
| English | Science | Mathematics | ||||||
| mean | ||||||||
| Men with a certificate or diploma | ||||||||
| Visual and performing arts, and communications technologies | 39,035 | 71.5 | 70.4 | 67.5 | 84.8 | 106,589 | 15.9 | 25.9 |
| Social and behavioural sciences and law | 56,223 | 73.2 | 71.9 | 68.7 | 82.4 | 105,776 | 14.8 | 26.5 |
| Business, management and public administration | 64,382 | 72.1 | 71.6 | 69.5 | 90.1 | 110,410 | 16.6 | 26.6 |
| Mathematics, computer and information sciences | 57,671 | 71.2 | 73.6 | 69.5 | 91.6 | 105,440 | 15.9 | 26.2 |
| Architecture, engineering and related technologies | 58,408 | 67.2 | 68.0 | 66.1 | 69.7 | 103,042 | 12.5 | 25.3 |
| Agriculture | 59,632 | 71.7 | 70.3 | 66.3 | 72.9 | 107,999 | 12.3 | 26.2 |
| Health and related fields | 59,326 | 71.7 | 72.0 | 67.0 | 81.8 | 102,051 | 14.1 | 26.5 |
| Personal, protective and transportation services | 51,364 | 67.3 | 67.6 | 65.1 | 67.8 | 102,449 | 14.5 | 25.6 |
| Women with a certificate or diploma | ||||||||
| Education | 30,821 | 73.2 | 67.3 | 66.4 | 61.5 | 102,798 | 12.3 | 25.9 |
| Visual and performing arts, and communications technologies | 37,603 | 77.6 | 73.0 | 68.7 | 86.2 | 110,730 | 15.7 | 26.1 |
| Social and behavioural sciences and law | 38,836 | 74.2 | 68.5 | 65.6 | 75.8 | 103,415 | 13.2 | 26.3 |
| Business, management and public administration | 43,339 | 75.3 | 71.1 | 69.1 | 81.9 | 105,853 | 14.0 | 26.3 |
| Architecture, engineering and related technologies | 46,645 | 72.1 | 70.3 | 68.6 | 76.4 | 102,977 | 12.8 | 25.7 |
| Agriculture | 36,959 | 77.9 | 75.0 | 71.9 | 82.0 | 104,216 | 11.3 | 26.1 |
| Health and related fields | 42,943 | 75.2 | 71.0 | 68.7 | 77.2 | 100,345 | 12.0 | 26.2 |
| Personal, protective and transportation services | 31,505 | 69.9 | 65.9 | 65.5 | 55.4 | 102,091 | 12.6 | 25.0 |
|
Note: The list of covariates also includes the number of course attempts (which was very close to one in all cases), high school and postsecondary institution fixed effects, and cohort (five years after graduation) fixed effects. Sources: Statistics Canada, British Columbia kindergarten to Grade 12 data, Postsecondary Student Information System and Longitudinal Worker File. |
||||||||
References
Aucejo, E., Hupkau, C. and Ruiz-Valenzuela, J. 2022. Where Versus What: College Value-Added and Returns to Field of Study in Further Education Journal of Human Resources, pre-print online version.
Frenette, M. 2007. Why Are Youth from Lower-income Families Less Likely to Attend University? Evidence from Academic Abilities, Parental Influences, and Financial Constraints (Analytical Studies Branch Research Paper Series, No. 295). Statistics Canada.
Frenette, M. 2014. An Investment of a Lifetime? The Long-term Labour Market Premiums Associated with a Postsecondary Education (Analytical Studies Branch Research Paper Series, No. 359). Statistics Canada.
Frenette, M. 2019. Obtaining a Bachelor’s Degree from a Community College: Earnings Outlook and Prospects for Graduate Studies (Analytical Studies Branch Research Paper Series,No. 428). Statistics Canada.
Frenette, M. 2022. Is Taking a Gap Year Between High School and Postsecondary Education Beneficial or Detrimental in the Long Term? (Economic and Social Reports, Vol. 2, No. 5). Statistics Canada.
Frenette, M. and Frank, K. 2017. Do Postsecondary Graduates Land High‑skilled Jobs? (Analytical Studies Branch Research Paper Series, No. 388). Statistics Canada.
Frenette, M. and Handler, T. 2020. Which Bachelor’s Degree Programs Were Associated with the Highest Pay Prior to the COVID-19 Pandemic? A Focus on Very Detailed Fields of Study (Economic Insights, No. 120). Statistics Canada.
Gibson, L., Rodriguez, C., Ferguson, S.J., Zhao, J., and Hango, D. 2019. Does Reading Proficiency at Age 15 Affect Employment Earnings in Young Adulthood? (Insights on Canadian Society, October). Statistics Canada.
Heinesen, E. and Hvid, C. 2019. Returns to Field of Study in the Medium Term – Instrumental Variables Estimates Based on Admission Thresholds (The Rockwool Foundation Research Unit Study Paper No. 136). Rockwool Foundation.
Kelly, E., O’Connell, P.J. and Smyth, E. 2010. The Economic Returns to Field of Study and Competencies Among Higher Education Graduates in Ireland Economics of Education Review, 29 (4), pp. 650-657.
Knutsen, T.K. 2017. Returns to Field of Study: Evidence from a Norwegian Reform of College Expansion (Master of Philosophy in Economics thesis). University of Oslo.
Lemieux, T. and Card, D. 2001. Education, Earnings, and the “Canadian G.I. Bill” Canadian Journal of Economics, 34 (2), pp. 313-344.
Ostrovsky, Y. and Frenette, M. 2014. The Cumulative Earnings of Postsecondary Graduates Over 20 Years: Results by Field of Study (Economic Insights, No. 40). Statistics Canada.
Statistics Canada. 2022. Labour Market Outcomes for College and University Graduates, 2010 to 2018 (Technical Reference Guides for the Education and Labour Market Longitudinal Platform [ELMLP]). Statistics Canada.
Willms, J.D. and Murray, T.S. 2007. Gaining and Losing Literacy Skills Over the Lifecourse (International Adult Literacy Survey Research Paper Series, No. 16). Statistics Canada.
- Date modified: