
Insights on Canadian Society
Does reading proficiency at age 15 affect employment earnings in young adulthood?

Archived Content
Information identified as archived is provided for reference, research or recordkeeping purposes. It is not subject to the Government of Canada Web Standards and has not been altered or updated since it was archived. Please "contact us" to request a format other than those available.
by Laura Gibson, Carlos Rodriguez, Sarah Jane Ferguson, John Zhao and Darcy Hango

Skip to text
Start of text box
Overview of the study
Previous research has suggested that skills acquired at a young age, such as reading or math skills, may have an impact on the early labour market outcomes of individuals. In this study, tax data linked to the Youth in Transition Survey (YITS) and the Programme for International Student Assessment (PISA) are used to examine the association between background factors at age 15 (including reading proficiency) and employment earnings in young adulthood for a cohort of respondents who were aged 15 in 2000.
- In 2000, 51% of women and 38% of men aged 15 had a high level of reading skills. Having a higher skill level is defined as obtaining a Level 4 or higher (out of 5) in reading tests administered through PISA.
- Young women and men with higher reading proficiency at age 15 earned more than their counterparts with lower reading proficiency, both in the first year after leaving school and in the ensuing years. These results, however, do not take into account the other factors that also affect earnings.
- After accounting for various individual and background factors (e.g., parental education, parental income, overall marks at age 15 and other characteristics such as highest level of education and field of study), reading proficiency at age 15 was no longer associated with employment earnings after leaving school—for both men and women—even in the first year after leaving school.
- For women, reading proficiency acts on career employment earnings primarily through education. This means that women with higher reading proficiency acquire more educational credentials, which—in turn—has an impact on earnings. For men, other background characteristics, such as parental income and marks at age 15, had more of an impact on employment earnings than reading skills.
End of text box
Introduction
Literacy, numeracy and problem-solving skills are generally associated with improved labour market outcomes around the world. Adults with high literacy skills are more likely to participate in the labour force and less likely to be unemployed than adults with low literacy skills.Note Furthermore, literacy, numeracy, and information and communications technology skills are positively associated with wages worldwide.Note In Canada, adults with higher literacy skills generally have higher earnings and receive fewer social transfers than their lower-skilled counterparts,Note and they are also less likely to live in low-income households.Note
Skills and educational attainment are closely related. For example, Canadian students with higher literacy skills at age 15 are often more likely to complete high school by age 21 and pursue postsecondary education than their peers with lower literacy skills.Note Higher-skilled students at age 15 who attended postsecondary programs are—in turn—more likely than their lower-skilled counterparts to study at the university level than at the non-university level.Note
Education level is also associated with improved labour market outcomes. Generally, young adults who complete a postsecondary qualification have higher earnings and are more likely to have full-time, full-year paid employment than young adults with a high school diploma.Note Having a higher level of education is also associated with higher wagesNote and, over the course of a worker’s lifetime, this wage advantage can result in a considerable increase in cumulative earnings.Note
Meanwhile, the association between education and skills is often reciprocal—education can also improve one’s skills.Note This complex relationship presents a challenge in disentangling the effect that each factor has on labour market outcomes. In past research examining literacy and educational attainment at the same time, both have been shown to have independent effects on earnings.Note Note Note
To work around the reciprocal nature of the relationship between skills and educational attainment, a useful approach is to evaluate skill levels at an earlier age—before postsecondary education. A previous report using the Youth in Transition Survey (YITS) analyzed the relationship between reading scores from the Programme for International Student Assessment (PISA) at age 15 and hourly wages six years later—at age 21.Note At age 21, high PISA reading scores were associated with higher wages for both women and men. However, in the previous research, once educational attainment and background factors were accounted for, the association between skills and wages disappeared for men, but remained among women. One limitation of this study was that few university students had graduated by age 21, and those who did graduate had not spent much time in the labour market.
In this article, the YITS is also used to obtain the reading proficiency of 15-year-olds.Note This reading assessment was carried out through PISA, which was linked to the first cycle of YITS in 2000, when the participants were 15 years old. The YITS was re-administered every 2 years for 10 years (until 2010), gathering timely and useful information on the educational attainment and other facets of life of a cohort of Canadian youth up until they were 25 years old.
Recently, the YITS and PISA data were linked to administrative tax data (the T1 Family File [T1FF]). Tax data linked to YITS and PISA are useful because they allow for an analysis of respondents’ earnings up to 2015—six years after the original survey was terminated, when the respondents were 25 (see Data sources, methods and definitions).Note Note This allows for a more comprehensive examination of the early labour market experiences of young adults in Canada. Six years is a significant period of time when studying the early careers of young people, as it may take several years for them to find secure employment in their preferred field.Note The linked data address the limitation of previous work done when respondents were 21. Tax data also allow for a study of total employment earnings over an entire year. Young adults may work multiple part-time jobs at the same time or more than one full-time contract over the course of a year.
These linked data are used to examine PISA reading scores of respondents at age 15 alongside education and background characteristics from the YITS to determine how they influence the early career employment earnings of Canadian youth. Specifically, the study poses three questions: Does reading ability at age 15—beyond influencing educational attainment—influence the employment earnings of young adults after they leave school? How do other characteristics at age 15, such as parental income and high school grades interact with reading skills to influence employment earnings after graduation? Do the effects vary based on the number of years since leaving school?
Young women had higher reading ability at age 15 than young men
As part of the initial cycle in 2000 when the YITS respondents were aged 15, the respondents were given a PISA assessment on reading (an international standardized test in which Canada participated). In PISA, reading literacy is defined as “understanding, using and reflecting on written texts, in order to achieve one’s goals, to develop one’s knowledge and potential, and to participate in society.”Note Reading ability can be divided into fiveNote proficiency levels that correspond to tasks of increasing difficulty. Level 1 indicates the lowest level of proficiency, while Level 5 indicates the highest. Essentially, these levels represent the most difficult test items that a student was able to answer. Therefore, a student at one level could be assumed to be capable of answering all of the lower-level questions. The Organisation for Economic Co-operation and Development considers a difference of one proficiency level to be “a comparatively large difference in student performance in substantive terms.”Note For this study, higher reading proficiency was defined as levels 4 and 5, and lower reading proficiency was defined as below level 1 (i.e., level 0) and levels 1, 2 and 3.
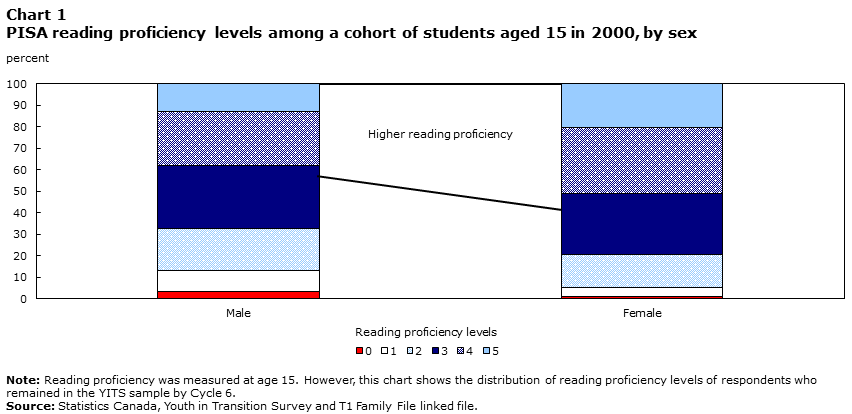
Overall, 51% of young women and 38% of young men had higher levels (4 or 5) of reading proficiency at age 15, while proportions at level 3 were the same for young women and young men (29%). Meanwhile, the proportion of young men whose reading proficiency corresponded to levels 0, 1 or 2 (33%) was higher than that of young women (20%) (Chart 1).Note
Data table for Chart 1
| Reading proficiency level | Male | Female |
|---|---|---|
| percent | ||
| 0 | 3.5 | 1.1 |
| 1 | 9.8 | 4.3 |
| 2 | 19.5 | 15.1 |
| 3 | 29.0 | 28.5 |
| 4 | 25.3 | 30.7 |
| 5 | 12.9 | 20.4 |
|
Note: Reading proficiency was measured at age 15. However, this chart shows the distribution of reading proficiency levels of respondents who remained in the YITS sample by Cycle 6. Source: Statistics Canada, Youth in Transition Survey and T1 Family File linked file. |
||
In some additional analyses, high reading proficiency was more common among youth with high parental income, regardless of gender. For instance, about 60% of young women in the fourth and fifth parental income quintiles had high reading proficiency, compared with 35% of those in the first parental income quintile. This pattern is similar for young men. Similarly, young adults whose parents had a university education had significantly higher reading scores: 52% of young men and 66% of young women who had at least one parent with a university education had high reading proficiency at age 15, compared with 26% and 37% of young men and women—respectively—whose parents had, at most, a high school diploma.
Young men and women with higher reading proficiency at age 15 had higher employment earnings than their counterparts with lower reading proficiency
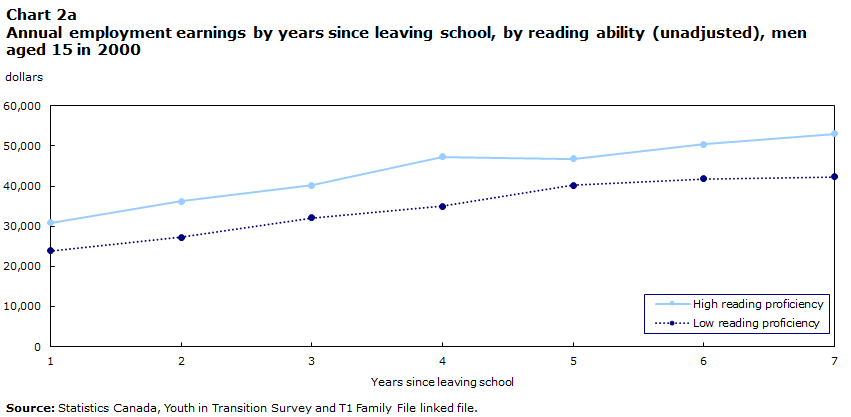
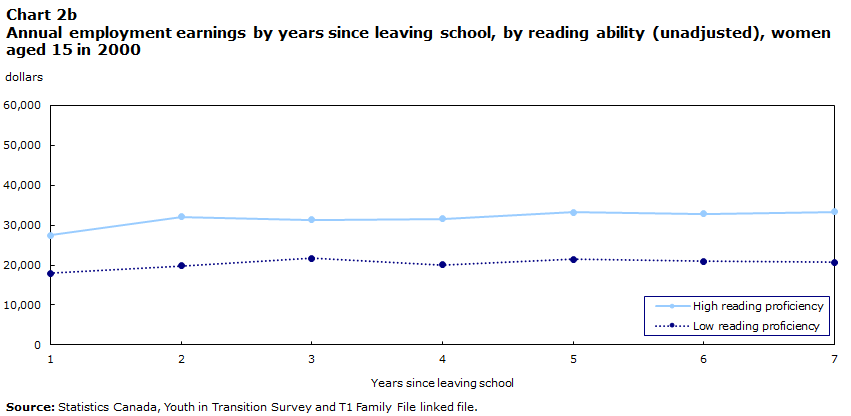
Higher skills are associated with higher average employment earnings. The same can also be said for reading proficiency in high school. Charts 2a and 2b show the average employment earnings of men and women between one and seven years since leaving school, by reading proficiency.Note The relationship between reading proficiency levels at age 15 and employment earnings appears to be stronger for women than for men, as the employment earnings gap between high and low reading levels is greater for women than men.
Data table for Chart 2a
| Years since leaving school | High reading proficiency | Low reading proficiency |
|---|---|---|
| dollars | ||
| 1 | 30,900 | 23,900 |
| 2 | 36,200 | 27,200 |
| 3 | 40,200 | 32,100 |
| 4 | 47,300 | 35,000 |
| 5 | 46,800 | 40,200 |
| 6 | 50,400 | 41,800 |
| 7 | 53,000 | 42,300 |
| Source: Statistics Canada, Youth in Transition Survey and T1 Family File linked file. | ||
Data table for Chart 2b
| Years since leaving school | High reading proficiency | Low reading proficiency |
|---|---|---|
| dollars | ||
| 1 | 27,500 | 18,000 |
| 2 | 32,100 | 19,800 |
| 3 | 31,300 | 21,700 |
| 4 | 31,600 | 20,100 |
| 5 | 33,200 | 21,500 |
| 6 | 32,800 | 21,000 |
| 7 | 33,300 | 20,700 |
| Source: Statistics Canada, Youth in Transition Survey and T1 Family File linked file. | ||
In the first year after leaving school, young women with high reading proficiency at age 15 earned about $27,500, which is 53% more than what women of the same age with low reading proficiency earned (approximately $18,000). Meanwhile, men with high reading proficiency at age 15 earned about 29% more in year 1 than their counterparts with lower levels of proficiency.
Over time, employment earnings increased regardless of reading proficiency. Employment earnings increased by 70% or more for men with both higher and lower levels of reading proficiency. For women, this increase was more modest at 15% (lower proficiency) to 21% (higher proficiency). Meanwhile, across all years, the employment earnings gap persisted between those with higher and lower reading proficiency. The results in charts 2a and 2b, however, do not control for factors that may affect employment earnings, such as hours of work, level of education, industry of employment and marital status.
The remainder of the analysis will focus on these two points of time since leaving school—year 1 and year 7—and not the years in between. These years were chosen to highlight the differences in the relationship between reading proficiency and average employment earnings soon after leaving school and then again after several years of labour market experience have been acquired. This analysis focuses on years since graduation and not age, since age at graduation varies depending on the type of postsecondary education that was attained (if any), the time taken to graduate or drop out, and the respondent’s age when they began their program.Note The role that educational attainment plays is of key importance in this study, as skills are closely related to education, and education is in turn closely related to labour market outcomes.Note
A series of ordinary least squares (OLS) regression models were estimated to attempt to isolate the effect that educational attainment has on the skills–earnings relationship.Note Logged employment earnings were used but were transformed back into dollars for interpretability, and the difference in predicted employment earnings—rather than the actual dollar amounts—was emphasized. Furthermore, because a great deal is already known about the factors that affect the earnings of men and women, the results of this study will focus on the association between reading proficiency and employment earnings and changes across model specifications.
The employment earnings of young adult men were more strongly related to high school grades than reading proficiency at age 15
Table 1a (men) and Table 1b (women) present the predicted employment earnings (expressed in differences from the reference category) in the first and seventh years after obtaining one’s highest diploma, certificate or degree by age 25 (for youth who had not graduated with a high school diploma, years since leaving school were used).Note Model 1 includes only reading proficiency as an independent variable, and results show that both men and women with higher reading proficiency earned significantly more than their lower-proficiency counterparts in both years.
| Year 1 | Year 7 | |||||
|---|---|---|---|---|---|---|
| Model 1 | Model 2 | Model 3 | Model 1 | Model 2 | Model 3 | |
| difference in employment earnings from reference category (dollars) | ||||||
| Reading proficiency level at age 15 | ||||||
| Low proficiency (ref.) | ... | ... | ... | ... | ... | ... |
| High proficiency | 7,000Note ** | 700 | 100 | 10,700Note ** | -900 | -3,300 |
| Parental income quintile (when respondents were aged 15) | ||||||
| First (ref.) | ... | ... | ... | ... | ... | ... |
| Second | ... | 4,600Note * | 4,300Note * | ... | 10,700Note * | 11,700Note ** |
| Third | ... | 2,000 | 2,300 | ... | 12,600Note ** | 13,000Note ** |
| Fourth | ... | 4,800Note * | 3,600Table 1a Note † | ... | 9,600Note * | 8,400Table 1a Note † |
| Fifth | ... | 5,300Note * | 4,700Note * | ... | 15,800Note ** | 15,300Note ** |
| Highest educational attainment of parents (when respondents were aged 15) | ||||||
| High school diploma or less (ref.) | ... | ... | ... | ... | ... | ... |
| College or trades | ... | 1,900 | 1,500 | ... | 5,100Table 1a Note † | 2,600 |
| University degree | ... | 1,900 | -400 | ... | 9,900Note ** | 3,400 |
| Immigration status | ||||||
| First generation | ... | 1,800 | 300 | ... | -3,700 | -6,600 |
| Second generation | ... | 3,000 | 1,100 | ... | 8,100Note * | 4,700 |
| Canadian born (ref.) | ... | ... | ... | ... | ... | ... |
| Grade level at age 15 | ||||||
| Grade 9 or below | ... | -2,500 | 800 | ... | -6,500Table 1a Note † | -1,500 |
| Grade 10 or above (ref.) | ... | ... | ... | ... | ... | ... |
| Overall marks at age 15 | ||||||
| Less than 55% | ... | -13,500Note ** | -11,000Note ** | ... | -18,900Table 1a Note † | -15,800 |
| 55% to 69% | ... | -2,300 | 100 | ... | -7,900Note ** | -5,300Note * |
| 70% to 79% (ref.) | ... | ... | ... | ... | ... | ... |
| 80% to 89% | ... | 5,800Note ** | 1,600 | ... | 6,200Table 1a Note † | 400 |
| 90% to 100% | ... | 7,800Note ** | 1,200 | ... | 20,500Note ** | 7,300Table 1a Note † |
| Education and field of study | ||||||
| High school diploma or less | ... | ... | -20,800Note ** | ... | ... | -38,900Note ** |
| Postsecondary education other than university, social sciences | ... | ... | -16,000Note ** | ... | ... | -31,800Note ** |
| Postsecondary education other than university, business | ... | ... | -5,300 | ... | ... | -23,900Note ** |
| Postsecondary education other than university, STEM | ... | ... | -5,000 | ... | ... | -16,000Note ** |
| Postsecondary education other than university, health | ... | ... | -20,200Note ** | ... | ... | -42,800Note ** |
| Postsecondary education other than university, other | ... | ... | -9,300Note * | ... | ... | -7,400 |
| University education, social sciences | ... | ... | -13,100Note ** | ... | ... | -24,900Note ** |
| University education, business (ref.) | ... | ... | Note ...: not applicable | ... | ... | Note ...: not applicable |
| University education, STEM | ... | ... | 100 | ... | ... | -4,300 |
| University education, health | ... | ... | 12,500Table 1a Note † | ... | ... | -500 |
| University education, other | ... | ... | 7,700 | ... | ... | 12,900 |
... not applicable
Source: Statistics Canada, Youth in Transition Survey and T1 Family File linked file. |
||||||
| Year 1 | Year 7 | |||||
|---|---|---|---|---|---|---|
| Model 1 | Model 2 | Model 3 | Model 1 | Model 2 | Model 3 | |
| difference in employment earnings from reference category (dollars) | ||||||
| Reading proficiency level at age 15 | ||||||
| Low proficiency (ref.) | ... | ... | ... | ... | ... | ... |
| High proficiency | 9,400Note ** | 2,500Table 1b Note † | 600 | 12,600Note ** | 6,300Note ** | 3,300 |
| Parental income quintile (when respondents were aged 15) | ||||||
| First (ref.) | ... | ... | ... | ... | ... | ... |
| Second | ... | 700 | -200 | ... | 3,100 | 3,900 |
| Third | ... | 4,300Note * | 2,100 | ... | 4,800 | 3,500 |
| Fourth | ... | 4,200Note * | 2,100 | ... | 3,700 | 2,300 |
| Fifth | ... | 5,700Note ** | 2,600 | ... | 3,000 | 1,800 |
| Highest educational attainment of parents (when respondents were aged 15) | ||||||
| High school diploma or less (ref.) | ... | ... | ... | ... | ... | ... |
| College or trades | ... | -2,200 | -2,100 | ... | 900 | 100 |
| University degree | ... | 1,500 | -900 | ... | 6,500Note * | 2,200 |
| Immigration status | ||||||
| First generation | ... | 3,900 | 4,000 | ... | 1,600 | 1,300 |
| Second generation | ... | 2,300 | 1,800 | Note ...: not applicable | -5,000 | -5,800Table 1b Note † |
| Canadian born (ref.) | ... | Note ...: not applicable | Note ...: not applicable | ... | Note ...: not applicable | Note ...: not applicable |
| Grade level at age 15 | ||||||
| Grade 9 or below | ... | -2,800 | 600 | ... | 300 | 3,200 |
| Grade 10 or above (ref.) | ... | ... | ... | ... | ... | ... |
| Overall marks at age 15 | ||||||
| Less than 55% | ... | -9,500Note * | -6,400 | ... | -4,400 | -900 |
| 55% to 69% | ... | -9,000Note ** | -6,700Note ** | ... | -6,100Note * | -4,200 |
| 70% to 79% (ref.) | ... | ... | ... | ... | ... | ... |
| 80% to 89% | ... | -500 | -2,900Table 1b Note † | ... | 600 | -1,800 |
| 90% to 100% | ... | 2,700 | -1,400 | ... | 6,800Note * | 2,000 |
| Education and field of study | ||||||
| High school diploma or less | ... | ... | -20,300Note ** | ... | ... | -20,800Note ** |
| Postsecondary education other than university, social sciences | ... | ... | -14,900Note ** | ... | ... | -13,200Note ** |
| Postsecondary education other than university, business | ... | ... | -8,900Note ** | ... | ... | -12,100Note * |
| Postsecondary education other than university, STEM | ... | ... | -3,800 | ... | ... | 500 |
| Postsecondary education other than university, health | ... | ... | -4,300 | ... | ... | -8,000 |
| Postsecondary education other than university, other | ... | ... | -13,000Note * | ... | ... | -14,300 |
| University education, social sciences | ... | ... | -6,100Note * | ... | ... | -5,900 |
| University education, business (ref.) | ... | ... | Note ...: not applicable | ... | ... | Note ...: not applicable |
| University education, STEM | ... | ... | 1,600 | ... | ... | 3,200 |
| University education, health | ... | ... | 5,000 | ... | ... | 5,700 |
| University education, other | ... | ... | -5,100 | ... | ... | 3,700 |
... not applicable
Source: Statistics Canada, Youth in Transition Survey and T1 Family File linked file. |
||||||
Reading proficiency, however, is not the only factor that may affect a student’s employment earnings after graduation. YITS also measured several other characteristics during the respondents’ teenage years that can influence skills, educational attainment, and ultimately employment earnings. To account for these factors, Model 2 also includes parental income and parental education of respondents at age 15; overall marks at age 15; grade level at age 15; immigration status; and additional factors measured during the year employment earnings were measured (using the T1FF), such as industry of employment, province of residence, marital status and presence of children (for women only, given that this data was not available for men).Note
The effect of reading proficiency on employment earnings for young men in both year 1 and year 7 disappeared after these factors were included. Instead, employment earnings appear to have been related more to marks—young men with marks over 80% at age 15 had significantly higher earnings than young men with marks between 70% and 79%. In year 7, the young men who had the highest marks (90% to 100%) at age 15 continued to have higher employment earnings compared with the young men who had average marks (70% to 79%), by a margin of over $20,000.
However, for women, employment earnings were significantly related to reading proficiency, but only in year 7, when women with higher reading proficiency earned $6,300 more than those with lower reading proficiency.
As was the case for men, other student background factors were also related to employment earnings for women. In year 1, young women whose parents had higher income had significantly higher employment earnings than women whose parents were in the first income quintile. Women’s academic performance was also related to earnings, but unlike for men, employment earnings were not significantly higher for women with higher marks at age 15. However, women with lower average marks at age 15 (69% or lower) earned significantly less than women with higher marks. By year 7, the effect of parental income had disappeared and that of high school marks had weakened, but the effect of reading proficiency remained significant.Note
After educational attainment and field of study are accounted for, the earnings advantage for those with higher reading proficiency at age 15 disappeared for women
In Model 3, educational attainment and field of study were added. Three categories of educational attainment and five field of study categories were used. The educational attainment categories are high school diploma or less, postsecondary education other than university and bachelor’s degree or higher. The five field of study categories are social sciences (including arts and humanities), STEM (science, technology, engineering,Note and mathematics and computer sciences), business, health and other fields. In this model, field of study and level of education variables were combined to create different fields of study for those who completed both university and non-university programs.Note
As might be expected, education and field of study are related to employment earnings for both men and women. Men with a high school diploma or less earned significantly less than their university-educated counterparts with a business degree, particularly in year 7 (by almost $40,000). Interestingly, among men, the differences across educational categories increased over time, while they remained more or less the same for women in both year 1 and year 7.
The inclusion of the education and field of study variable affected the relationship between reading skills and employment earnings to some degree, but not in the same way for men and women. For women—at both time points—educational attainment and field of study further reduced the gap in employment earnings between reading proficiency levels such that no significant gap remained. For men, the skills gap remained non-significant after Model 3, as had been the case with Model 2.Note
Furthermore, once education and field of study were added in Model 3, there was no longer a significant association between high marks at age 15 and employment earnings in year 1 or year 7 for young men. However, an association remained for young men with lower marks after year 1. For women, the negative association between low marks in high school and employment earnings also remained after accounting for educational attainment and field of study in year 1, but not in year 7. This suggests that academic success is not necessarily associated with increased employment earnings in the early careers of young men and women beyond the effect of higher educational attainment.
A relatively persistent association between parental income at age 15 and employment earnings was observed among men even in Model 3, which included education and field of study. The gaps in earnings were even wider in year 7 than in year 1. However, there was no association between parental income and employment earnings for women in Model 3.
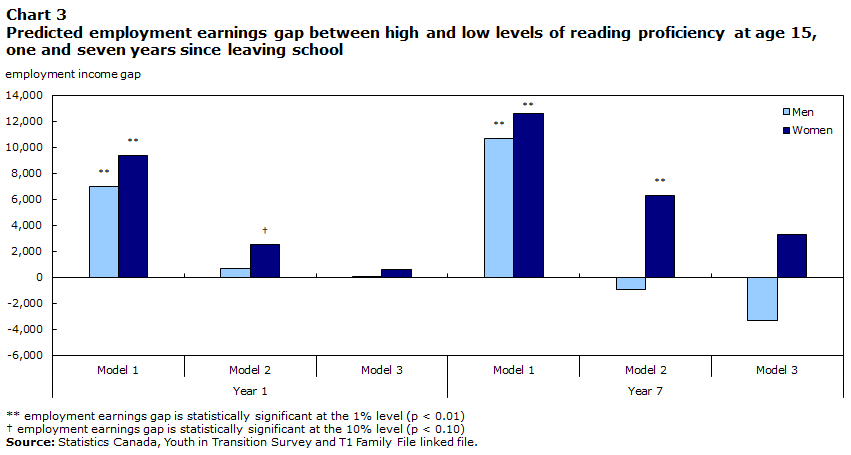
Overall, when both educational attainment and field of study were included in Model 3, the employment earnings gap attributable to reading proficiency disappeared for both genders (Chart 3). Therefore, most of the variation in employment earnings among young adults with high and low levels of reading proficiency at age 15 was explained by other factors, such as educational attainment and field of study.
Data table for Chart 3
| Year 1 | Year 7 | |||||
|---|---|---|---|---|---|---|
| Model 1 | Model 2 | Model 3 | Model 1 | Model 2 | Model 3 | |
| Men | 7,000Note ** | 700 | 100 | 10,700Note ** | -900 | -3,300 |
| Women | 9,400Note ** | 2,500Data table Note † | 600 | 12,600Note ** | 6,300Note ** | 3,300 |
|
||||||
Conclusion
The relationships between reading proficiency, educational attainment and individual characteristics are complex. This study explored how these factors influence the early career employment earnings of Canadian youth using the Youth in Transition Survey and the Programme for International Student Assessment. Before any additional factors were considered, both young men and young women with a high level of reading proficiency at age 15 had significantly higher employment earnings than their lower-proficiency counterparts.
However, student and family background factors, such as parental income at age 15 and academic performance in high school fully explained the employment earnings gap between men of higher and lower levels of reading proficiency. Among women, the employment earnings gap favouring those with high reading proficiency was significant one year after leaving school and remained seven years after leaving school, even when other background factors were included. However, when education level and field of study were considered, the significant effect of reading proficiency on employment earnings for women was no longer significant. This suggests that—at least for women—reading proficiency acts on early career employment earnings primarily through a higher level of educational attainment.
For men, reading proficiency at age 15 did not have any discernible influence on early career employment earnings. Therefore, employment earnings appear to be a product of other background factors, such as postsecondary education, parental income at age 15 and marks at age 15.
This does not imply, however, that skills do not play a role in employment earnings. Other types of skills, such as mathematical, problem-solving or social skills, could play a more important role. Furthermore, it may be the case that skills acquired later in life play a more important role. The impact of other skills could not be evaluated with these data because of sample limitations. More research will be needed to better understand the role of skills in labour market outcomes.
Laura Gibson is an analyst, John Zhao is a chief and Sarah-Jane Ferguson is a unit head and senior analyst in the Canadian Centre for Education Statistics at Statistics Canada. At the time of the study, Carlos Rodriguez was a research economist in the Canadian Centre for Education Statistics Division at Statistics Canada. Darcy Hango is a senior researcher with the Centre for Social Data Insights and Innovation at Statistics Canada.
Start of text box
Data sources, methods and definitions
Data sources
The data used in this study are from cycles 1 to 6 of the Youth in Transition Survey (YITS). In Cycle 1 of the YITS, participants were 15 years old, were in school and participated in the Programme for International Student Assessment (PISA). PISA measures students’ reading, mathematics and science literacy skills by administering tests to survey respondents. In the year 2000—when Cycle 1 took place—the primary focus of PISA was reading skills, meaning that all participants were evaluated on reading ability and then on either mathematics or science, or both. In the present study, reading proficiency was used to maximize the sample size and because a previous study on this group found that reading skills were most predictive of postsecondary enrolment.Note
Information collected from respondents’ parents in Cycle 1 includes parental education and income, mother tongue, visible minority status, and immigration status. A respondent’s highest certificate, diploma or degree is determined using data from all cycles up to age 25 (Cycle 6).
The YITS data for this study were linked to T1FF tax data. Tax data provide employment earnings information, as well as information on industry of employment and province of residence. Child tax benefits, education deductions and tuition credits were used to define other variables, but they were not included as variables of interest in this study. In year 1, 93% of Cycle 6 YITS respondents with non-zero parent weights were linked to T1FF tax data, and 62% were linked in year 7.
Sample attrition
The YITS, like all longitudinal surveys, experienced attrition across cycles. Therefore, the sample size decreased from Cycle 1 to Cycle 6. Because of this attrition, it was necessary to use Cycle 6 survey weights that account for non-response.Note
As a robustness check, reading proficiency distributions from Cycle 1 in 2000 were compared with those from Cycle 6 in 2010, separately for men and women. This analysis found that changes to reading proficiency profiles for men and women were minimal between Cycle 1 and Cycle 6. For example, in both 2000 and 2010, around 37% of men were in levels 4 or 5 for reading proficiency, while the corresponding figures for women were 48% in 2000 and 51% in 2010.
There appears to be a slight increase among women in the highest levels of reading proficiency, while there was essentially no difference among men. The slight difference in reading proficiency among women between 2000 and 2010 notwithstanding, the effect of sample attrition between YITS cycles seem to have been minimal for this study. The results of this analysis are available upon request.
Study sample
The sample in this study was limited to respondents whose parents completed the YITS questionnaire in Cycle 1, who filed a tax return in at least one year after the year they left school, who had positive employment earnings that year, who did not continue in school or return to school, and who still lived in one of the provinces of Canada. A respondent was identified as having returned to school if they were attending school in Cycle 6, or if they claimed positive amounts for the part-time or full-time education deduction or tuition fees on their taxes. Respondents were excluded from analysis for all subsequent years after returning to school. The respective unweighted sample sizes used in multivariate regressions in Tables 1a and 1b were:
- men in year 1: 2,054 respondents
- men in year 7: 1,642 respondents
- women in year 1: 2,064 respondents
- women in year 7: 1,630 respondents.
Ordinary least squares regression
Ordinary least squares regressions were used to analyze the impacts of reading proficiency on employment earnings. Logged employment earnings were used, but they were transformed back into dollars for interpretability. Only records for a respondent’s first and seventh years since graduation were included.
Definitions
Employment earnings
Employment earnings are defined as the sum of T4 employment income and other employment income as listed on T1FF tax files. T4 employment income is defined as all paid employment income (i.e., wages, salaries and commissions) before deductions. Other employment income is defined as any taxable receipts from employment other than wages, salaries and commissions. For example, it includes tips, gratuities, or director’s fees that are not reported on a T4 slip, as well as some other components that have changed over time. Both exclude self-employment income.
Parental status
Parental status was measured for women in this study using child tax benefits listed on the T1FF. Almost all (99.0%) of the T1FF records claiming child tax benefits in year 7 were for women, so it was not possible to measure parental status for men. False negatives may occur for women whose partner claims the benefits for their child. However, given the high percentage of women claimants, this number is expected to be very small.
End of text box
- Date modified: