
Economic Insights
Which Bachelor's Degree Programs Were Associated with the Highest Pay Prior to the COVID-19 Pandemic? A Focus on Very Detailed Fields of Study

Archived Content
Information identified as archived is provided for reference, research or recordkeeping purposes. It is not subject to the Government of Canada Web Standards and has not been altered or updated since it was archived. Please "contact us" to request a format other than those available.
Skip to text
Text begins
Most studies reporting earnings by field of study report results by broad grouping (e.g. engineering or humanities). However, students must select more specific programs, not broad groupings of programs. Combining postsecondary administrative and taxation data, this study is the first of three that reports on the median earnings of degree graduates five years after graduation (prior to the COVID-19 pandemic), after adjusting for age, institution, and year of graduation. Results are shown for 118 fields for men and for 123 fields for women, all at the bachelor's degree level. The key findings are that graduates of various types of engineering programs generally rank at or near the top in terms of median earnings. Pharmacy graduates and graduates of most technical disciplines also performed well. In general, graduates near the top of the list earned multiple times more than those at the bottom (two to three times more for men, and two to five times more for women). Female and male graduates of female-dominated disciplines registered a diverse range of median earnings, while those of male-dominated disciplines largely registered relatively high median earnings. The study also highlights the fact that reporting labour market outcomes by broad discipline classification (e.g. science) can be very misleading, as outcomes often vary considerably among more specific disciplines. Given the divergent outcomes by detailed fields of study that are most often grouped together in related literature, future work in the area may benefit by reporting earnings for the most detailed fields of study possible in the available data.
Introduction
While it is well-known that graduates of certain faculties (e.g. engineering) earn more than other graduates (e.g. humanities), students may benefit from more detailed information since they must select more specific disciplines (e.g. Petroleum engineering or Materials engineering). This is particularly important since the expected earnings associated with a discipline is an important factor in the decision of students (Gunderson and Krashinsky, 2009). The purpose of this study is to provide earnings estimates of graduates of specific disciplines for a very wide range of bachelor's degree graduates.
The study focuses on bachelor's degree graduates from universities and colleges between the years 2010 and 2012 from the Postsecondary Student Information System (PSIS).Note The PSIS contains information on virtually all graduates, which facilitates a detailed breakdown of disciplines.Note The median paid earningsNote (T4 wages and salaries) of graduates are observed five years later (e.g. in 2017 for the 2012 graduating class) from the T1 Family File (T1FF) for individuals who did not pursue postsecondary schooling in the five years following graduation and did not report self-employment income five years after graduation.Note In all cases, results pertain to the period prior to the COVID-19 pandemic. Importantly, individuals with zero earnings are included in this study.Note Median earnings are reported in 2017 constant dollars (from Table 18-10-005-01) and are adjusted for differences in age, institution, and year of graduation across fields of study through quantile (median) regression.Note Results are reported by the four-digit 2011 Classification of Instructional Program (CIP), separately by sex, for fields with at least 50 observations. In total, results for 118 (123) fields are reported for men (women).Note Note Note
Previously, Frenette and Frank (2016) reported earnings by detailed fields of study based on the 2011 National Household Survey (NHS), which was the only data source available to conduct such a study at that time.Note Although the NHS allowed the authors to focus on full-year, full-time workers, which provides an interesting comparison across disciplines, the sample is smaller than in PSIS. In fact, only 61 and 69 fields could be reported for male and female bachelor's degree graduates, respectively. Moreover, to obtain a large enough sample, the authors also had to include all workers between the ages of 25 and 54—many of whom graduated decades earlier. The current study builds on this work by reporting results for recent graduates in almost twice as many fields.
Most top earners are engineering graduates with various specialties
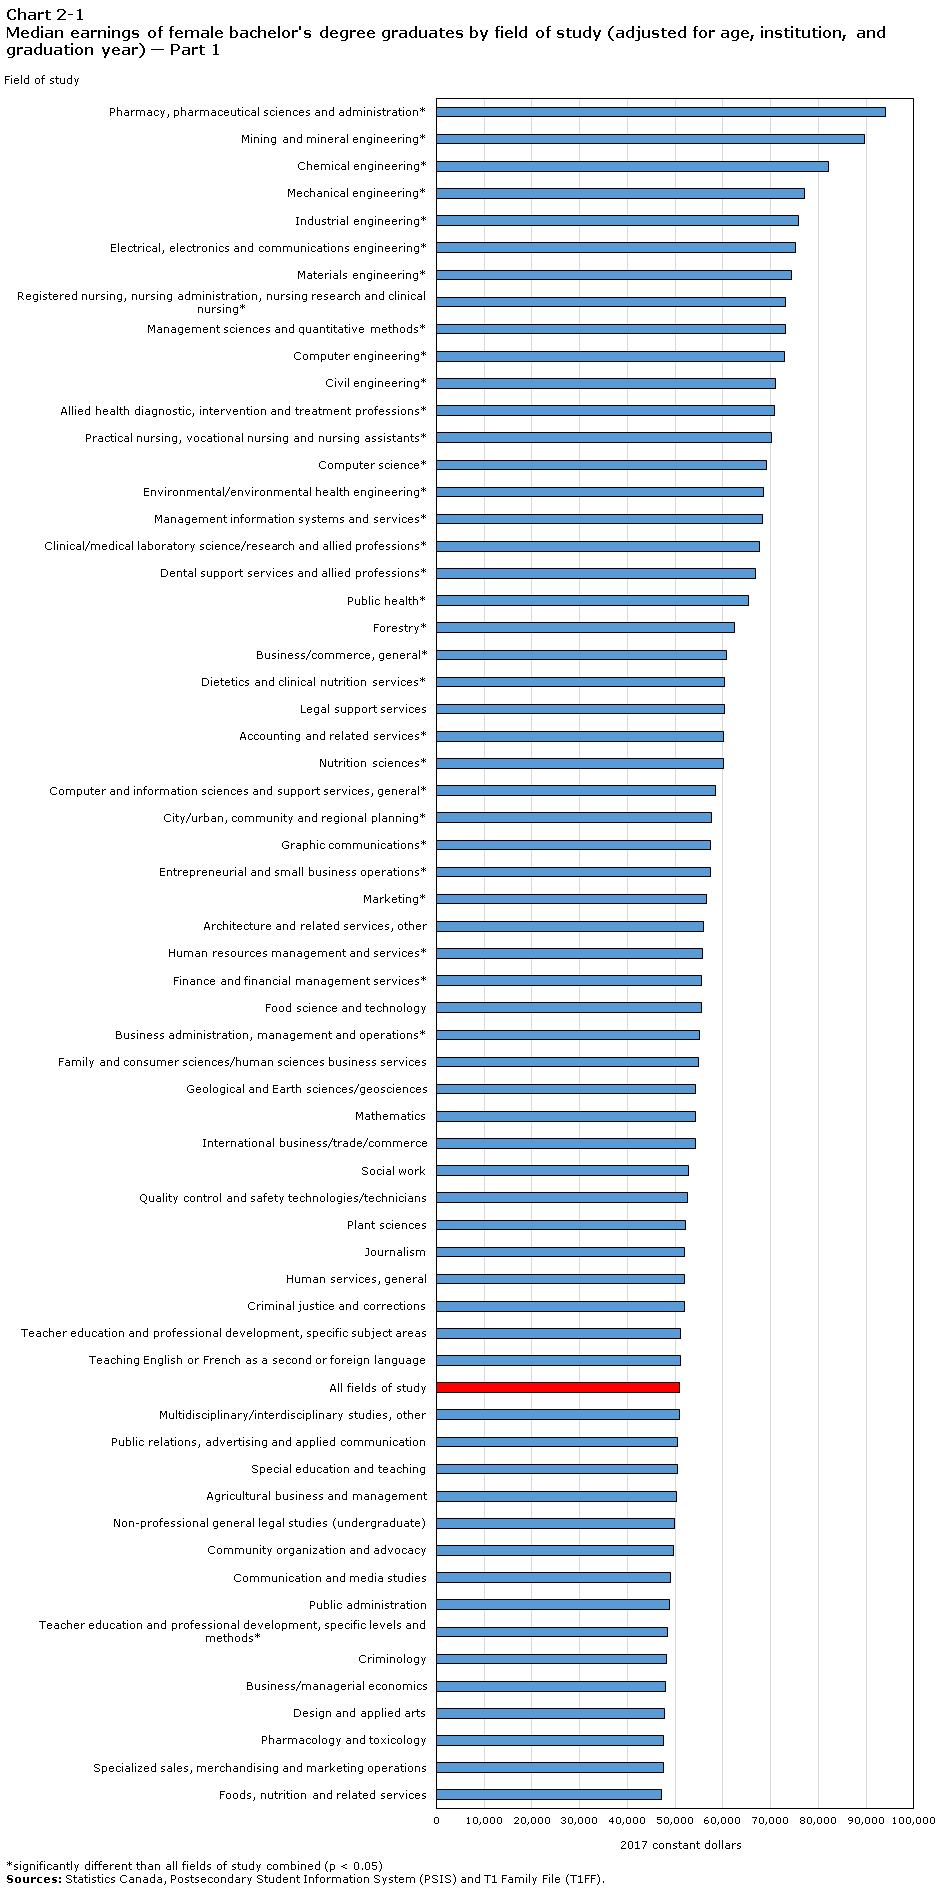
Most top-earning graduates came from various engineering specialties. In fact, 6 of the top 10 disciplines among men (Chart 1), and 7 of the top 10 disciplines among women consisted of various types of engineering specialties (Chart 2). For example, Mining and Mineral Engineering graduates ranked first among men with $111,533 in adjustedNote median earnings five years after graduation, and second among women with $89,680.Note Chemical engineering also ranked high, landing 5th among male graduates ($89,637) and 3rd among female graduates ($82,193). In total, there were 23 different types of engineering disciplines among men, all of which appeared in the top 44 of the 118 disciplines. Due to smaller samples, only 9 types of engineering graduates appeared on the list for women, and all were in the top 15 according to median earnings.
Recent advances in artificial intelligence and automation may exert upward pressure on the wages of workers involved in developing the new technology. However, male graduates of Mechatronics, robotics, and automation engineering ranked 19th among the 21 engineering disciplines for men. Engineering fields associated with natural resource extraction earned more, including graduates from Mining and mineral engineering, Petroleum engineering, and Geological/geophysical engineering.
The findings also point to important differences among fields that are typically grouped together in aggregate analyses. For example, the CIP primary groupings combine engineering and architecture graduates. However, male graduates of Architecture and related services (other) earned less than the median male bachelor's degree graduate, and well below all 23 types of engineering graduates. Women in Architecture and related services (other) also earned less than their counterparts who took any of the 9 engineering programs, but slightly above the median for all female bachelor's degree graduates.
Graduates from other disciplines also ranked among the top earners. For example, male and female Pharmacy, pharmaceutical sciences and administration graduates registered the second highest median earnings among men with $106,055, and the highest median earnings among women with $94,177. Male graduates of Computer/information technology administration and management and Mathematics and computer science, as well as female graduates of Registered nursing, nursing administration, nursing research and clinical nursing and Management sciences and quantitative methods also landed in the top 10.

Data table for Chart 1-1
| Field of study | Median |
|---|---|
| 2017 constant dollars | |
| Mining and mineral engineering* | 111,533 |
| Pharmacy, pharmaceutical sciences and administration* | 106,055 |
| Petroleum engineering* | 104,822 |
| Nuclear engineering* | 100,458 |
| Chemical engineering* | 89,637 |
| Computer/information technology administration and management* | 87,132 |
| Mathematics and computer science* | 86,076 |
| Geological/geophysical engineering* | 85,439 |
| Industrial production technologies/technicians* | 84,271 |
| Engineering science* | 82,877 |
| Systems engineering* | 82,272 |
| Engineering, general* | 82,204 |
| Registered nursing, nursing administration, nursing research and clinical nursing* | 82,079 |
| Construction management* | 81,711 |
| Computer systems networking and telecommunications* | 80,976 |
| Construction engineering* | 80,755 |
| Electrical, electronics and communications engineering* | 79,636 |
| Mechanical engineering* | 79,340 |
| Computer engineering* | 78,905 |
| Public health* | 78,506 |
| Manufacturing engineering* | 78,074 |
| Management sciences and quantitative methods* | 77,847 |
| Computer programming* | 77,776 |
| Engineering, other* | 77,497 |
| Allied health diagnostic, intervention and treatment professions* | 77,382 |
| Aerospace, aeronautical and astronautical/space engineering* | 77,176 |
| Materials engineering* | 76,738 |
| Civil engineering* | 76,451 |
| Industrial engineering* | 76,386 |
| Mechatronics, robotics, and automation engineering* | 75,422 |
| Physical sciences, general* | 75,259 |
| Computer engineering technologies/technicians* | 74,532 |
| Engineering physics/applied physics* | 74,505 |
| Engineering-related fields* | 74,146 |
| Family and consumer sciences/human sciences business services | 73,230 |
| Criminal justice and corrections* | 73,124 |
| Management information systems and services* | 72,921 |
| Computer and information sciences and support services, general* | 72,354 |
| Bioengineering and biomedical engineering | 71,998 |
| Computer science* | 71,573 |
| Environmental/environmental health engineering | 70,035 |
| Finance and financial management services* | 69,519 |
| Business/commerce, general* | 69,209 |
| Surveying engineering | 69,004 |
| Physics | 68,504 |
| Entrepreneurial and small business operations | 67,303 |
| Accounting and related services | 67,160 |
| Marketing | 66,220 |
| Forestry | 65,931 |
| City/urban, community and regional planning | 65,281 |
| All fields of study | 65,113 |
| Business administration, management and operations | 65,019 |
| Computer software and media applications | 65,014 |
| Geological and Earth sciences/geosciences | 64,969 |
| Applied mathematics | 64,382 |
| Criminology | 64,291 |
| Human resources management and services | 63,832 |
| Public administration | 63,352 |
| Special education and teaching | 63,265 |
|
*significantly different than all fields of study combined (p < 0.05) Sources: Statistics Canada, Postsecondary Student Information System (PSIS) and T1 Family File (T1FF). |
|

Data table for Chart 1-2
| Field of study | Median |
|---|---|
| 2017 constant dollars | |
| Agricultural business and management | 63,160 |
| Architecture and related services, other | 62,833 |
| Natural resources management and policy | 62,436 |
| Non-professional general legal studies (undergraduate) | 62,219 |
| Education, general | 62,178 |
| Social work | 61,975 |
| International business/trade/commerce | 61,964 |
| Mathematics | 61,850 |
| Urban studies/affairs | 61,767 |
| Teacher education and professional development, specific subject areas* | 60,855 |
| Multidisciplinary/interdisciplinary studies, other* | 60,637 |
| Teacher education and professional development, specific levels and methods* | 59,825 |
| Radio, television and digital communication | 59,765 |
| Biological and physical sciences* | 59,144 |
| Graphic communications* | 59,092 |
| Social sciences, general* | 58,706 |
| Business/managerial economics* | 58,702 |
| Teaching English or French as a second or foreign language | 58,478 |
| Public relations, advertising and applied communication* | 57,998 |
| Plant sciences | 57,646 |
| Ethnic, cultural minority, gender, and group studies* | 57,623 |
| Statistics* | 57,570 |
| Geography and cartography* | 57,036 |
| Chemistry* | 56,902 |
| Journalism* | 56,199 |
| Natural resources conservation and research* | 55,699 |
| Health services/allied health/health sciences, general* | 54,531 |
| French language and literature, general* | 54,488 |
| Political science and government* | 54,209 |
| International/global studies* | 53,722 |
| Design and applied arts* | 53,169 |
| Economics* | 53,058 |
| Health and physical education/fitness* | 52,276 |
| Communication and media studies* | 52,205 |
| Sociology* | 51,962 |
| Science, technology and society* | 51,303 |
| Ecology, evolution, systematics and population biology* | 51,301 |
| Microbiological sciences and immunology* | 51,168 |
| Biochemistry/biophysics and molecular biology* | 50,961 |
| Biology, general* | 50,843 |
| Linguistic, comparative and related language studies and services* | 50,521 |
| Psychology, general* | 50,108 |
| Liberal arts and sciences, general studies and humanities* | 49,947 |
| Hospitality administration/management* | 49,203 |
| History* | 48,567 |
| Parks, recreation and leisure studies* | 48,406 |
| Religion/religious studies* | 47,174 |
| Environmental design/architecture* | 46,805 |
| International relations and national security studies* | 46,122 |
| English rhetoric and composition/writing studies* | 45,687 |
| English language and literature, general* | 42,298 |
| Anthropology* | 42,180 |
| Philosophy, logic and ethics* | 41,650 |
| Theological and ministerial studies* | 40,509 |
| Film/video and photographic arts* | 40,330 |
| Area studies* | 40,245 |
| Fine arts and art studies* | 38,840 |
| Music* | 38,462 |
| Visual, digital and performing arts, general* | 37,559 |
| Drama/theatre arts and stagecraft* | 35,935 |
|
*significantly different than all fields of study combined (p < 0.05) Sources: Statistics Canada, Postsecondary Student Information System (PSIS) and T1 Family File (T1FF). |
|
Data table for Chart 2-1
| Field of study | Median |
|---|---|
| 2017 constant dollars | |
| Pharmacy, pharmaceutical sciences and administration* | 94,177 |
| Mining and mineral engineering* | 89,680 |
| Chemical engineering* | 82,193 |
| Mechanical engineering* | 77,144 |
| Industrial engineering* | 75,814 |
| Electrical, electronics and communications engineering* | 75,269 |
| Materials engineering* | 74,277 |
| Registered nursing, nursing administration, nursing research and clinical nursing* | 73,169 |
| Management sciences and quantitative methods* | 73,085 |
| Computer engineering* | 72,911 |
| Civil engineering* | 71,076 |
| Allied health diagnostic, intervention and treatment professions* | 70,862 |
| Practical nursing, vocational nursing and nursing assistants* | 70,180 |
| Computer science* | 69,170 |
| Environmental/environmental health engineering* | 68,581 |
| Management information systems and services* | 68,364 |
| Clinical/medical laboratory science/research and allied professions* | 67,674 |
| Dental support services and allied professions* | 66,804 |
| Public health* | 65,371 |
| Forestry* | 62,335 |
| Business/commerce, general* | 60,847 |
| Dietetics and clinical nutrition services* | 60,296 |
| Legal support services | 60,293 |
| Accounting and related services* | 60,083 |
| Nutrition sciences* | 60,071 |
| Computer and information sciences and support services, general* | 58,472 |
| City/urban, community and regional planning* | 57,647 |
| Graphic communications* | 57,507 |
| Entrepreneurial and small business operations* | 57,471 |
| Marketing* | 56,649 |
| Architecture and related services, other | 55,912 |
| Human resources management and services* | 55,689 |
| Finance and financial management services* | 55,545 |
| Food science and technology | 55,530 |
| Business administration, management and operations* | 55,148 |
| Family and consumer sciences/human sciences business services | 54,831 |
| Geological and Earth sciences/geosciences | 54,336 |
| Mathematics | 54,326 |
| International business/trade/commerce | 54,268 |
| Social work | 52,792 |
| Quality control and safety technologies/technicians | 52,510 |
| Plant sciences | 52,179 |
| Journalism | 52,043 |
| Human services, general | 51,983 |
| Criminal justice and corrections | 51,955 |
| Teacher education and professional development, specific subject areas | 51,177 |
| Teaching English or French as a second or foreign language | 51,035 |
| All fields of study | 50,986 |
| Multidisciplinary/interdisciplinary studies, other | 50,859 |
| Public relations, advertising and applied communication | 50,593 |
| Special education and teaching | 50,525 |
| Agricultural business and management | 50,286 |
| Non-professional general legal studies (undergraduate) | 49,825 |
| Community organization and advocacy | 49,584 |
| Communication and media studies | 49,111 |
| Public administration | 48,871 |
| Teacher education and professional development, specific levels and methods* | 48,330 |
| Criminology | 48,179 |
| Business/managerial economics | 47,888 |
| Design and applied arts | 47,819 |
| Pharmacology and toxicology | 47,599 |
| Specialized sales, merchandising and marketing operations | 47,534 |
| Foods, nutrition and related services | 47,222 |
|
*significantly different than all fields of study combined (p < 0.05) Sources: Statistics Canada, Postsecondary Student Information System (PSIS) and T1 Family File (T1FF). |
|

Data table for Chart 2-2
| Field of study | Median |
|---|---|
| 2017 constant dollars | |
| Animal sciences | 46,777 |
| Chemistry* | 46,491 |
| Rehabilitation and therapeutic professions | 46,369 |
| Science, technology and society | 46,308 |
| Health and medical administrative services | 46,147 |
| Clinical, counselling and applied psychology* | 45,831 |
| Radio, television and digital communication | 45,822 |
| Biochemistry/biophysics and molecular biology | 45,773 |
| Health and physical education/fitness* | 45,733 |
| Natural resources management and policy | 45,381 |
| Political science and government* | 45,328 |
| Natural resources conservation and research* | 45,204 |
| French language and literature, general* | 45,011 |
| Hospitality administration/management* | 44,726 |
| Linguistic, comparative and related language studies and services* | 44,049 |
| International/global studies* | 43,503 |
| Education, general* | 43,408 |
| Statistics | 43,271 |
| Biological and physical sciences* | 42,536 |
| Ecology, evolution, systematics and population biology* | 42,356 |
| International relations and national security studies* | 42,278 |
| Parks, recreation and leisure studies* | 42,178 |
| Peace studies and conflict resolution* | 41,673 |
| Sociology* | 41,650 |
| Psychology, general* | 41,613 |
| Geography and cartography* | 41,553 |
| Social sciences, general* | 41,542 |
| Romance languages, literatures and linguistics* | 41,311 |
| Social sciences, other* | 40,864 |
| English rhetoric and composition/writing studies* | 40,774 |
| Ethnic, cultural minority, gender, and group studies* | 40,472 |
| Biology, general* | 40,356 |
| Health services/allied health/health sciences, general* | 40,211 |
| Zoology/animal biology* | 39,870 |
| History* | 39,658 |
| Cell/cellular biology and anatomical sciences* | 39,119 |
| Liberal arts and sciences, general studies and humanities* | 39,012 |
| French literature* | 38,946 |
| Environmental design/architecture* | 38,910 |
| Microbiological sciences and immunology* | 38,849 |
| Sociology and anthropology* | 38,658 |
| Mental and social health services and allied professions* | 38,580 |
| Gerontology* | 38,443 |
| Film/video and photographic arts* | 38,351 |
| English language and literature, general* | 38,269 |
| Anthropology* | 38,121 |
| Human development, family studies and related services* | 37,438 |
| Philosophy, logic and ethics* | 37,413 |
| Student counselling and personnel services* | 36,978 |
| Economics* | 34,777 |
| Classical and ancient studies* | 34,615 |
| Visual, digital and performing arts, general* | 33,765 |
| Fine arts and art studies* | 33,206 |
| Area studies* | 33,119 |
| Research and experimental psychology* | 32,726 |
| Drama/theatre arts and stagecraft* | 32,597 |
| Classics and classical languages, literatures and linguistics* | 32,452 |
| Religion/religious studies* | 29,062 |
| Archaeology* | 26,346 |
| Music* | 22,174 |
| Bilingual, multilingual and multicultural education* | 19,892 |
|
*significantly different than all fields of study combined (p < 0.05) Sources: Statistics Canada, Postsecondary Student Information System (PSIS) and T1 Family File (T1FF). |
|
Graduates from certain programs earned multiple times more than others
Graduates in the top 10 fields generally earned multiple times more than those at the bottom. For men, median earnings ranged from $82,877 and $111,533 among disciplines in the top 10, which was generally about two to three times more than the range at the bottom ($42,298 and $35,935). For women, the disparity was even larger—$72,911 and $94,177 at the top, about two to five times more than at the bottom ($33,765 to $19,892).
Most of the disciplines associated with the lowest median earnings were in arts or humanities. In fact, 8 out of the bottom 10 fields among men and women were in arts or humanities. The lowest-paying field among male graduates was Drama/theatre arts and stagecraft ($35,935), while for women, it was Bilingual, multilingual and multicultural education ($19,892). Music graduates earned the third least for men ($38,462) and second least for women ($22,174). In the vast majority of cases, the median earnings of arts and humanities graduates were well below than the median earnings of all bachelor's degree graduates for both men and women.
Graduates from certain other disciplines outside of the arts and humanities also landed in the bottom 10. These included male and female graduates of Area studies programs, as well as male graduates of Anthropology, and female graduates of Research and experimental psychology.
Female and male graduates of female-dominated disciplines registered mixed results
Although several male-dominated disciplines ranked high in median earnings among male graduates (e.g. engineering, mathematics, or computer related fields), female-dominated disciplines (those with at least 75% of their graduates who are female) registered diverse outcomes.
In particular, nursing graduates ranked relatively high in terms of median earnings for both men and women. The median female graduate of Registered nursing, nursing administration, nursing research and clinical nursing earned $73,169 (8th on the list). They were closely followed by Practical nursing, vocational nursing and nursing assistants in 13th place with median earnings of $70,180. Although nursing is still a female-dominated area, men who chose to study Registered nursing, nursing administration, nursing research and clinical nursing also performed well in the labour market five years after graduation, with the median graduate earning $82,079 (13th among male bachelor's degree graduates).
In general, nursing graduates earned considerably more than graduates of teacher education programs. Women who graduated from Teacher education and professional development, specific levels and methods (also female-dominated) registered $48,330 in median earnings (slightly below the average for all female bachelor's degree graduates), while their male counterparts also landed below the average for all male bachelor's degree graduates with $59,825 in median earnings.
Some graduates of female-dominated programs registered outcomes that were well-below average. For example, female graduates of Bilingual, multilingual and multicultural education registered $19,892 in median earnings five years after graduation, which was last among the 123 fields that could be examined. Male graduates of Linguistic, comparative and related language studies and services also registered median earnings that were well-below the average for all male bachelor's degree graduates.
Graduates in male-dominated disciplines (those with at least 75% of their graduates who are male) generally outperformed their counterparts in female-dominated disciplines. In fact, both men and women in male-dominated disciplines registered median earnings that were above the average of all bachelor's degree graduates for their respective sexes. Male-dominated disciplines consisted primarily of engineering, computer- and business-related fields.
Broad field of study classifications hide important differences in outcomes across specific disciplines
Many studies group disciplines in broad groups for ease of presentation. However, the results reported here suggest that this approach masks important differences within these broad groups.
For example, many health-related disciplines registered median earnings that were well-above the average among all bachelor's degree graduates. These included nursing and pharmacy programs (as noted above), and also Public health for both men and women. For women, it also included several other fields, such as Allied health diagnostic, intervention and treatment professions, Dental support services and allied professions, and Dietetics and clinical nutrition services. However, many health graduates registered below-average median earnings, such as Health services/allied health/health sciences (general) for both men and women, as well as several disciplines among women (e.g. Mental and social health services and allied professions; Rehabilitation and therapeutic professions).
Other broad program areas included disciplines that registered median earnings ranging from below-average to average, for the most part. Such was the case for science fields. Many biology-related disciplines registered below-average median earnings, while some programs were associated with slightly above-average median earnings (e.g. Physics and Physical sciences among men; Plant sciences and Geological and earth sciences/geosciences among women). In all cases, the median earnings registered by science graduates (including those in Physics and Chemistry) fell below those of engineering graduates. In most instances, the median earnings of biology-related disciplines were below those of health-related disciplines.
While some types of business graduates registered relatively high median earnings (e.g. Management sciences and quantitative methods—22nd among men and 9th among women), others registered relatively low median earnings (e.g. male Hospitality administration and Management graduates). In most cases, however, business graduates ranked above average in median earnings.
The median earnings of social science graduates generally ranged from average to well-below average for both sexes. For example, Social work graduates ranked slightly above average for women, and slightly below average for men. In contrast, Economics and Sociology graduates ranked well-below average for both sexes.Note
Conclusion
This study reports on the median earnings of bachelor's degree graduates five years after graduation (prior to the COVID-19 pandemic), after adjusting for age, institution, and year of graduation. Results are shown for 118 fields for men and for 123 fields for women. This information is highly relevant to students, who must select specific disciplines and base their decisions in part on the earnings associated with disciplines.
The key findings are that graduates of various types of engineering programs generally rank at or near the top in terms of median earnings. Pharmacy graduates and graduates of other technical disciplines also predominantly performed well. In general, graduates near the top of the list earned multiple times more than those at the bottom (two to three times more for men, and two to five times more for women). Female and male graduates of female-dominated disciplines registered a diverse range of median earnings, while those of male-dominated disciplines largely registered relatively high median earnings. The study also highlights the fact that reporting labour market outcomes by broad discipline classification (e.g. science) can be very misleading, as outcomes often vary considerably among more specific disciplines.
Given the divergent outcomes by detailed fields of study that are most often grouped together in related literature, future work in the area may benefit by reporting earnings for the most detailed fields of study possible in the available data. More generally, it will be important to continue tracking the earnings of graduates in specific disciplines as the results reported should be interpreted within the context of the prevailing economic conditions of the 2010s. Sectoral shifts in demand are common and may differentially impact graduates from various disciplines (e.g. oil and other natural resource extraction), while the COVID pandemic may have longer term implications for future graduates (e.g. telework, automation, health care needs, transition to clean energy, gig employment, etc.)
References
Finnie, R., M. Miyairi, M. Dubois, T. Bonen, and B. Amery. 2019. How Much Do They Make? New Evidence on the Early Career Earnings of Canadian Post-secondary Education Graduates by Credential and Field of Study. Ottawa, ON: Education Policy Research Initiative and Labour Market Information Council.
Frank, K., and D. Walters. 2012. “Exploring the Alignment between Post-secondary Education Programs and Earnings: An Examination of 2005 Ontario Graduates.” Canadian Journal of Higher Education 42 (3): 93–115.
Frank, K., M. Frenette, and R. Morissette. 2015. Labour Market Outcomes of Young Postsecondary Graduates, 2005 to 2012. Economic Insights, no. 50. Statistics Canada Catalogue no. 11-626-X. Ottawa: Statistics Canada.
Frenette, M. 2017. Postsecondary Enrolment by Parental Income: Recent National and Provincial Trends. Economic Insights, no. 070. Statistics Canada Catalogue no. 11-626-X. Ottawa: Statistics Canada.
Frenette, M. 2019. Are the Career Prospects of Postsecondary Graduates Improving? Analytical Studies Branch Research Paper Series, no. 415. Statistics Canada Catalogue no. 11F0019M. Ottawa: Statistics Canada.
Frenette, M. and K. Frank. 2016. Earnings of Postsecondary Graduates by Detailed Fields of Study. Economic Insights, no. 56. Statistics Canada Catalogue no. 11-626-X. Ottawa: Statistics Canada.
Frenette, M. and T. Handler. 2020a. Which Master's Degree Programs Were Associated with the Highest Pay Prior to the COVID-19 Pandemic? A Focus on Very Detailed Fields of Study. Economic Insights, no. 121. Statistics Canada Catalogue no. 11-626-X. Ottawa: Statistics Canada.
Frenette, M. and T. Handler. 2020b. Which Doctoral Degree Programs Were Associated with the Highest Pay Prior to the COVID-19 Pandemic? A Focus on Very Detailed Fields of Study. Economic Insights, no. 122. Statistics Canada Catalogue no. 11-626-X. Ottawa: Statistics Canada.
Galarneau, D., C. Hinchley, and A. Ntwari. 2017. Labour Market Outcomes of Graduates from Universities in the Maritime Provinces. Statistics Canada Catalogue no. 75-006-X. Ottawa, ON: Statistics Canada.
Gunderson, M., and H. Krashinsky. 2009. Do Education Decisions Respond to Returns by Field of Study? Canadian Labour Market and Skills Researcher Network. Working Paper no. 47.
LaRochelle-Côté, S. and S. Uppal. 2011. "The Financial Well-being of the Self-employed." Perspectives on Labour and Income. Statistics Canada Catalogue no. 75-001-X. Ottawa: Statistics Canada.
Ostrovsky, Y., and M. Frenette. 2014. The Cumulative Earnings of Postsecondary Graduates Over 20 Years: Results by Major Field of Study. Economic Insights, no. 40. Statistics Canada Catalogue no. 11-626-X. Ottawa: Statistics Canada.
Stark, A. 2007. Which Fields Pay, Which Fields Don’t? An Examination of the Returns to University Education in Canada by Detailed Field of Study. Working Paper 2007-03. Ottawa: Department of Finance.
Zhao, J., S. J. Ferguson, H. Dryburgh, C. Rodriguez, and R. Subedi. 2017. Is Field of Study a Factor in the Earnings of Young Bachelor’s Degree Holders? Statistics Canada Catalogue no. 98-200-X2016023. Ottawa, ON: Statistics Canada.
- Date modified: