
Analytical Studies Branch Research Paper Series
Obtaining a Bachelor’s Degree from a Community College: Earnings Outlook and Prospects for Graduate Studies

Archived Content
Information identified as archived is provided for reference, research or recordkeeping purposes. It is not subject to the Government of Canada Web Standards and has not been altered or updated since it was archived. Please "contact us" to request a format other than those available.
Social Analysis and Modelling Division, Statistics Canada
Abstract
Traditionally, four-year bachelor’s degree programs have been available only at universities. More recently, they have been offered at some community colleges—particularly in Ontario, Alberta and British Columbia. Using linked administrative postsecondary graduate and personal income tax data, this study finds that college bachelor’s degree (CBD) holders earn about 12% more per year, on average, than university bachelor’s degree (UBD) holders two years after graduation. Almost all of this gap can be explained by the different field of study choices made by the two groups of students. Compared with their university counterparts, CBD holders were more likely to take programs in business, management and public administration or health and related fields (fields generally associated with higher-than-average earnings), and less likely to take education, humanities or social and behavioural sciences and non-professional law programs (fields generally associated with lower-than-average earnings). The remainder of the earnings gap could be explained by the fact that CBD holders were more than two years older than UBD holders, on average. The study also showed that UBD holders registered faster earnings growth between two and five years after graduation and were more likely to enroll in graduate studies than their counterparts from colleges. Moreover, CBD programs were generally concentrated in colleges that were situated near a university and associated with above-average earnings (compared with other colleges) among their diploma holders.
Executive summary
University graduates generally earn more than community college graduates, both shortly after graduation and for many years thereafter (Frenette 2019). This may partially reflect the fact that university programs are generally longer in duration. Most university students enroll in a four-year bachelor’s degree program, whereas most college students enroll in a one-year certificate program or in a two- or three-year diploma program. Recently, some colleges (mostly situated in Ontario, Alberta and British Columbia) have been offering four-year bachelor’s degree programs. Given the emergence of these new offerings, it would be informative for students, parents, education planners and employers to know whether college bachelor’s degree (CBD) programs are associated with similar labour market and educational pathways as university bachelor’s degree (UBD) programs. This is the purpose of this study.
The study uses the linked Postsecondary Student Information System–T1 Family File to follow certificate, diploma and bachelor’s degree holders from colleges and universities in Ontario, Alberta and British Columbia. Certificate and diploma programs are restricted to career, technical and professional programs, which compose the majority of such programs. Graduates from the classes of 2010 to 2013 are followed for two years after graduation, while graduates from the class of 2010 are followed for up to five years after graduation. The two main outcomes examined include annual wages and salaries and the pursuit of graduate studies.
The results indicate that CBD holders earn about 12% more per year, on average, than UBD holders two years after graduation. Almost all of this gap can be explained by the different field of study choices made by the two groups of students. Compared with their university counterparts, CBD holders were more likely to take programs in business, management and public administration or health and related fields (all of which are generally associated with higher-than-average earnings), and less likely to take education, humanities or social and behavioural sciences and non-professional law programs (all of which are generally associated with lower-than-average earnings). The remainder of the earnings gap could be explained by the fact that CBD holders were more than two years older than UBD holders, on average. The study also showed that UBD holders registered faster earnings growth between two and five years after graduation and were more likely to enroll in graduate studies than their counterparts from colleges.
Offering a bachelor’s degree option in colleges is interesting from a postsecondary education access perspective. While most Canadians have local access to a college, a non-negligible portion does not have local access to a university. Research has demonstrated that youth who grew up living out of commuting distance from a university are generally less likely to attend university and more likely to attend college (Frenette 2003). This is especially the case among youth from lower-income families. Offering bachelor’s degree programs at colleges—particularly those that serve more rural areas—may potentially provide rural youth with similar career options as urban youth. However, the study also demonstrated that CBD programs were concentrated in institutions located near universities and associated with superior labour market outcomes compared with other colleges (as evidenced by the higher-than-average earnings of their diploma holders compared with colleges where bachelor’s degree programs were not offered). Given these findings, it is not clear whether the results from this study would still apply if CBD programs were to expand to other institutions, including those in more rural or remote areas and those associated with lower earnings among their diploma graduates.
1 Introduction
Four-year bachelor’s degree programs have traditionally been the domain of universities. Students who graduate from these programs typically earn more than college graduates throughout the majority of their careers (Frenette 2019), perhaps in part because of the longer duration of university degrees.Note Bachelor’s degree programs are also a prerequisite for most university graduate programs, which are generally associated with higher pay than undergraduate programs in the same discipline (Wall et al. 2018).
In recent years, some community colleges have begun offering four-year bachelor’s degree programs.Note Colleges in British Columbia obtained the right to offer bachelor’s degrees in the late 1980s, while colleges in Alberta and Ontario secured similar entitlements in 1995 and 2000, respectively. Other provinces have followed, but the vast majority of college bachelor’s degree (CBD) programs remain in the three original provinces.Note According to Wheelahan et al. (2017), the rationale behind granting colleges the ability to offer bachelor’s degree programs usually has three components. First, and most importantly, it is to increase accessibility to longer and more in-depth studies, particularly for groups that are under-represented in universities. One such group consists of youth who grew up in a household that was too far away to allow for a daily commute to a local university. Frenette (2003) found that members of this group were considerably less likely to enroll in university, but more likely to enroll in a college instead. This substitution of college for university was more evident among lower-income youth, suggesting that distance to school may pose a financial barrier to attending. Unlike universities, colleges are for the most part locally accessible by the vast majority of Canadians—even those in most rural areas. Thus, offering CBDs raises the potential for increasing the enrolment of rural youth in longer postsecondary programs. Second, it is recognized that many occupations require more advanced learning that is possible only through longer studies. Often referred to as “applied degrees,” CBDs are generally concentrated in more specific, applied areas than university bachelor’s degree (UBD) programs. The first two reasons behind offering CBDs suggest that they can complement UBDs, either geographically or in subject matter (or both). The third reason is simply financial—offering bachelor’s degree programs in colleges may be less expensive.
Are CBDs and UBDs worth the same in the labour market? Are graduates from either type of program equally likely to pursue graduate studies? These questions are important for students contemplating their future and for their parents, as well as for education planners who must approve all new postsecondary programs. Given how recent CBD programs are, individual employers may not have enough information to assess the value of these qualifications to their firm. However, employers may benefit from knowing what value the labour market as a whole has placed on CBDs relative to UBDs.
The purpose of this study is to inform these questions by using the linked Postsecondary Student Information System (PSIS)–T1 Family File (T1FF). The study follows certificate, diploma and bachelor’s degree holders from colleges and universities in Ontario, Alberta and British Columbia. Certificate and diploma programs are restricted to career, technical and professional programs, which compose the majority of such programs. Graduates from the classes of 2010 to 2013 are followed for two years after graduation, while graduates from the class of 2010 are also followed up to five years after graduation. The two main outcomes examined include annual wages and salaries and the pursuit of graduate studies.
The next section describes the methodology in more detail. This is followed by a presentation of the results. The study results are then summarized and discussed in the conclusion.
2 Methodology
The objective of the study is to track labour market and educational outcomes of CBD and UBD program graduates. To do so, the study uses the linked PSIS–T1FF. The PSIS is an administrative database of all students enrolled in or graduated from virtually all public postsecondary institutions in Canada. Several useful pieces of information are available in the data, including the province and institution type (college or university), credential type (certificate, diploma, or bachelor’s degree), field of study, graduation date, and some basic demographic information. The T1FF is an administrative census of all Canadian taxfilers, their spouses and their children. The T1FF contains detailed information on all sources of income, as well as some basic demographic information. Reliable graduation data are available for the calendar years 2010 to 2015 in the PSIS, while tax data are available from 2005 to 2015 in the linked file. The files were linked based on the social insurance number, full name, date of birth, sex, postal code and telephone number, resulting in linkage rates that were generally well above 90%.
The sample is limited to Ontario, Alberta and British Columbia graduates of undergraduate certificate, diploma and bachelor’s degree programs at colleges and universities.Note Certificate programs are typically one year in duration, while diploma programs usually take two years to complete.Note Bachelor’s degree programs generally last four years, although for colleges, a small portion of this time (e.g., one term) often consists of a paid work assignment. Certificate and diploma holders are limited to those who enrolled in career, technical or professional training programs, which compose the majority of certificate and diploma programs. The study primarily focuses on graduates from the years 2010 to 2013, which allows for a two-year follow-up in the tax data. Specifically, graduates in those years who did not undertake further postsecondary education (PSE)Note one or two years after graduation and who reported positive annual wages and salaries,Note but no self-employment income two years after graduating, were included in the sample. These restrictions resulted in a sample consisting of 7,760 CBD holders and 171,390 UBD holders. In addition, there were 106,820 college diploma holders and 61,013 college certificate holders, as well as 5,765 university diploma holders and 8,857 university certificate holders.
The study also examined wages two and five years after graduation by looking at the 2010 cohort of graduates who did not enroll in PSE in any of the five years after graduation and who reported positive wages and salaries, but no self-employment income, two and five years after graduating. Finally, the study looked at the extent to which CBDs and UBDs are associated with graduate studies (at either the college or the university level).Note For this analysis, the study simply tracked graduates from the years 2010 to 2013 for two years after graduation in the PSIS. Anyone who had enrolled in graduate studies during the year of graduation (sometime between 2010 and 2013) or at any point during the following two calendar years was classified as having enrolled in graduate studies.
3 Results
Despite the emergence of CBDs, most bachelor’s degrees are awarded by universities (Chart 1). In total, 47.4% of the sample obtained a UBD, compared with only 2.2% who earned a CBD. In other words, only 4.3% of all bachelor’s degrees were awarded by community colleges. College graduates are far more likely to hold a certificate or a diploma than university graduates. In fact, 95.6% of college graduates in the sample obtained a certificate or diploma, compared with only 7.9% of university graduates.

Data table for Chart 1
| Institution type | Certificate | Diploma | Bachelor's degree |
|---|---|---|---|
| percent | |||
| College | 16.87 | 29.54 | 2.15 |
| University | 2.45 | 1.59 | 47.40 |
|
Note: Sample includes individuals who graduated at some point from 2010 to 2013. Source: Statistics Canada, Postsecondary Student Information System–T1 Family File. |
|||
Overall, university graduates earned more ($48,524), on average, than college graduates ($39,873) two years after graduation. This is largely because universities offer relatively more bachelor’s degree programs, which are associated with higher pay than certificate and diploma programs in both colleges and universities (Chart 2). Within each type of institution, certificate and diploma holders typically earn about the same, on average, while bachelor’s degree holders earn considerably more in both cases. Across institution types, certificate and diploma holders earn about the same on average. However, CBD holders earned about 12% more than UBD holders, on average, two years after graduation.Note
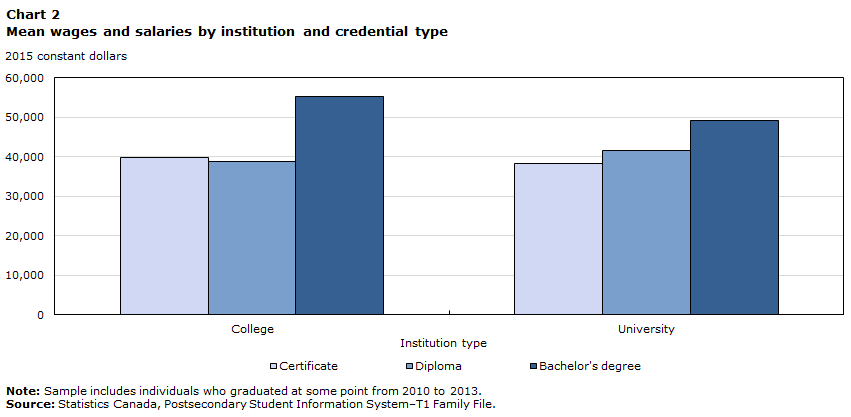
Data table for Chart 2
| Institution type | Certificate | Diploma | Bachelor's degree |
|---|---|---|---|
| 2015 constant dollars | |||
| College | 39,935.32 | 38,726.15 | 55,186.68 |
| University | 38,320.42 | 41,694.84 | 49,280.70 |
|
Note: Sample includes individuals who graduated at some point from 2010 to 2013. Source: Statistics Canada, Postsecondary Student Information System–T1 Family File. |
|||
Over time, the earnings gap between CBD and UBD holders declines. The earnings of CBD holders increased by $8,634 between two and five years following graduation—more than $3,000 below the earnings growth of UBD holders ($11,896).
The labour market is not the only possible destination for graduates. Instead, they may opt to pursue graduate studies, which could eventually lead to even higher earnings. The results in Chart 3 suggest that the percentage of UBD holders who enrolled in graduate studies within two years of graduation (11.9%) was almost five times higher than the percentage of CBD holders enrolling in graduate studies during the same period (2.5%).Note Less than 1% of any of the other groups pursued graduate studies.
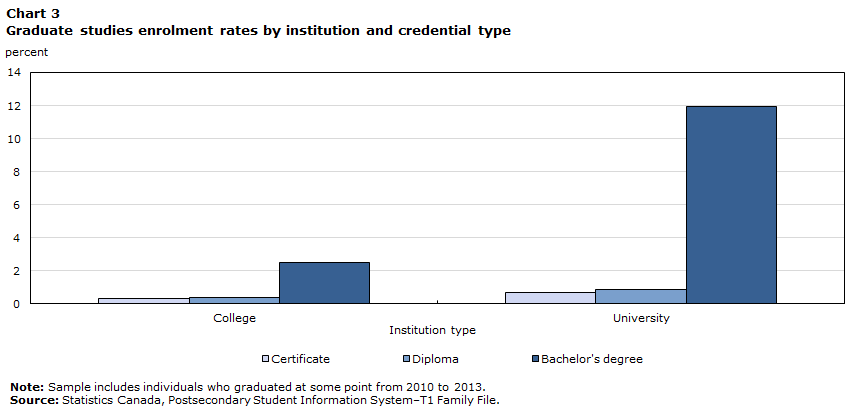
Data table for Chart 3
| Institution type | Certificate | Diploma | Bachelor's degree |
|---|---|---|---|
| percent | |||
| College | 0.33660 | 0.36537 | 2.49193 |
| University | 0.71064 | 0.89767 | 11.91668 |
|
Note: Sample includes individuals who graduated at some point from 2010 to 2013. Source: Statistics Canada, Postsecondary Student Information System–T1 Family File. |
|||
Of course, CBD and UBD holders do not necessarily share the same characteristics. Although about the same percentage of CBD and UBD holders are women (57.4% of CBD holders and 57.9% of UBD holders), CBD holders are 2.2 years older than UBD holders, on average (Table 1). Moreover, their field of study choices (denoted by the 2011 Classification of Instructional Programs [CIP] primary groupings [Statistics Canada n.d.]) are quite different. For example, CBD holders are far more likely than UBD holders to have taken programs typically associated with relatively high pay, such as business, management and public administration or health and related fields. In addition, CBD holders are less likely than UBD holders to have taken programs typically associated with relatively low pay, such as education, humanities or social and behavioural sciences and law.Note Bachelor’s degree programs at the college level are also relatively more concentrated in British Columbia (50.2% at the college level, compared with 17.9% at the university level) and less concentrated in Ontario (30.0% at the college level, compared with 62.2% at the university level).
| College | University | |||||
|---|---|---|---|---|---|---|
| Certificate | Diploma | Bachelor's degree | Certificate | Diploma | Bachelor's degree | |
| percent | ||||||
| Graduation year | ||||||
| 2010 | 24.7 | 22.6 | 19.5 | 27.9 | 24.4 | 22.6 |
| 2011 | 25.9 | 25.5 | 23.6 | 24.6 | 23.7 | 23.4 |
| 2012 | 25.1 | 25.7 | 28.1 | 25.0 | 26.3 | 26.5 |
| 2013 | 24.4 | 26.2 | 28.8 | 22.5 | 25.7 | 27.6 |
| mean | ||||||
| Age at graduation | 30.0 | 25.8 | 27.5 | 29.1 | 26.8 | 25.3 |
| percent | ||||||
| Female | 57.7 | 53.0 | 57.4 | 62.0 | 67.2 | 57.9 |
| Field of study | ||||||
| Personal improvement and leisure | 0.9 | 0.0 | 0.0 | 0.2 | 0.0 | 0.0 |
| Education | 3.1 | 1.1 | 0.4 | 5.3 | 0.6 | 8.4 |
| Visual and performing arts, and communications technologies | 2.3 | 5.6 | 7.0 | 3.3 | 13.0 | 4.1 |
| Humanities | 2.2 | 1.2 | 0.0 | 0.2 | 2.8 | 8.1 |
| Social and behavioural sciences and law | 4.6 | 13.5 | 6.8 | 11.7 | 12.3 | 22.2 |
| Business, management and public administration | 13.8 | 25.7 | 38.1 | 14.3 | 34.1 | 21.0 |
| Physical and life sciences and technologies | 0.1 | 1.2 | 0.7 | 0.0 | 0.1 | 5.4 |
| Mathematics, computer and information sciences | 2.2 | 3.1 | 4.5 | 0.6 | 4.5 | 3.1 |
| Architecture, engineering, and related technologies | 24.0 | 20.4 | 9.9 | 25.0 | 2.4 | 10.4 |
| Agriculture, natural resources and conservation | 0.8 | 1.8 | 2.8 | 4.7 | 2.1 | 1.5 |
| Health and related fields | 32.6 | 16.7 | 26.6 | 25.4 | 19.1 | 14.7 |
| Personal, protective and transportation services | 12.9 | 9.7 | 3.2 | 9.4 | 9.1 | 0.7 |
| Other | 0.7 | 0.0 | 0.1 | 0.0 | 0.0 | 0.5 |
| Province of institution | ||||||
| Ontario | 37.9 | 73.7 | 30.0 | 0.0 | 0.0 | 62.2 |
| Alberta | 22.4 | 16.9 | 19.9 | 11.1 | 53.1 | 20.0 |
| British Columbia | 39.8 | 9.4 | 50.2 | 88.9 | 46.9 | 17.9 |
|
Note: Percentages may not add up to 100.0% because of rounding. Source: Statistics Canada, Postsecondary Student Information System–T1 Family File. |
||||||
To the extent that factors such as graduation year, age, sex, field of study and province of institution determine wages and educational attainment, it is important to take them into account when comparing the outcomes of UBD and CBD holders. To that effect, gaps between CBD and UBD holders in the three outcomes variables (wages and salaries two years after graduation, absolute wage and salary growth between two and five years after graduation, and the percentage of graduates who pursued graduate studies within two years of graduating) were decomposed using the Blinder–Oaxaca method (Blinder 1973; Oaxaca 1973). The results appear in Table 2.Note
| Wages and salariesTable 2 Note 1 | Wage growthTable 2 Note 2 | Enrolled in graduate studiesTable 2 Note 3 | ||||
|---|---|---|---|---|---|---|
| coefficient | robust standard error |
coefficient | robust standard error |
coefficient | robust standard error |
|
| Gap in outcomes | 5,906Note *** | 345 | 3,262Note *** | 737 | 0.094Note *** | 0.001 |
| Explained | 6,907Note *** | 188 | 319 | 425 | 0.063Note *** | 0.001 |
| Graduation year | -7 | 6 | Note ...: not applicable | Note ...: not applicable | 0.000 | 0.000 |
| Age at graduation | 1,440Note *** | 68 | 586Note *** | 101 | 0.005Note *** | 0.000 |
| Sex | 30 | 31 | -85 | 119 | 0.000Note *** | 0.000 |
| Field of study | 5,255Note *** | 152 | -295 | 363 | 0.044Note *** | 0.001 |
| Province of institution | 189Note * | 74 | 113 | 162 | 0.014Note *** | 0.000 |
| Unexplained | -1,001Note ** | 311 | 2,943Note *** | 807 | 0.031Note *** | 0.002 |
... not applicable
Source: Statistics Canada, Postsecondary Student Information System–T1 Family File. |
||||||
After year of graduation, sex, age, age squared, province of institution and field of study (denoted by the two-digit 2011 CIP codes for primary groupings) are accounted for, CBD holders earn $1,001 less than UBD holders (statistically significant at 1%). This is indicated in the table by the coefficient associated with the unexplained component. Why do CBD holders earn considerably more than UBD holders (Chart 2), but UBD holders earn slightly more, conditional on their observed characteristics (Table 2)? The answer is that CBD holders make more lucrative field of study choices. Indeed, $5,255 (or 89.0%) of the gap in the wages and salaries between CBD and UBD holders could be explained by differences in field of study choices (significant at less than 0.1%). A further $1,440 (or 24.4%) could be explained by the fact that CBD holders are more than two years older than UBD holders (also significant at less than 0.1%).
With the same set of factors accounted for, UBD holders still registered about $3,000 more in earnings growth between two and five years following graduation than CBD holders (significant at less than 0.1%). Virtually none of the gap could be explained by the factors in the model. In other words, the field of study choices made by CBD holders generate an advantage for them over UBD holders with regard to wage levels shortly after graduation, but do not preferentially benefit CBD holders in terms of wage growth.
Recall that there was a large gap in the percentage of graduates pursuing graduate studies within two years of graduation (about 9.4 percentage points). When graduates from the same broad fields of study and with other similar characteristics are compared, the gap is reduced to 3.1 percentage points (representing a reduction of two-thirds). About two-thirds (69.2%) of this reduction is related to differences in fields of study. Another 22.4% is related to differences in the province of institution. All of these results are statistically significant at less than 0.1%.
Overall, the labour market and educational outcomes of UBD holders are slightly better than those of CBD holders with similar characteristics. However, it is clear that among college and university graduates, those with a bachelor’s degree earn considerably more than those with a certificate or diploma (Chart 2).Note Yet only universities are more likely to confer bachelor’s degrees than certificates or diplomas (Chart 1).
It is unclear whether expanding bachelor’s degree programs across more colleges would be effective in raising the earnings of college graduates. The colleges that currently offer bachelor’s degree programs are not necessarily similar to those that do not currently offer the programs. In fact, there is evidence that colleges that offer the bachelor’s degree option are associated with higher pay than other colleges. After differences in sex, age, graduation cohort, province of institution and field of study are accounted for, the earnings of diploma holders two years after graduation were $5,527 higher among those who attended a college that offered a bachelor’s degree, compared with the earnings of those who attended a college that did not.Note
Given that colleges are generally more dispersed geographically than universities, expanding CBD programs into colleges that are not situated near a university may benefit students who would otherwise not have a four-year PSE option. At the time of the study, CBD students were more likely to be enrolled in a college situated near a university, compared with college certificate and diploma students. Indeed, 96.8% of CBD holders in Ontario, Alberta and British Columbia studied in a college that was situated less than 45 minutes from a university by car.Note In comparison, 92.1% of college certificate and diploma holders in the same provinces studied at a college that was situated as close to a university.
Given these findings, it is not clear whether the results from this study would still apply if CBD programs were to expand to other institutions, including those in more rural or remote areas and those associated with lower earnings among their diploma graduates.
4 Conclusion
Historically, bachelor’s degrees have been available only to students at universities. More recently, some colleges in certain provinces (mainly Ontario, Alberta and British Columbia) have begun offering such programs to their students. The purpose of this study was to shed light on the educational and labour market prospects of graduates of college bachelor’s degree (CBD) programs in comparison with university bachelor’s degree (UBD) holders.
The results indicate that CBD holders earn about 12% more per year, on average, than UBD holders two years after graduation. Almost all of this gap can be explained by the different field of study choices made by the two groups of students. Compared with their university counterparts, CBD holders were more likely to take programs in business, management and public administration or health and related fields (fields generally associated with higher-than-average earnings), and less likely to take programs in education, humanities or social and behavioural sciences and law (fields generally associated with lower-than-average earnings). The remainder of the earnings gap could be explained by the fact that CBD holders were more than two years older than UBD holders, on average. The study also showed that UBD holders registered faster earnings growth between two and five years after graduation and were more likely to enroll in graduate studies than their counterparts from colleges. Future research could continue to follow CBD and UBD holders through the middle and later portions of their careers.
Offering a bachelor’s degree option at the college level is interesting from a postsecondary education access perspective. While most Canadians have local access to a college, a non-negligible portion does not have local access to a university. Research has demonstrated that youth who grew up living out of commuting distance from a university are generally less likely to attend university and more likely to attend college (Frenette 2003). This is especially the case among youth from lower-income families. Offering bachelor’s degree programs at colleges—particularly those that serve more rural areas—may potentially provide rural youth with similar career options as urban youth. However, the study also demonstrated that CBD programs were concentrated in institutions located near universities and associated with superior labour market outcomes compared with other colleges (as evidenced by the higher-than-average earnings of their diploma holders compared with colleges where bachelor’s degree programs were not offered).Given these findings, it is not clear whether the results from this study would still apply if CBD programs were to expand to other institutions, including those in more rural or remote areas and those associated with lower earnings among their diploma graduates.
References
Arteaga, C. 2018. “The effect of human capital on earnings: Evidence from a reform at Colombia’s top university.” Journal of Public Economics 157: 212–225.
Blinder, A.S. 1973. “Wage discrimination: Reduced form and structural estimates.” The Journal of Human Resources 8 (4): 436–455.
Frenette, M. 2003. Access to College and University: Does Distance Matter? Analytical Studies Branch Research Paper Series, no. 201. Statistics Canada Catalogue no. 11F0019M. Ottawa: Statistics Canada.
Frenette, M. 2017. Postsecondary Enrolment by Parental Income: Recent National and Provincial Trends. Economic Insights, no. 70. Statistics Canada Catalogue no. 11-626-X. Ottawa: Statistics Canada.
Frenette, M. 2019. Are the Career Prospects of Postsecondary Graduates Improving? Analytical Studies Branch Research Paper Series, no. 415. Statistics Canada Catalogue no. 11F0019M. Ottawa: Statistics Canada.
Neumark, D. 1988. “Employers’ discriminatory behavior and the estimation of wage discrimination.” Journal of Human Resources 23 (3): 279–295.
Oaxaca, R.L. 1973. “Male-female wage differentials in urban labor markets.” International Economic Review 14 (3): 693–709.
Oaxaca, R.L., and M.R. Ransom. 1994. “On discrimination and the decomposition of wage differentials.” Journal of Econometrics 61 (1): 5–21.
Statistics Canada. n.d. Variant of CIP 2011 – Primary groupings. Last updated September 16, 2019. Available at: http://www23.statcan.gc.ca/imdb/p3VD.pl?Function=getVDPage1&TVD=136268&db=imdb&dis=2&adm=8 (accessed May 31, 2019).
Wall, K., J. Zhao, S.-J. Ferguson, and C. Rodriguez. 2018. Results from the 2016 Census: Is Field of Study a Factor in the Payoff of a Graduate Degree? Insights on Canadian Society. Statistics Canada Catalogue no. 75-006-X. Ottawa: Statistics Canada.
Wheelahan, L., G. Moodie, M.L. Skolnik, Q. Liu, E.G. Adam, and D. Simpson. 2017. CAAT Baccalaureates: What Has Been Their Impact on Students and Colleges? Prepared for the Ontario Human Capital Research and Innovation Fund in the Ministry of Advanced Education and Skills Development, Government of Ontario. Toronto: Centre for the Study of Canadian and International Higher Education (CIHE).
- Date modified: