
Economic and Social Reports
Is taking a gap year between high school and postsecondary education beneficial or detrimental in the long term?
DOI: https://doi.org/10.25318/36280001202200500004-eng
Abstract
Following high school graduation, some students decide to delay their postsecondary education (PSE). This raises the issue of the long-term implications of taking a gap year. On the one hand, youth who choose this path substitute one year of lower-paying, pre-PSE work (or non-work) (i.e., the opportunity cost may be high). On the other hand, the additional year may be well needed for youth who are still discovering what they want to do for the rest of their lives. They may come back to school with greater career focus or more maturity, which could lead to improved labour market outcomes in the long term. The main question asked in this study is, “Among high school graduates who eventually registered for postsecondary studies, how do the long-term labour market outcomes compare between those who took a gap year (i.e., began their PSE between 12 and 15 months after high school graduation) and those who followed a more linear path into PSE (i.e., began their PSE within 3 months of high school graduation)?” The analysis is based on data from the Youth in Transition Survey, Cohort A, which is linked to the T1 Family File, and takes into account differences in a very rich set of characteristics, including academic performance, cognitive and non-cognitive ability, parental characteristics (presence, education, aspirations and education savings behaviour), peers, and high school fixed effects. The findings suggest a substantial negative association between taking a gap year and cumulative earnings among individuals who enrolled in a degree program shortly after high school. Specifically, men who took a gap year before enrolling in a degree program earned $57,448 (2015 constant dollars), or 11.6%, less from the ages of 17 to 31 than their counterparts who did not take a gap year. Similarly, women who took a gap year prior to enrolling in a postsecondary degree program earned $49,788 (12.5%) less over the same time span than their counterparts who did not take a gap year. Based on annual data, the negative association between taking a gap year and earnings grew more or less consistently in an absolute sense as individuals aged, at least until they were 31 years old (when the data end). In contrast, taking a gap year was positively associated with earnings among men who enrolled in a non-degree postsecondary program ($70,416, or 14.6%, more), while there was no association for their female counterparts. The study also found a small negative relationship between taking a gap year and other cumulative job characteristics over the period (number of years of union membership and with an employer-sponsored pension plan) among women who enrolled in a postsecondary degree program.
Author
Marc Frenette is with the Social Analysis and Modelling Division, Analytical Studies and Modelling Branch, Statistics Canada.
Introduction
The COVID-19 pandemic has changed the way that many people work or study. There has been a substantial increase in telework (Mehdi & Morissette, 2021), thus opening up new opportunities for job seekers who were previously constrained by geography. Combined with a re-evaluation of life priorities in light of the pandemic, this has fuelled concerns about mass job quitting, often termed the “Great Resignation.”Note Similarly, students have had to pivot to a virtual learning environment, with many postsecondary programs offered in part or in their entirety online to help reduce the spread of the virus. This may have prompted some students to consider delaying their postsecondary education (PSE)-i.e., taking a gap year-out of concern for the quality of online learning.Note
Taking a gap year between high school and PSE is not a new concept. Although there are no official statistics or definitions related to taking a gap year, a few studies have documented the incidence of delayed postsecondary entry. For example, Hango (2011) reported that 24% of Canadian high school graduates from the early 2000s delayed their postsecondary enrolment by up to 12 months, which could include full gap years as well as shorter delays (e.g., one term of 3 or 4 months). Ferrer and Menendez (2014) focused on a cohort of Canadian postsecondary graduates from the class of 1995 who entered PSE after high school and found that 17.3% delayed their entry by at least one year.
During their break from school, “gappers” may choose to acquire work experience (possibly to save money for PSE), travel domestically or abroad, volunteer, take up a new hobby, or otherwise enjoy or enrich their lives. Of course, the decision to take a gap year may have long-term economic implications, which could be positive or negative. On the positive side, taking a gap year could help students become more mature prior to starting their postsecondary studies. Having an additional year of work or life experience could also help them make more informed decisions about their future career, possibly leading to superior labour market outcomes later on. On the negative side, taking a gap year involves substituting a lower-paying year of work (or no work at all) prior to PSE—in other words, taking a gap year may involve substantial opportunity costs. Thus, it is not clear a priori how a gap year affects long-term labour market outcomes.
The purpose of this study is to estimate the impact of taking a gap year on the long-term labour outcomes of postsecondary students. More specifically, the main question asked in this study is, “Among high school graduates who eventually registered for postsecondary studies, how do the long-term labour market outcomes compare between those who took a gap year (i.e., began their PSE between 12 and 15 months after high school graduation) and those who followed a more linear path into PSE (i.e., began their PSE within 3 months of high school graduation)?” The analysis is based on data from the Youth in Transition Survey, Cohort A (YITS-A), which is linked to the T1 Family File (T1FF). Labour market outcomes are available for people aged 17 to 31 years, and include cumulative earnings over the period, the present value of cumulative earnings, the total number of years that union dues were paid and the total number of years with an employer-sponsored pension plan. These data are based on a cohort of youth born in 1984, who graduated from high school in the early 2000s.Note
Previous research on the relationship between taking a gap year and earnings has come to mixed conclusions, which could be the result of the different methodologies adopted by the studies. In Canada, two studies have examined the impact of taking a gap year on earnings shortly after postsecondary graduation. Ferrer and Menendez (2014) used the National Graduates Survey, which contains a sample of postsecondary graduates from the class of 1995, to estimate the separate effects of delaying the transition from high school to the trades, college or a bachelor’s degree, as well as the effect of delaying the transition from a bachelor’s degree to a master’s degree. They found that delaying studies resulted in positive effects on annual earnings in 1997, although the results for the transition from high school to the trades were not statistically significant. They also showed that the advantages to delaying studies were observed mainly for those who had been working in between educational credentials. The second study, conducted by Hango (2008), examined those aged 22 to 24 years in the data from the YITS, Cohort B, and found a negative association between delaying entry and weekly earnings for those who initially enrolled in university shortly after high school, as well as no association for their college counterparts.
Notably, no Canadian study has looked at the long-term impact of taking a gap year. However, two European studies did look at the issue. Crawford and Cribb (2012) used British survey data linked to academic achievement data and found that gappers in Britain registered slightly lower weekly earnings at ages 30 and 34 than students who enrolled in PSE directly, although the differences were not statistically significant. Holmlund et al. (2008) used Swedish register (administrative) data to study the impact of taking up to four gap years between high school and university. They found that taking one additional gap year resulted in 2.1% lower annual earnings at age 35. Notably, when examining cumulative lifetime earnings, Holmlund et al. (2008) found that taking one gap year (versus taking no gap year) was associated with a reduction in the present value of lifetime earnings equivalent to 21% of annual earnings at age 40 for men and 31% for women.
Delaying entry to PSE may be a highly selective decision. For example, individuals faced with a high opportunity cost of delaying their studies (i.e., those expecting to benefit more from PSE) may be less likely to delay. The identification strategies in the studies described above include using a highly descriptive approach based on no covariates (Hango, 2008); using a rich set of personal and family characteristics, including ability measures (Crawford & Cribb, 2012; Holmlund et al., 2008); and using instrumental variable estimation to complement a somewhat less extensive set of background characteristics (Ferrer & Menendez, 2014).Note
The current study contributes to the literature by producing the first Canadian estimates of the long-term implications of taking a gap year on various labour market indicators. The focus is on cumulative outcomes, as the impact of taking a gap year may be felt for many years. The identification strategy follows Crawford and Cribb (2012) and Holmlund et al. (2008) by taking into account differences in a very rich set of observable characteristics, including academic performance, cognitive and non-cognitive ability, parental characteristics (presence, education, aspirations and education savings behaviour), peers, and high school fixed effects. While the data are mostly provided by a survey, which is prone to attrition (and attrition bias) if individuals are followed for a significant period of time, the long-term follow-up data used in the study (i.e., the earnings) are available from tax data, which capture virtually everyone who is actively involved in the Canadian labour market.Note
This study will inform students and their parents on a very important career planning decision: whether to delay postsecondary studies or not. Its findings will also have broader societal implications, since taking a gap year may be associated with long-term productivity effects that could be signalled by earnings effects.
The next section describes the methodology used in the study, including the data and econometric methods used. This is followed by a presentation of the results. The study concludes with a summary of the findings and some thoughts on future research.
Methodology
The analysis is based on data from the YITS-A, which is linked to the T1FF. The target population of the YITS-A consisted of students born in 1984. A two-stage sampling approach was adopted, whereby a random sample of schools in the 10 provinces where target students were enrolled was taken in April or May 2000 in the first stage (when students were 15 or 16 years old). In the second stage, a random sample of target students in those schools was then selected. In 2000 (Cycle 1), the YITS-A consisted of a student questionnaire and a parent questionnaire. Students were then re-interviewed every two years for a total of six cycles.
In Cycle 1, students also completed the Programme for International Student Assessment (PISA), developed by the Organisation for Economic Co-operation and Development (OECD). The PISA involved a two-hour written reading test, which was the main focus of the overall assessment and was administered to all sampled students. Immediately after the reading test, about half of the students were randomly assigned to write a mathematics test, and the other half was assigned to write a science test. The PISA focused on the practical application of knowledge that students are expected to acquire in the classroom. Exam results were standardized to have an average of 500 and a standard deviation of 100 across OECD countries. A background survey was also administered to students and school administrators.
Data from the Cycle 3 youth questionnaire are used to identify gappers (i.e., those who took a gap year). At this point, youth were 19 or 20 years old, and were therefore eligible to enrol in a postsecondary program. Detailed questions about educational pathways and specific dates enable the calculation of the elapsed time between high school and postsecondary enrolment. In this study, a gap year is defined as a period of 12 to 15 months between the two. Students who enrolled more directly (i.e., within three months) serve as the comparison group.Note
The labour market outcomes used in the study are derived from the T1FF, which has been linked to the YITS-A from 2001 to 2015.Note Of primary interest, the tax data include labour market earnings, which consist of the sum of T4 wages and salaries, net self-employment income, and other employment income. The tax data also include deductions for union, professional or like dues (as a proxy for union membership), as well as for the value of registered pension plan or deferred profit-sharing plan contributions (as an indicator of having an employer-sponsored pension plan). From these three labour market outcomes-annual earnings, union membership and employer-sponsored pension plan-the following four long-term labour market outcomes are constructed:Note
- cumulative labour market earnings (the sum of annual labour market earnings from 2001 to 2015, expressed in constant 2015 dollars)
- present value of cumulative labour market earnings (the sum of annual labour market earnings from 2001 to 2015, expressed in constant 2015 dollars and discounted at a 5% rate of return)Note
- number of years of union membership (the number of years with positive deductions for union, professional or like dues from 2001 to 2015)
- number of years with an employer-sponsored pension plan (the number of years with positive registered pension plan or deferred profit-sharing plan contributions from 2001 to 2015).
Although the sample is restricted to postsecondary students (a potentially heterogeneous group), the decision to take a gap year may be determined in part by ability, which may be correlated with labour market outcomes independent of its role in determining educational attainment. Similar to that of Holmlund et al. (2008), the identification strategy adopted in this study consists of standard regressions augmented by a very rich set of covariates. In contrast to Holmlund et al. (2008), who relied on Swedish administrative data, this study uses survey data from the YITS-A. Specifically, the following covariates are constructed from Cycle 1 of the YITS-A, when high school students were 15 or 16 years old:
- academic performance (overall marks)
- cognitive ability (PISA reading score)
- non-cognitive ability (combined mastery and self-esteem score)Note
- parental presence
- parental income
- parental education
- parental aspirations for their child’s educational attainment
- parental education savings behaviour (contributed to a Registered Education Savings Plan)
- number of friends planning to further education after high school
- high school fixed effects.
Arguably, all of the above factors can impact labour market outcomes, either directly or indirectly (through educational choices). There is a rich Canadian literature on the role of the above factors in influencing postsecondary access (e.g., Frenette, 2007; Frenette, 2017), but it is less clear conceptually what role (if any) these factors play in determining labour market outcomes after conditioning on making it to university or college, as is necessarily the case when examining gap years.
The econometric models consist of regressing one of the outcome variables on the gap year indicator and the covariates listed above (described in more detail in Table 2 of the Results section of this study).Note For the two earnings outcomes, ordinary least squares models are estimated, whereas negative binomial regressions are estimated for the count measures (number of years of union membership and employer-sponsored pension plan).
Taking a gap year consists of substituting one year of potential work prior to enrolling in PSE for one year of potential work after enrolling in PSE. In other words, taking a gap year involves an opportunity cost (the difference in earnings between the year before and the year after PSE). The opportunity cost may vary across different groups of students. In this study, results are estimated separately by sex and by postsecondary enrolment type (degreeNote or non-degreeNote )-two dimensions across which the returns to schooling vary.
Therefore, there are four analytical groups of interest in this study, each categorized by whether or not they took a gap year. These are described below, along with the size of the analytical sample:
- men, non-degree postsecondary enrolment (266 gappers and 1,159 non-gappers)
- men, postsecondary degree enrolment (179 gappers and 1,499 non-gappers)
- women, non-degree postsecondary enrolment (258 gappers and 1,345 non-gappers)
- women, postsecondary degree enrolment (231 gappers and 2,592 non-gappers).
In all cases, pooled regression models based on the total 7,529 observations in the full analysis are estimated, along with interactions between the four analytical groups and the gap year indicator.
Results
Overall, 12.5% of high school graduates who later enrolled in PSE took a gap year (between 12 and 15 months) before enrolling rather than enrolling within 3 months of high school graduation. The share who took a gap year was greater among men (14.4%) than among women (11.1%), as well as among those who eventually enrolled in a non-degree postsecondary program (17.5%) compared with those who eventually enrolled in a postsecondary degree program (9.1%).
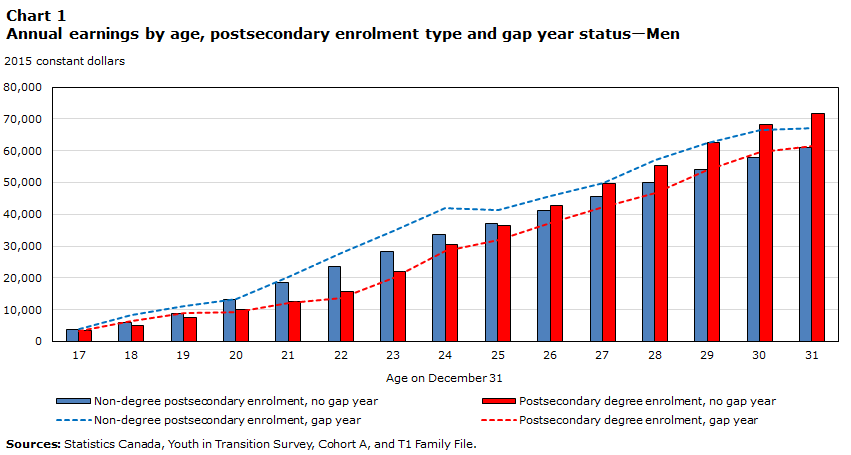
Chart 1 shows annual earnings for men for each year from ages 17 to 31 for those who enrolled in a postsecondary degree program and those who enrolled in a non-degree postsecondary program. The results are shown separately for those who did not take a gap year (represented by the solid bars) and those who took a gap year (represented by the dotted lines). Regardless of enrolment type, the annual earnings of gappers and non-gappers were virtually identical through their early 20s. Around the age of 22, the earnings of gappers who enrolled in a non-degree postsecondary program began to outpace those of their counterparts who did not take a gap year-an advantage that fluctuated between $4,000 and $8,000 throughout the remainder of the study period (up to and including the age of 31). In contrast, gappers who eventually enrolled in a degree program began to earn less around the age of 22 than their counterparts who did not take a gap year. This earnings deficit experienced by gappers continued to grow more or less consistently throughout the study period, reaching $10,271 by the age of 31.
Data table for Chart 1
| Age on December 31 | Non-degree postsecondary enrolment, no gap year | Non-degree postsecondary enrolment, gap year | Postsecondary degree enrolment, no gap year | Postsecondary degree enrolment, gap year |
|---|---|---|---|---|
| 2015 constant dollars | ||||
| 17 | 3,596.05 | 3,883.93 | 3,476.17 | 3,112.55 |
| 18 | 5,854.80 | 8,197.15 | 5,120.10 | 6,264.74 |
| 19 | 8,799.69 | 11,102.08 | 7,464.11 | 8,806.78 |
| 20 | 13,230.77 | 13,346.10 | 10,056.96 | 9,207.99 |
| 21 | 18,369.32 | 20,229.34 | 12,490.85 | 12,097.47 |
| 22 | 23,434.52 | 27,789.91 | 15,750.57 | 13,555.57 |
| 23 | 28,227.94 | 34,591.81 | 21,859.97 | 19,903.51 |
| 24 | 33,507.92 | 41,931.47 | 30,484.70 | 28,446.40 |
| 25 | 37,043.91 | 41,346.50 | 36,370.33 | 31,978.20 |
| 26 | 41,165.53 | 45,668.32 | 42,837.09 | 37,119.83 |
| 27 | 45,615.88 | 49,984.86 | 49,544.51 | 42,290.83 |
| 28 | 49,868.37 | 56,966.92 | 55,374.87 | 46,563.22 |
| 29 | 54,104.88 | 62,583.79 | 62,657.21 | 54,020.52 |
| 30 | 57,983.63 | 66,599.20 | 68,191.60 | 59,708.87 |
| 31 | 60,895.68 | 67,115.67 | 71,869.50 | 61,598.90 |
| Sources: Statistics Canada, Youth in Transition Survey, Cohort A, and T1 Family File. | ||||
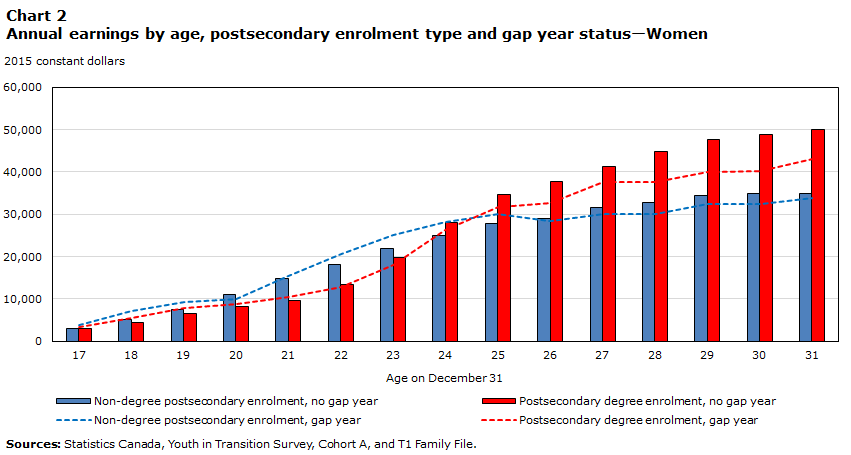
Among women, gappers who enrolled in a postsecondary degree program also earned considerably less than their counterparts who did not take a gap year (Chart 2). The difference emerged at around the age of 23 and grew more or less consistently thereafter, reaching $6,994 by age 31. Among women who enrolled in a non-degree postsecondary program, the earnings differences between gappers and non-gappers were much smaller and did not consistently favour one group over the other during the entire period.
Data table for Chart 2
| Age on December 31 | Non-degree postsecondary enrolment, no gap year | Non-degree postsecondary enrolment, gap year | Postsecondary degree enrolment, no gap year | Postsecondary degree enrolment, gap year |
|---|---|---|---|---|
| 2015 constant dollars | ||||
| 17 | 2,951.76 | 3,884.87 | 3,046.54 | 3,269.92 |
| 18 | 5,093.07 | 7,249.68 | 4,490.20 | 5,606.55 |
| 19 | 7,478.07 | 9,319.56 | 6,495.61 | 7,825.18 |
| 20 | 11,161.02 | 9,897.98 | 8,193.78 | 8,913.33 |
| 21 | 14,776.95 | 15,355.40 | 9,601.31 | 10,454.02 |
| 22 | 18,232.92 | 20,551.28 | 13,296.01 | 12,757.03 |
| 23 | 21,824.53 | 25,061.15 | 19,848.65 | 18,031.18 |
| 24 | 24,924.75 | 28,126.68 | 27,995.41 | 26,387.92 |
| 25 | 27,702.45 | 29,958.04 | 34,778.83 | 31,614.99 |
| 26 | 29,017.55 | 28,384.63 | 37,625.13 | 32,670.10 |
| 27 | 31,537.32 | 29,975.93 | 41,366.18 | 37,634.57 |
| 28 | 32,734.66 | 30,021.30 | 44,754.24 | 37,674.62 |
| 29 | 34,429.88 | 32,535.18 | 47,548.16 | 39,862.26 |
| 30 | 35,003.54 | 32,527.75 | 48,943.22 | 40,253.15 |
| 31 | 35,002.83 | 33,816.77 | 50,010.99 | 43,016.58 |
| Sources: Statistics Canada, Youth in Transition Survey, Cohort A, and T1 Family File. | ||||
Table 1 summarizes cumulative labour market outcomes throughout the 15-year period by showing results for four outcomes: cumulative earnings, the present value of cumulative earnings (based on a 5% discount rate), the number of years of union membership and the number of years with an employer-sponsored pension plan.
The results clearly indicate that among men and women who enrolled in a postsecondary degree program, those who took a gap year registered lower cumulative earnings than those who did not take a gap year. Among men, this amounted to $58,873 (11.9%) less in cumulative earnings over the 15-year period, or $34,499 (11.2%) less in present value. For women, the difference in cumulative earnings was $42,023 (10.6%) less over the period, or $23,292 (9.3%) less in present value. Women who enrolled in a degree program and took a gap year also spent about half a year less time in a union and in a job with an employer-sponsored pension plan than their counterparts who did not take a gap year. The difference was about half as large for men who enrolled in a degree program.
Among men and women who enrolled in a non-degree postsecondary program, labour market outcomes were generally as good or better for those who took a gap year as they were for those who did not. For men, cumulative earnings were $69,638 (14.5%) higher, or $45,464 (14.7%) higher in present value. The cumulative earnings of gappers were only slightly higher than those of non-gappers among women, while differences in union membership and employer-sponsored pension plans were also quite small for men and women.
Although the four analytical samples used to generate the results above are relatively homogeneous, taking a gap year may be governed by a non-random selection process even within these tightly defined groups. In other words, factors other than sex and type of postsecondary enrolment may also influence the decision to take a gap year, and thus may confound the association between a gap year and long-term labour market outcomes.
| Cumulative earnings | Present value of cumulative earnings | Number of years of union membership | Number of years with an employer-sponsored pension plan | |
|---|---|---|---|---|
| mean 2015 constant dollars | mean | |||
| Men, non-degree postsecondary enrolment | ||||
| No gap year | 481,699 | 307,338 | 4.0 | 3.8 |
| Gap year | 551,337 | 352,802 | 3.8 | 3.6 |
| Men, postsecondary degree enrolment | ||||
| No gap year | 493,549 | 306,780 | 3.7 | 3.7 |
| Gap year | 434,675 | 272,280 | 3.5 | 3.4 |
| Women, non-degree postsecondary enrolment | ||||
| No gap year | 331,871 | 216,038 | 4.2 | 3.8 |
| Gap year | 336,666 | 222,194 | 4.1 | 3.6 |
| Women, postsecondary degree enrolment | ||||
| No gap year | 397,994 | 250,363 | 4.9 | 4.3 |
| Gap year | 355,971 | 227,071 | 4.3 | 3.9 |
|
Notes: Cumulative labour market outcomes are measured from the age of 17 to 31. Cumulative earnings are expressed in 2015 constant dollars, and a 5% discount is used to estimate the present value of cumulative earnings. Sources: Statistics Canada, Youth in Transition Survey, Cohort A, and T1 Family File. |
||||
Descriptive statistics on a set of rich covariates collected at the age of 15 or 16 are shown for gappers and non-gappers for each of the four analytical groups in Table 2.Note Independent of sex and postsecondary enrolment type, those who followed a linear educational pathway to PSE (i.e., no gap year) generally had better characteristics (from the point of view of long-term labour market outcomes) than those who took a gap year. For example, among women who enrolled in a postsecondary degree program, 26.4% of non-gappers had an overall mark of 90% or higher at the age of 15 or 16, compared with 16.0% of gappers. Among men who enrolled in a non-degree postsecondary program, 29.3% of those who did not take a gap year had a parent with a bachelor’s degree or above, compared with 19.0% of their counterparts who took a gap year. Similar results hold for other important characteristics, such as reading, mastery and self-esteem scores; parental characteristics (presence, income, education, aspirationsNote and postsecondary savings behaviour); and peers (number of friends intending to further their education after high school). The results also suggest that gappers were more likely to reside in the western provinces and Newfoundland and Labrador, and were far less likely to reside in Quebec and Ontario. In the multivariate analysis, high school fixed effects will account for these provincial differences, as well as for differences in other school-specific factors.
| Men | Women | |||||||
|---|---|---|---|---|---|---|---|---|
| Non-degree postsecondary enrolment | Postsecondary degree enrolment | Non-degree postsecondary enrolment | Postsecondary degree enrolment | |||||
| No gap year | Gap year | No gap year | Gap year | No gap year | Gap year | No gap year | Gap year | |
| percent | ||||||||
| Overall mark | ||||||||
| Less than 60% | 3.9 | 6.1 | 0.8 | 0.5 | 3.3 | 6.4 | 0.5 | 0.0 |
| 60% to 69% | 16.0 | 24.5 | 2.5 | 8.7 | 13.5 | 24.2 | 3.3 | 4.9 |
| 70% to 79% | 41.8 | 47.4 | 22.8 | 26.0 | 37.1 | 37.6 | 18.3 | 29.4 |
| 80% to 89% | 33.2 | 20.9 | 50.5 | 51.5 | 38.4 | 28.6 | 51.5 | 49.7 |
| 90% to 100% | 5.1 | 1.2 | 23.4 | 13.4 | 7.7 | 3.1 | 26.4 | 16.0 |
| Reading score | ||||||||
| Bottom quintile | 22.4 | 30.5 | 8.3 | 11.1 | 17.9 | 22.6 | 5.1 | 8.8 |
| Second quintile | 23.1 | 27.0 | 15.7 | 16.2 | 20.6 | 23.6 | 13.8 | 15.3 |
| Third quintile | 20.2 | 24.3 | 20.7 | 21.8 | 19.5 | 21.1 | 19.2 | 25.4 |
| Fourth quintile | 20.1 | 10.6 | 23.3 | 24.6 | 22.4 | 19.5 | 26.5 | 26.3 |
| Top quintile | 14.2 | 7.5 | 31.9 | 26.3 | 19.5 | 13.1 | 35.4 | 24.3 |
| Mastery and self-esteem score | ||||||||
| Bottom or second quintile | 18.5 | 22.9 | 15.0 | 21.0 | 22.8 | 25.5 | 19.8 | 19.3 |
| Third quintile | 20.3 | 21.3 | 21.8 | 19.1 | 19.7 | 22.1 | 22.4 | 22.7 |
| Fourth quintile | 21.4 | 19.1 | 21.3 | 17.2 | 19.8 | 15.3 | 22.5 | 24.2 |
| Top quintile | 23.2 | 18.2 | 29.6 | 31.0 | 17.8 | 12.6 | 20.4 | 19.5 |
| Parental presence | ||||||||
| One parent | 8.5 | 11.2 | 7.0 | 8.9 | 12.5 | 13.6 | 9.0 | 9.3 |
| Two parents, not all biological | 7.1 | 7.8 | 5.2 | 4.5 | 8.2 | 8.5 | 6.2 | 7.9 |
| Two biological parents | 84.3 | 81.0 | 87.8 | 86.6 | 79.3 | 77.9 | 84.8 | 82.8 |
| Equivalent parental income | ||||||||
| Bottom quintile | 19.9 | 25.6 | 13.3 | 17.8 | 23.7 | 24.6 | 16.9 | 15.3 |
| Second quintile | 22.2 | 26.6 | 17.2 | 20.2 | 25.4 | 22.1 | 20.2 | 26.9 |
| Third quintile | 20.6 | 20.4 | 21.0 | 21.3 | 20.7 | 26.5 | 20.9 | 25.4 |
| Fourth quintile | 18.6 | 14.0 | 23.6 | 21.4 | 15.8 | 14.9 | 21.5 | 14.3 |
| Top quintile | 18.8 | 13.5 | 25.0 | 19.3 | 14.5 | 11.8 | 20.5 | 18.1 |
| Highest level of parental education | ||||||||
| High school or less | 61.2 | 64.0 | 45.1 | 49.3 | 67.2 | 69.6 | 49.2 | 51.0 |
| Postsecondary certificate or diploma | 50.5 | 50.6 | 50.3 | 52.0 | 46.8 | 52.0 | 50.6 | 52.8 |
| Bachelor's degree | 22.5 | 13.4 | 35.2 | 31.0 | 16.5 | 14.8 | 30.3 | 28.6 |
| Graduate or professional degree | 6.8 | 5.7 | 17.8 | 12.2 | 7.1 | 2.8 | 13.5 | 10.5 |
| Parental aspirations for child's educational attainment | ||||||||
| No postsecondary degree | 38.6 | 47.8 | 12.1 | 16.3 | 37.4 | 39.6 | 14.3 | 21.2 |
| Postsecondary degree | 61.4 | 52.2 | 87.9 | 83.7 | 62.6 | 60.4 | 85.7 | 78.8 |
| Postsecondary education savings | ||||||||
| Child has a Registered Education Savings Plan | 19.4 | 17.0 | 33.3 | 29.6 | 17.3 | 18.9 | 27.1 | 21.7 |
| Number of friends planning to further their education after high school | ||||||||
| None or some | 20.8 | 25.7 | 13.8 | 18.3 | 12.9 | 18.5 | 8.6 | 13.1 |
| Most | 49.9 | 53.1 | 51.8 | 52.2 | 49.2 | 53.5 | 47.9 | 52.3 |
| All | 29.3 | 21.2 | 34.4 | 29.5 | 37.9 | 28.0 | 43.5 | 34.6 |
| Province of residence | ||||||||
| Newfoundland and Labrador | 7.0 | 14.7 | 7.5 | 11.0 | 7.2 | 11.3 | 9.2 | 12.3 |
| Prince Edward Island | 3.7 | 6.8 | 8.0 | 5.8 | 2.7 | 5.8 | 8.4 | 8.0 |
| Nova Scotia | 8.4 | 6.5 | 15.0 | 9.1 | 8.5 | 4.2 | 14.4 | 6.5 |
| New Brunswick | 6.8 | 10.1 | 10.7 | 15.6 | 8.8 | 7.3 | 13.1 | 10.4 |
| Quebec | 37.8 | 15.2 | 5.9 | 1.1 | 39.5 | 11.7 | 7.0 | 0.9 |
| Ontario | 16.5 | 9.2 | 16.7 | 3.9 | 12.7 | 11.9 | 16.1 | 8.4 |
| Manitoba | 4.1 | 7.1 | 10.4 | 16.8 | 5.9 | 11.2 | 9.9 | 16.0 |
| Saskatchewan | 5.0 | 9.7 | 8.1 | 13.0 | 5.5 | 9.4 | 8.2 | 15.2 |
| Alberta | 5.0 | 8.0 | 7.1 | 9.2 | 4.1 | 11.3 | 6.1 | 8.6 |
| British Columbia | 5.6 | 12.7 | 10.5 | 14.4 | 5.2 | 15.7 | 7.6 | 13.7 |
| number | ||||||||
| Sample | 1,159 | 266 | 1,499 | 179 | 1,345 | 258 | 2,592 | 231 |
| Sources: Statistics Canada, Youth in Transition Survey, Cohort A, and T1 Family File. | ||||||||
Differences in the covariates described in Table 2 were taken into account in a series of multivariate analyses that focus on cumulative earnings over the 15-year period. Importantly, if the differences in characteristics shown in Table 2 were to have an impact on the differences in labour market outcomes between gappers and non-gappers, this would largely be through direct channels (i.e., independent of their well-documented association with postsecondary access). It is also conceivable that characteristics that are known to be positively associated with postsecondary access (e.g., parental education) have a negative relationship with future earnings, conditional on having achieved postsecondary enrolment. This is because achieving postsecondary enrolment despite facing particular challenges (e.g., low educational attainment among the parents) may be a signal of unobserved characteristics that may be valued in the labour market (e.g., motivation, persistence, resilience).Note For these reasons, and despite the large differences highlighted in Table 2, it is unclear a priori what effect adding covariates may have.
Table 3 shows results from two models. The first includes no covariates, thus corresponding to the bivariate analysis shown in Table 1.Note The second model adjusts for differences in the covariates shown in Table 2 (except for province of residence, which is replaced by high school fixed effects) that existed between gappers and non-gappers for each of the four analytical groups. The results indicate that the unadjusted differences in labour market outcomes were largely preserved after accounting for the covariates. After accounting for differences in covariates, both men and women who enrolled in a postsecondary degree program and took a gap year earned less than their counterparts who did not take a gap year ($57,448, or 11.6%, less for men, and $49,788, or 12.5%, less for women). In contrast, taking a gap year was positively associated with earnings among men who enrolled in a non-degree postsecondary program ($70,416, or 14.6%, more). There was no significant association for women who took a gap year and enrolled in a non-degree postsecondary program.
| Sample | Model 1: No covariates | Model 2: Covariates added | ||
|---|---|---|---|---|
| coefficient | standard error | coefficient | standard error | |
| Men | ||||
| Non-degree postsecondary enrolment | 69,638Note *** | 20,956 | 70,416Note *** | 21,716 |
| Postsecondary degree enrolment | -58,873Note * | 22,935 | -57,448Note * | 24,956 |
| Women | ||||
| Non-degree postsecondary enrolment | 4,795 | 17,278 | -14,201 | 19,224 |
| Postsecondary degree enrolment | -42,023Note * | 17,427 | -49,788Note * | 20,918 |
Notes: Cumulative earnings are measured from the age of 17 to 31 and are expressed in 2015 constant dollars. Covariates include variables indicating the overall mark, reading ability, mastery and self-esteem, parental presence, equivalent parental income, highest level of parental education, parental aspirations for child's educational attainment, postsecondary education savings, the number of friends planning to further their education after high school (as described in Table 2), and high school fixed effects. Sources: Statistics Canada, Youth in Transition Survey, Cohort A, and T1 Family File. |
||||
The results in Table 4, which focus on the present value of cumulative earnings, are more or less analogous to those in Table 3. Specifically, among those who enrolled in a postsecondary degree program, taking a gap year was associated with $34,815 (11.3%) less for men and $29,562 (11.8%) less for women in discounted cumulative earnings. Meanwhile, a gap year was associated with $44,125 (14.3%) more in discounted earnings for men who enrolled in a non-degree postsecondary program, but was not associated with discounted earnings for their female counterparts.
Why was taking a gap year negatively associated with cumulative earnings for degree enrollees, but either positively or not associated with earnings for non-degree postsecondary enrollees? The answer may lie in opportunity costs. Taking a gap year more or less involves substituting one year of earnings before postsecondary enrolment for one year of earnings after post-postsecondary enrolment. Such a trade-off may be costlier for those who enrolled in a degree program simply because these are associated with higher pay than other postsecondary programs (Frenette, 2019).
The other outcomes examined in this study were, for the most part, not strongly associated with taking a gap year (tables 5 and 6). The only statistically significant outcomes were registered for women who enrolled in a postsecondary degree program: those who took a gap year were part of a union for 0.684 fewer years than their counterparts who did not take a gap year, and gappers had an employer-sponsored pension plan for 0.751 fewer years than non-gappers.
| Sample | Model 1: No covariates | Model 2: Covariates added | ||
|---|---|---|---|---|
| coefficient | standard error | coefficient | standard error | |
| Men | ||||
| Non-degree postsecondary enrolment | 45,464Note *** | 13,015 | 44,125Note *** | 13,515 |
| Postsecondary degree enrolment | -34,499Note * | 14,130 | -34,815Note * | 15,357 |
| Women | ||||
| Non-degree postsecondary enrolment | 6,156 | 10,866 | -7,636 | 12,088 |
| Postsecondary degree enrolment | -23,292Note * | 10,864 | -29,562Note * | 12,940 |
Notes: The present value of cumulative earnings is measured from the age of 17 to 31, expressed in 2015 constant dollars, and based on a 5% discount rate. Covariates include variables indicating the overall mark, reading ability, mastery and self-esteem, parental presence, equivalent parental income, highest level of parental education, parental aspirations for child's educational attainment, postsecondary education savings, the number of friends planning to further their education after high school (as described in Table 2), and high school fixed effects. Sources: Statistics Canada, Youth in Transition Survey, Cohort A, and T1 Family File. |
||||
| Sample | Model 1: No covariates | Model 2: Covariates added | ||
|---|---|---|---|---|
| marginal effect | standard error | marginal effect | standard error | |
| Men | ||||
| Non-degree postsecondary enrolment | -0.249 | 0.318 | 0.024 | 0.336 |
| Postsecondary degree enrolment | -0.141 | 0.386 | -0.073 | 0.435 |
| Women | ||||
| Non-degree postsecondary enrolment | -0.060 | 0.356 | 0.334 | 0.396 |
| Postsecondary degree enrolment | -0.488 | 0.332 | -0.684Table 5 Note † | 0.384 |
|
* significantly different from reference category (p < 0.05) ** significantly different from reference category (p < 0.01) *** significantly different from reference category (p < 0.001)
Sources: Statistics Canada, Youth in Transition Survey, Cohort A, and T1 Family File. |
||||
| Sample | Model 1: No covariates | Model 2: Covariates added | ||
|---|---|---|---|---|
| marginal effect | standard error | marginal effect | standard error | |
| Men | ||||
| Non-degree postsecondary enrolment | -0.204 | 0.286 | -0.015 | 0.316 |
| Postsecondary degree enrolment | -0.341 | 0.344 | -0.124 | 0.411 |
| Women | ||||
| Non-degree postsecondary enrolment | -0.261 | 0.337 | 0.070 | 0.376 |
| Postsecondary degree enrolment | -0.359 | 0.308 | -0.751Note * | 0.372 |
*** significantly different from reference category (p < 0.001) † significantly different from reference category (p < 0.10) Notes: The number of years with an employer-sponsored pension plan is measured from the age of 17 to 31. Covariates include variables indicating the overall mark, reading ability, mastery and self-esteem, parental presence, equivalent parental income, highest level of parental education, parental aspirations for child's educational attainment, postsecondary education savings, the number of friends planning to further their education after high school (as described in Table 2), and high school fixed effects. Sources: Statistics Canada, Youth in Transition Survey, Cohort A, and T1 Family File. |
||||
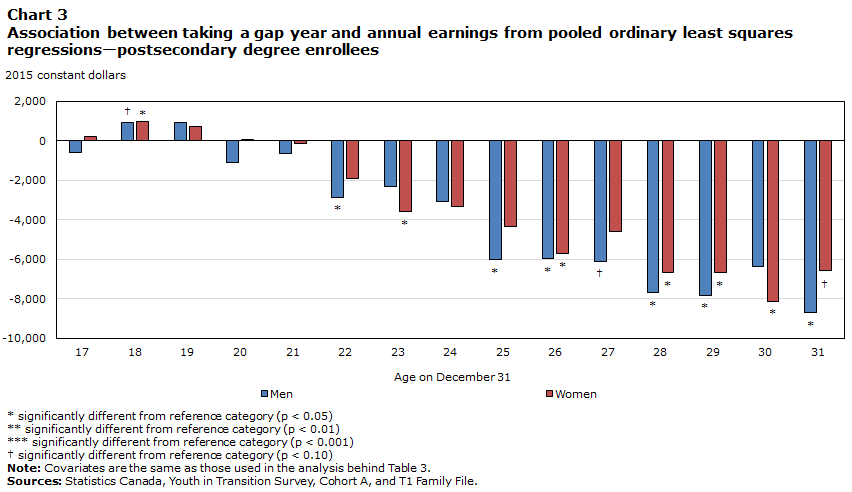
The data available in the study end at the age of 31, so there is no way to know what happened next. However, it may be informative to estimate earnings differences between gappers and non-gappers annually, leading up to the end point of the data. Chart 3 shows the results of this exercise. Once again, pooled models across the entire analytical sample were estimated, but results are shown only for postsecondary degree enrollees (i.e., the group that experienced a negative association between taking a gap year and cumulative earnings).
Before the results shown in Chart 3 are addressed, it is important to distinguish between relative and absolute effects. In relative (or percentage terms) terms, the negative association with taking a gap year was more or less consistent across the years for both men and women who enrolled in a degree program. However, as annual earnings grew with age, the implications of taking a gap year became more evident over time once absolute dollar terms were examined, as they appear in Chart 3.
Indeed, the results in Chart 3 suggest a growing negative association over time in absolute terms. While there was no association until the age of 22, the negative earnings premium associated with taking a gap year (when expressed in absolute dollar terms) began to grow at that point. Men aged 22 years who had taken a gap year and subsequently enrolled in a degree program earned $2,854 less than their counterparts who enrolled in a degree program very shortly after high school. By the age of 31, the difference in annual earnings between these same two groups of men grew to $8,716. Similarly, the negative association between taking a gap year and annual earnings went from $1,920 at the age of 22 to $6,575 at the age of 31 for women who enrolled in a degree program.
Data table for Chart 3
| Age on December 31 | Men | Women |
|---|---|---|
| 2015 constant dollars | ||
| 17 | -588.76 | 228.73 |
| 18 | 943.36Data table for Chart 3 Note † | 954.96Note * |
| 19 | 930.14 | 700.52 |
| 20 | -1,098.57 | 70.50 |
| 21 | -650.94 | -162.52 |
| 22 | -2,854.12Note * | -1,919.53 |
| 23 | -2,329.68 | -3,595.93Note * |
| 24 | -3,087.87 | -3,330.34 |
| 25 | -6,030.14Note * | -4,324.05 |
| 26 | -5,969.67Note * | -5,722.12Note * |
| 27 | -6,097.87Data table for Chart 3 Note † | -4,580.66 |
| 28 | -7,700.04Note * | -6,695.64Note * |
| 29 | -7,825.85Note * | -6,698.02Note * |
| 30 | -6,372.06 | -8,139.14Note * |
| 31 | -8,715.65Note * | -6,574.71Data table for Chart 3 Note † |
*** significantly different from reference category (p < 0.001)
Sources: Statistics Canada, Youth in Transition Survey, Cohort A, and T1 Family File. |
||
Conclusion
The decision to take a gap year between high school and PSE is an important one in the long term. Students who take a gap year may face high opportunity costs since they often substitute one year of lower-paying, pre-PSE work for one year of higher-paying, post-PSE work. Nevertheless, they may acquire more focus and maturity during their time away from studies. This could help them make better educational choices, which could benefit them in the labour market. The purpose of this study was to investigate the long-term labour market implications associated with the decision to take a gap year.
The findings suggest a substantial negative association between taking a gap year and cumulative earnings among individuals who enrolled in a degree program shortly after high school. Specifically, men who took a gap year before enrolling in a degree program earned $57,448 (2015 constant dollars), or 11.6%, less from the ages of 17 to 31 than their counterparts who did not take a gap year. Similarly, women who took a gap year prior to enrolling in a postsecondary degree program earned $49,788 (12.5%) less over the same time span compared with their counterparts who did not take a gap year. Based on annual data, the negative association between taking a gap year and earnings grew more or less consistently in an absolute sense as individuals aged, at least until they were 31 years old (when the data end). In contrast, taking a gap year was positively associated with earnings among men who enrolled in a non-degree postsecondary program ($70,416, or 14.6%, more), while there was no association for their female counterparts. The study also found a small negative relationship between taking a gap year and other cumulative job characteristics over the period (number of years of union membership and with an employer-sponsored pension plan) among women who enrolled in a postsecondary degree program.
Future research could further inform the issue by following individuals for a longer period of time, especially given how the annual earnings disadvantage of gappers continued to increase in absolute terms until the age of 31 in the current study. Another useful avenue for research in this area would be a more detailed look at the educational decisions and successes of gappers and non-gappers. Indeed, taking a gap year might bring more perspective into the decision-making processes of youth, or even foster more motivation upon their return from their time away from school. Finally, taking a gap year could affect the decision to enrol in PSE in the first place, as youth may re-evaluate their career objectives after taking a break from school. This may depend on how the gap year was spent (e.g., working, travelling, resting, socializing). Understanding the relationship between these activities and the decision to enrol in PSE could therefore be the subject of further investigation.
References
Crawford, C., & Cribb, J. (2012). Gap-year takers: Uptake, trends and long-term outcomes. Institute for Fiscal Studies, Centre for Analysis of Youth Transitions and United Kingdom Department of Education.
Ferrer, A., & Menendez, A. (2014). The puzzling effect of delaying schooling on Canadian wages. Canadian Public Policy, 40(3), 197–208.
Frenette, M. (2007). Why are youth from lower-income families less likely to attend university? Evidence from academic abilities, parental influences, and financial constraints (Analytical Studies Branch Research Paper Series, No. 295). Statistics Canada.
Frenette, M. (2017). Which families invest in Registered Education Savings Plans and does it matter for postsecondary enrolment? (Analytical Studies Branch Research Paper Series, No. 392). Statistics Canada.
Frenette, M. (2019). Obtaining a bachelor’s degree from a community college: Earnings outlook and prospects for graduate studies (Analytical Studies Branch Research Paper Series, No. 428). Statistics Canada.
Gibson, L., Rodriguez, C., Ferguson, S.J., Zhao, J., & Hango, D. (2019). Does reading proficiency at age 15 affect employment earnings in young adulthood? Insights on Canadian Society. Statistics Canada.
Hango, D. (2008). Taking time off between high school and postsecondary education: Determinants and early labour market outcomes. Education Matters 4(5).
Hango, D. (2011). Length of time between high school graduation and enrolling in postsecondary education: Who delays and who does not? (Culture Tourism and the Centre for Education Statistics: Research Papers, No. 90). Statistics Canada.
Holmlund, B., Skans, O., & Liu, Q. (2008). Mind the gap? Estimating the effects of postponing higher education. Oxford Economic Papers, 60(4), 683–710.
Mehdi, T., & Morissette, R. (2021). Working from home in Canada: What have we learned so far? Economic and Social Reports, 1(10).
Ostrovsky, Y., & Frenette, M. (2014). The cumulative earnings of postsecondary graduates over 20 years: Results by field of study (Economic Insights, No. 40). Statistics Canada.
- Date modified: