
Economic and Social Reports
Postsecondary education decisions following a permanent layoff
DOI: https://doi.org/10.25318/36280001202200900002-eng
Skip to text
Text begins
Abstract
Experiencing a permanent layoff—a job loss not followed by rejoining the same employer in the current or subsequent year—can have lasting effects on individuals and their families. Previous research has shown that post-displacement earnings remain lower than would be expected otherwise, even several years following job loss. One strategy to cope with job loss is to retrain. However, until recently, data limitations have prevented researchers from observing the detailed training activities of Canadians who have been permanently laid off. This study aims to address this gap by documenting the detailed postsecondary training decisions made by affected workers following job displacement. The investigation is based on the 2006 Census of Population, the Longitudinal Worker File, the T1 Family File and the Postsecondary Student Information System.
Among individuals who were aged 25 to 54 years in 2009, were employed with the same employer in 2008 and 2009, and did not enrol in postsecondary education, and had positive T4 earnings continuously between 2004 and 2008, 2.6% experienced a permanent layoff in 2009 (amid an economic recession). Of this group, 4.0% were enrolled in postsecondary education in 2009, compared with 1.9% among their counterparts who did not lose their job in that same year. A substantial gap remained in 2018, with 14.1% of the layoff group having enrolled in postsecondary education, compared with 9.8% of the non-layoff group.
Of the individuals who enrolled in postsecondary programs, those who previously lost their job were more likely to take certain types of shorter, albeit career-focused, programs. The programs included career, technical or professional training certificate and diploma programs (for men and women), basic education and skills programs (for men), and attestations and other short-term credentials (for women). A previous job loss was also associated with a much lower likelihood of taking one credit or more with no associated credential or program when examining both men and women. Moreover, men who lost their job and returned to school were less likely to enrol in an undergraduate degree program than their counterparts who were not displaced. A permanent layoff was also associated with a higher probability of women enrolling in a STEM (science, technology, engineering and mathematics) program, including those that are mathematics-intensive.
These results may reflect the shorter time horizon faced by displaced workers, because many may need to re-enter the workforce as soon as possible to pay bills and care for dependants.
Keywords: permanent layoff, job displacement, postsecondary education, retraining, lifelong learning
Authors
Tomasz Handler and Marc Frenette are with the Social Analysis and Modelling Division, Analytical Studies and Modelling Branch, at Statistics Canada.
Acknowledgement
The study was funded by Employment and Social Development Canada.
Introduction
Experiencing a permanent layoff—a job loss without returning to the same employer during the same or subsequent year—can have significant and long-lasting impacts. Indeed, previous research has shown that affected workers tend to experience substantial long-term negative consequences with regard to their labour market outcomes in Canada (Morissette et al. 2007; Chan et al. 2011; Bonikowska and Morissette 2012; Chan et al. 2020), as well as in several other countries, including the United States (Jacobson et al. 1993; Couch and Placzek 2010), the United Kingdom (Hijzen et al. 2010), Sweden (Eliason and Storrie 2006) and Finland (Huttunen et al. 2006). For example, Morissette et al. (2007) found that workers with high seniority experienced substantial long-term earnings losses relative to their pre-displacement earnings, equivalent to 18% to 35% for men and 24% to 35% for women. Additionally, Bonikowska and Morissette (2012) found that earnings losses were not only limited to high-seniority displaced workers. Indeed, both high- and low-seniority men aged 36 to 55 years experienced persistent earnings losses following job displacement of at least 10% during the 2000s.
How workers respond to a layoff may be of critical importance. Morissette and Qiu (2021) looked at four possible adjustment strategies—enrolling in postsecondary education (university or college), signing up for registered apprenticeship training, moving to a different economic region or moving into unincorporated self-employment. They found that about 8 in 10 displaced workers adopted none of these strategies in the year following layoff—roughly the same as the proportion of workers who found a new job. About the same proportion enrolled in postsecondary education (4% to 6%), changed economic regions (close to 6%) or moved into unincorporated self-employment (slightly more than 4%). In contrast, no more than 1% began a registered apprenticeship. Ci et al. (2016) focused more directly on the postsecondary enrolment option, and found that job displacement was associated with an increase in postsecondary enrolment equivalent to 2 to 4 percentage points in the year of the layoff or the subsequent year for men and women, from a baseline of about 3%. Thus, job displacement was found to almost double postsecondary enrolment among affected workers. Handler and Morissette (2021) looked at a particular postsecondary enrolment strategy by examining the extent to which workers entered new fields of study or whether they upgraded their skills within their initial fields of study. They found that almost 10% of laid-off workers aged 30 to 54 years entered postsecondary education within three years, and of those, nearly 60% changed their field of study.
The enrolment strategy may be key, since Frenette et al. (2011) found that enrolling in postsecondary education in the year following job loss was associated with an almost $7,000 increase in annual earnings between the period spanning five years preceding and nine years following job loss, compared with displaced workers who did not enrol in postsecondary education in the year following job loss. In the United States, Jacobsen et al. (2005) used administrative data to show that the returns to a year of community college following job displacement in Washington State during the 1990s were, on average, around 9% for men and 13% for women. In particular, they found that nearly all gains came from technical vocational and academic mathematics and science courses which, on average, increased annual earnings by around 14% for men and 29% for women. In contrast, the returns to non-technical courses were close to zero for both men and women.
Measuring post-layoff educational activities in the literature has been complicated by two interrelated factors. First, layoffs are relatively rare events, and thus, large datasets are required (e.g., administrative data). Second, until recently, the only postsecondary information available in datasets enabling the identification of job loss has come from personal taxation data (i.e., the T1 and derivative tax files). In these data, postsecondary information is identified through the presence of postsecondary education credits. Thus, the data contain no information other than the decision to enrol in a postsecondary program. No details on the enrolment are known (e.g., program type and level and field of study).
Using administrative data that combine information on job loss (from the Longitudinal Worker File [LWF]) with detailed information on public postsecondary educational activities of affected workers (from the Postsecondary Student Information System [PSIS]), complemented with the 2006 Census and income tax data (from the T1 Family File [T1FF]) containing personal characteristics of workers, this study takes a first step in re-examining the postsecondary enrolment option following job displacement. Specifically, the study looks at the relationship between job loss experienced during the financial crisis of the late 2000s and enrolment in particular types of postsecondary programs, including basic education and skills programs, high school equivalency programs, micro-credentials, and qualifying years, as well as more traditional postsecondary programs, such as university and college certificates, diplomas and degrees.
Incorporating the shorter, less conventional programs into the analysis is important since laid-off workers may be operating with a limited time horizon, especially if they have a family to take care of and bills to pay. The study also fills a gap in policy knowledge. Under certain conditions, unemployed workers currently have access to government-sponsored training, which is often short-term in nature. The results from this study will provide a comprehensive picture of the extent to which displaced workers tend to participate in short-term training programs offered in colleges and universities (whether sponsored by the government or not). This could inform policies on the provision of government-sponsored training for displaced workers.
The remainder of this study includes a methods section, where the data and quantitative approach are described, a results section, and a conclusion summarizing the results and discussing potential follow-up research.
Methods
The main objective of this research is to document the postsecondary schooling activities from 2009 to 2018 of workers displaced from their job in 2009, compared with workers who were not displaced from their job in the same year. The study uses the linked data composed of the LWF, the PSIS, the 2006 Census of Population and the T1FF.
The identification of job loss comes from the LWF, which is a rich administrative dataset containing information collected from a multitude of sources: the Record of Employment (ROE), T4 slips, T1 tax files and the Longitudinal Employment Analysis Program (LEAP). For this study, the ROE portion plays a crucial role in providing information on job separations and identifying permanent displacement (a layoff not followed by rejoining the same employer in the current or subsequent year) by distinguishing it from temporary displacement. The T4 Statements of Remuneration Paid include job-level information, such as the province of employment, annual employment earnings and union dues. The T1 tax file includes annual T4 earnings from all jobs, as well as self-employment earnings and full- and part-time postsecondary education deductions. The education credits help identify individuals who were in postsecondary education within the tax year.Note And finally, LEAP contains firm-level information (job characteristics) allowing the inclusion of industry and firm size variables into the analysis. Since LEAP is longitudinal in nature, the study uses business numbers that identify the employers to establish the number of years of tenure (within the last five years) that the workers had within a firm. All of these job characteristics are measured in the year preceding the potential layoff (2008).
Next, educational choices following the year of the potential layoff are captured by the PSIS—a large individual-level dataset containing postsecondary education information on nearly all public postsecondary students in Canada. Comprehensive enrolment data are available in the PSIS from 2009 to 2018. This paper has a more in-depth analysis of schooling activities than previous studies, and additionally incorporates the program/credential type and field of study. In particular, the fields of study are categorized into various STEM and non-STEM program groupings similar to that of Chan et al. (2021). These program groupings are appropriate, because they aptly characterize the earnings distinctions between the types of fields of study, as shown in a recent series of papers (Handler and Frenette 2020a; Handler and Frenette 2020b; Handler and Frenette 2020c).
Lastly, the study incorporates the 2006 Census of Population to include individual personal characteristics such as age, gender, population group (e.g., Black, White and Arab), immigration status including the year of arrival in Canada and the highest level of education attained. As well, it incorporates the T1FF to include information on marital statusNote and the number of children, all measured in the year preceding the potential layoff (2008). These factors are included, since they may exert independent effects on the probability of enrolling in postsecondary education and in specific programs. To the extent that these characteristics may also be correlated with the probability of being permanently laid off, it will be important to account for their differences in the analysis.
To maximize the number of displaced workers in the sample, this study focuses on those who were permanently laid off during the recession in 2008 and 2009. Since PSIS enrolment data are only comprehensive starting in 2009, and since the study looks at enrolment patterns during the year of the layoff and beyond, it was necessary to limit the sample to those who were laid off in 2009. To include those who were at least old enough to have had an opportunity to acquire some postsecondary education before the beginning of their work career, the sample was further limited to those aged 25 to 54 on December 31, 2009 (i.e., born between 1955 and 1984).
The selected sample in this study can be divided into two mutually exclusive groups—those who were permanently laid off in 2009 and those who were not.Note Both groups include individuals who in each of the five years preceding 2009 (i.e., 2004 to 2008) had no postsecondary schooling (as evidenced by having no reported part- and full-time postsecondary education credits), positive T4 employment income, and no self-employment income. Furthermore, workers had the same main job employer in 2008 as in 2009 (matched using the business number). A main job is defined as the one providing the workers with their largest source of T4 earnings in that year. The final total sample size is 675,965, of which 17,143 were in the layoff group and the remaining 658,822 were in the non-layoff group.
The first outcomes examined in this study—postsecondary enrolment by a given year—are based on the full sample of individuals. The criteria for being enrolled in school is the individual’s presence in the PSIS in a given year from 2009 to 2018.
The next set of outcomes delve deeper into the data by examining a combination of program and credential types among individuals who enrolled in postsecondary education, including
- basic education and skills (other than a high school diploma or general equivalency diploma)
- high school diploma or general equivalency diploma
- non-credential, non-program enrolment
- other type of postsecondary credential (not elsewhere classified)
- attestation and other short program credentials
- apprenticeship certificate or diplomaNote
- qualifying or pre-postsecondary
- career, technical or professional training certificate
- career, technical or professional training diploma
- undergraduate certificate, diploma or associate degree
- degree
- post-program certificate or diploma, health-related residency program, or graduate certificate or diploma.
The last set of outcomes focuses on the particular STEM and non-STEMNote fields of study chosen by individuals enrolled in postsecondary programs where the field of study was available, namely all program and credential types listed above except for basic education and skills (other than a high school diploma or general equivalency diploma), high school diploma or general equivalency diploma, non-credential, non-program enrolment, and apprenticeship certificate or diploma.Note Four broad field of study categories are used, including
- STEM (mathematics-intensive)
- physical and chemical sciences, engineering, engineering technology, mathematics and related studies, and computer and information studies
- STEM (other) plus health care
- biological sciences and general and integrated sciences
- health care (medicine, dentistry, optometry, veterinary medicine, nursing, pharmacy and related programs, and health care not elsewhere classified)
- non-STEM (business)
- business and related studies
- non-STEM (other)
- all other programs.
The quantitative analysis uses linear probability models to estimate the relationship between the above outcomes (each treated in a binary manner)Note and the layoff indicator (main variable of interest), as well as the personal and job characteristics covariates described earlier in this section.
Results
In this study, 2.6% of workers experienced a permanent layoff in 2009. The layoff rates were higher for men than for women, and also higher for younger workers than for older workers. The youngest men, aged 25 to 34 years, had the highest permanent layoff rate at 4.3%, compared with the oldest men, aged 45 to 54 years, at 2.7%. The difference in permanent layoff rates across the age spectrum was somewhat smaller among women, as the youngest had the highest rate at 2.4%, while the oldest had the lowest rate at 1.8%.
The descriptive analysis in Chart 1 shows that permanently laid-off workers were more likely to enrol in postsecondary education. Around 4.0% of workers who were laid off in 2009 enrolled in postsecondary education within the first year, while only 1.9% of the non-layoff group enrolled within that same timeframe. A substantial gap remained in 2018, with 14.1% of the layoff group having enrolled, compared with 9.8% for the non-layoff group.

Data table for Chart 1
| PSIS Year | Permanent layoff in 2009 | No permanent layoff in 2009 |
|---|---|---|
| percent | ||
| 2009 | 4.01 | 1.89 |
| 2010 | 6.82 | 3.42 |
| 2011 | 8.34 | 4.69 |
| 2012 | 9.61 | 5.74 |
| 2013 | 10.77 | 6.76 |
| 2014 | 11.73 | 7.62 |
| 2015 | 12.63 | 8.40 |
| 2016 | 13.39 | 9.09 |
| 2017 | 14.03 | 9.67 |
| 2018 | 14.14 | 9.80 |
| Sources: Statistics Canada, Longitudinal Worker File, Postsecondary Student Information System, 2006 Census of Population and T1 Family File. | ||
The same general trends between the two groups were evident by gender and age, albeit to varying degrees.Note Just as young workers were the most likely to be laid off, they were also the most likely to enrol in school in comparison to the non-layoff group, possibly because younger individuals have more years remaining to reap the benefits from their human capital investments. For example, the gap in enrolment rates by 2018 for men aged 25 to 34 years was 5.8 percentage points (in favour of the layoff group), yet only 2.4 percentage points for men aged 45 to 54 years. Similarly, for women aged 25 to 34 years, the enrolment gap by 2018 was 5.7 percentage points, while it was only 2.4 percentage points for women aged 45 to 54 years.Note
In Chart 2, the focus shifts to specific first enrolment decisions among those who enrolled. Many interesting findings emerge. For example, 13.8% of students who had been laid off chose a career or technical or professional training certificate, and 12.4% chose the diploma counterpart to this program. In comparison, 8.0% of those who had not been laid off chose to pursue the certificate and 6.3% chose the diploma route. Overall, career, technical or professional training (including diplomas and certificates) accounted for 26.2% of specific enrolment decisions among the laid-off group who opted for postsecondary education, and 14.3% of their non-layoff counterparts (an 11.8 percentage point gap). Those who experienced a layoff were also more likely to enrol in an apprenticeship certificate or diploma (5.2%) compared with those who did not experience a layoff (2.2%). Some adults enrol in postsecondary education for basic education and skills (e.g., English or French as a second language, adult education, career exploration), which was more common among recently displaced workers (3.1%) than among those who were not displaced (1.5%). Another option for a recently displaced worker who has a limited time horizon to get back into the workforce or who faces constraints related to family obligations is an attestation or other short program credentials.Note However, this was only slightly more common among recently displaced workers (7.1%) than among workers who did not lose their job (6.0%). An even smaller commitment is to enrol in one or more courses that are not linked to a credential or program. This was actually by far the most common option selected among both groups, but less so among individuals who were recently laid off (43.4%) than among those who were not (55.0%). Therefore, when faced with a permanent layoff, the data suggest that affected workers tend to favour shorter-term, career-focused postsecondary enrolment opportunities compared with unaffected workers who enrol in postsecondary education.Note

Data table for Chart 2
| First postsecondary enrolment | Permanent layoff in 2009 | No permanent layoff in 2009 |
|---|---|---|
| percent | ||
| Basic education and skills (other than high school diploma or general equivalency diploma) | 3.10 | 1.52 |
| High school diploma or general equivalency diploma | 0.37 | 0.21 |
| Non-credential, non-program enrolment | 43.34 | 55.03 |
| Other type of postsecondary credential (not elsewhere classified) | 6.04 | 3.92 |
| Attestation and other short program credentials | 7.10 | 5.99 |
| Apprenticeship certificate or diploma | 5.31 | 2.19 |
| Qualifying or pre-postsecondary | 0.34 | 0.21 |
| Career, technical or professional training certificate | 13.78 | 8.01 |
| Career, technical or professional training diploma | 12.37 | 6.32 |
| Undergraduate certificate, diploma or associate degree | 2.33 | 4.41 |
| Degree | 4.97 | 10.01 |
| Post-program certificate or diploma, health-related residency program, or graduate certificate or diploma | 0.95 | 2.17 |
|
Notes: The credential/program type refers to the first enrolment after the potential layoff. Sources: Statistics Canada, Longitudinal Worker File, Postsecondary Student Information System, 2006 Census of Population and T1 Family File. |
||
In contrast, individuals who were laid off and went back to school were considerably less likely to enrol in a degree program (5.0%) compared with their counterparts who were not laid off (10.0%). These trends were also evident by gender and age group, to varying degrees, as evidenced in Table 1. Thus, despite having a potentially longer time horizon, younger workers affected by a layoff also tend to select short-term, career-focused programs compared with their unaffected counterparts.
| Characteristics in 2009 | ||||||
|---|---|---|---|---|---|---|
| 25 to 34 years | 35 to 44 years | 45 to 54 years | ||||
| Permanent layoff | No permanent layoff | Permanent layoff | No permanent layoff | Permanent layoff | No permanent layoff | |
| percent | ||||||
| Men | ||||||
| Basic education and skills (other than high school diploma or general equivalency diploma) | 3.2 | 1.7 | 2.9 | 1.1 | 2.0 | 1.0 |
| High school diploma or general equivalency diploma | 0.3 | 0.2 | 0.1 | 0.1 | 0.7 | 0.2 |
| Non-credential, non-program enrolment | 35.8 | 45.5 | 46.1 | 58.2 | 58.5 | 70.4 |
| Other type of postsecondary credential (not elsewhere classified) | 6.8 | 6.5 | 7.3 | 5.1 | 6.4 | 5.2 |
| Attestation and other short program credentials | 6.2 | 5.9 | 6.8 | 5.8 | 6.2 | 4.7 |
| Apprenticeship certificate or diploma | 14.1 | 8.4 | 5.2 | 2.9 | 2.0 | 1.1 |
| Qualifying or pre-postsecondary | 0.9 | 0.3 | 0.0 | 0.2 | 0.6 | 0.1 |
| Career, technical or professional training certificate | 13.6 | 9.0 | 13.8 | 7.1 | 12.7 | 6.6 |
| Career, technical or professional training diploma | 12.9 | 8.0 | 10.3 | 4.6 | 7.6 | 2.9 |
| Undergraduate certificate, diploma or associate degree | 1.5 | 3.8 | 3.1 | 3.2 | 1.1 | 1.8 |
| Degree | 4.4 | 9.6 | 3.8 | 9.9 | 1.5 | 4.7 |
| Post-program certificate or diploma, health-related residency program, or graduate certificate or diploma | 0.4 | 1.1 | 0.6 | 1.8 | 0.8 | 1.3 |
| Women | ||||||
| Basic education and skills (other than high school diploma or general equivalency diploma) | 3.9 | 2.5 | 4.4 | 1.5 | 2.1 | 1.3 |
| High school diploma or general equivalency diploma | 1.0 | 0.3 | 0.4 | 0.2 | 0.0 | 0.3 |
| Non-credential, non-program enrolment | 30.6 | 41.9 | 42.3 | 50.9 | 49.6 | 63.0 |
| Other type of postsecondary credential (not elsewhere classified) | 4.3 | 2.0 | 5.3 | 2.7 | 4.2 | 2.6 |
| Attestation and other short program credentials | 6.7 | 7.5 | 8.8 | 6.5 | 9.4 | 5.5 |
| Apprenticeship certificate or diploma | 2.6 | 1.0 | 0.9 | 0.4 | 0.3 | 0.4 |
| Qualifying or pre-postsecondary | 0.2 | 0.3 | 0.0 | 0.2 | 0.0 | 0.1 |
| Career, technical or professional training certificate | 15.7 | 9.6 | 11.8 | 8.0 | 16.0 | 7.9 |
| Career, technical or professional training diploma | 17.9 | 11.5 | 15.8 | 6.6 | 11.0 | 4.7 |
| Undergraduate certificate, diploma or associate degree | 4.6 | 7.2 | 2.5 | 6.2 | 1.5 | 3.8 |
| Degree | 10.8 | 13.8 | 6.2 | 13.3 | 4.7 | 7.9 |
| Post-program certificate or diploma, health-related residency program, or graduate certificate or diploma | 1.7 | 2.5 | 1.7 | 3.4 | 1.1 | 2.4 |
|
Notes: The credential/program type refers to the first enrolment after the potential layoff. Sources: Statistics Canada, Longitudinal Worker File, Postsecondary Student Information System, 2006 Census of Population and T1 Family File. |
||||||
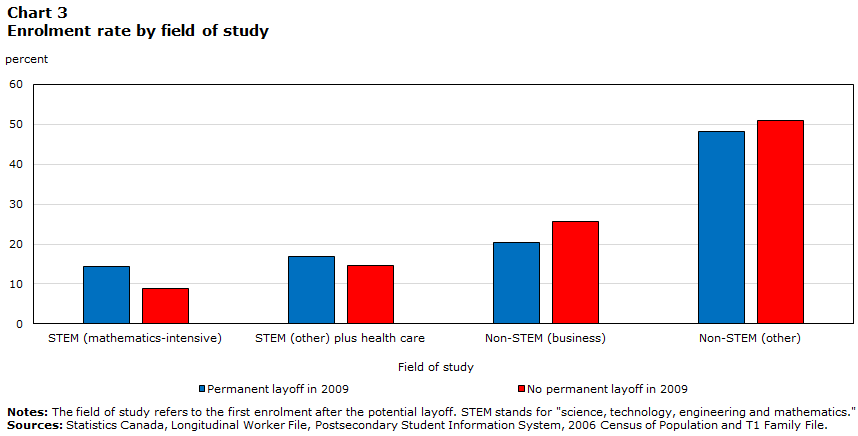
The results in Chart 3 suggest that, among students who enrolled in a postsecondary program associated with a field of study, those who lost their job were more likely to choose STEM fields than those who did not. This is especially true for mathematics-intensive STEM programs, because 14.5% of those who lost their job enrolled in these programs, compared with 8.7% for those who did not (a difference of 5.7 percentage points). It is also true for other STEM plus health care fields, but to a much lesser degree, with enrolment rates of 17.0% and 14.6% for the layoff and non-layoff groups, respectively (a difference of 2.3 percentage points). In general, those who did not experience a layoff, but returned to school nonetheless, were more likely to select business programs (25.7%) than their counterparts who were laid off (20.3%).
Data table for Chart 3
| Field of study | Permanent layoff in 2009 | No permanent layoff in 2009 |
|---|---|---|
| percent | ||
| STEM (mathematics-intensive) | 14.47 | 8.74 |
| STEM (other) plus health care | 16.98 | 14.63 |
| Non-STEM (business) | 20.28 | 25.74 |
| Non-STEM (other) | 48.27 | 50.88 |
|
Notes: The field of study refers to the first enrolment after the potential layoff. STEM stands for "science, technology, engineering and mathematics." Sources: Statistics Canada, Longitudinal Worker File, Postsecondary Student Information System, 2006 Census of Population and T1 Family File. |
||
These trends varied considerably by gender and age group (Table 2). For example, among men aged 25 to 34 years, the non-layoff group was slightly more likely to enrol in mathematics-intensive STEM programs than similarly aged men who experienced a layoff. Although men in general were more likely to go into mathematics-intensive STEM fields than women, it is worth highlighting that the enrolment rates in these programs among the layoff group were higher for older men compared with younger men, but the opposite was true for women. In other words, younger women who enrolled in postsecondary education after a layoff were more likely to select mathematics-intensive STEM programs than their older counterparts. This finding may signal an important demographic shift in strategies adopted by women when faced with job displacement.
Other insights are evident in Table 2. Men and women of all age groups were more likely to enrol in other STEM plus health care programs when they were previously laid off, but this was especially the case among women across the age spectrum. Also, the higher tendency of individuals who were not laid off to choose business programs when they returned to school was mostly driven by men younger than age 45. In contrast with other groups, men younger than age 35 who were laid off were more likely to select other non-STEM programs than their counterparts who were not laid off, whereas the rates were about equal among the layoff and non-layoff groups of men aged 35 to 44.
| Characteristics in 2009 | ||||||
|---|---|---|---|---|---|---|
| 25 to 34 years | 35 to 44 years | 45 to 54 years | ||||
| Permanent layoff | No permanent layoff | Permanent layoff | No permanent layoff | Permanent layoff | No permanent layoff | |
| percent | ||||||
| Men | ||||||
| STEM (mathematics-intensive) | 15.7 | 17.8 | 24.0 | 16.5 | 25.2 | 11.9 |
| STEM (other) plus health care | 8.5 | 6.8 | 9.1 | 6.0 | 8.5 | 5.6 |
| Non-STEM (business) | 11.2 | 23.7 | 14.6 | 23.6 | 18.3 | 18.5 |
| Non-STEM (other) | 64.6 | 51.7 | 52.3 | 53.8 | 47.9 | 64.0 |
| Women | ||||||
| STEM (mathematics-intensive) | 8.5 | 3.7 | 5.3 | 4.2 | 4.2 | 2.8 |
| STEM (other) plus health care | 29.5 | 23.1 | 28.3 | 20.3 | 23.6 | 17.8 |
| Non-STEM (business) | 26.2 | 29.0 | 26.6 | 27.8 | 34.5 | 27.3 |
| Non-STEM (other) | 35.8 | 44.1 | 39.9 | 47.7 | 37.8 | 52.1 |
|
Notes: The field of study refers to the first enrolment after the potential layoff. STEM stands for "science, technology, engineering and mathematics." Sources: Statistics Canada, Longitudinal Worker File, Postsecondary Student Information System, 2006 Census of Population and T1 Family File. |
||||||
Job loss is not necessarily a random event. For example, individual workers in specific industries, or who share certain qualifications, may be targeted for business reasons. As a result, the different educational outcomes observed so far may be the result of these other potentially confounding factors. Thus, it is important to document those differences. In doing so, the focus will be on the three analytical samples used in this study: the full sample, the sample enrolled in postsecondary, and the sample enrolled in a postsecondary program with a field of study.
Several important differences are worth noting. Beginning with personal characteristics and the full sample, members of the layoff group were substantially less likely to be women (37.2%) than those in the non-layoff group (48.7%). The members of the layoff group were also considerably younger, with 24.7% being in the 25 to 34 age range compared with 18.3% in the same range for the non-layoff group. For previous education, the layoff group was more likely to have no credential, a high school certificate, a trades certificate or a registered apprenticeship certificate (65.1%) compared with the non-layoff group (49.7%). However, those in the layoff group were far less likely to have a bachelor’s degree (15.7%) compared with the non-layoff group (8.8%). There were also notable differences across other dimensions. In particular, those in the layoff group were somewhat more likely than the non-layoff group to report Indigenous identity or to be an immigrant. Members of the layoff group were also less likely to be married or be in a common-law relationship (70.9%) than their counterparts in the non-layoff group (76.7% and 62.9%, respectively). Moreover, members of the layoff group had slightly fewer young (younger than age 5) and older (aged 5 to 17 years) children than members of the non-layoff group, on average.
The distribution of personal characteristics in the other two remaining analytical samples—postsecondary enrolment and postsecondary enrolment with a field of study—were mostly similar to the full sample, with a couple of exceptions. In the postsecondary enrolment with a field of study sample, the age differences between the layoff and non-layoff groups were much smaller compared with the other two samples, whereas education differences were somewhat smaller.
The focus now shifts to the workers’ job characteristics that were measured in 2008, the year preceding the potential layoff. In the full sample, the layoff group had a larger share of workers from Alberta (13.1%) than the non-layoff group (10.2%), and relatively fewer from Quebec (26.0% in the layoff group compared with 27.7% the non-layoff group). Not surprisingly, workers in the layoff group were much less likely to have worked for a firm with a union (19.1%) than those in the non-layoff group (35.1%), and more likely to have worked in a firm with fewer than 100 employees (51.1% in the layoff group and 31.3% in the non-layoff group). The workers in the layoff group were also much more likely to work in the construction and manufacturing sectors (16.4% and 26.2%, respectively, in the layoff group and 4.8% and 15.4%, respectively, in the non-layoff group), but much less likely to work in public services (5.3% in the layoff group and 28.8% in the non-layoff group). Lastly, workers in the layoff group also had considerably lower earnings, with 60.0% making less than $40,000 compared with only 40.1% in the non-layoff group. The distribution of job characteristics in the full sample was mostly the same as in the other two analytical samples (postsecondary enrolment and postsecondary enrolment with a field of study), with two notable exceptions. First, the layoff group was more likely to have workers from Ontario than the non-layoff group; in the other two samples, both groups had roughly the same share of workers from Ontario. Second, the earnings differences were much smaller in the postsecondary enrolment with a field of study sample.
The differences in personal and job characteristics between those who experienced a layoff and those who did not underscore the need for considering them in a multivariate framework when comparing the educational choices of the two groups. These characteristics could, in principle, influence schooling decisions independently of layoff history.
In Table 3, regression results are shown for men and women and for each of the program/credential type outcomes examined previously in Chart 2. Each outcome is examined separately in a linear probability model, with the key independent variable being a binary indicator for experiencing a permanent layoff. The first set of models include no covariates, while the second set includes a large number of personal and job covariates described in the table notes.
The results suggest that men and women who were permanently laid-off were more likely to select career, technical or professional training (certificates and diplomas) than their counterparts who were not laid-off, even after accounting for differences in personal and job characteristics. Similarly, a layoff was associated with a higher probability of enrolling in basic education and skills training (for men), as well as attestations and other short-term credentials (for women). However, a layoff was not associated with a higher probability of enrolling in other short-term, career-focused programs, as it was the case in the univariate results. This included apprenticeship training, attestations and other short-training credentials, and (for women) basic education and skills training. Another important difference in the multivariate results is that the coefficient associated with degree enrolment was much smaller after accounting for personal and job characteristics. In fact, no significant difference remained for women.
| Men | Women | |||||||
|---|---|---|---|---|---|---|---|---|
| No covariates | Personal and job characteristics added | No covariates | Personal and job characteristics added | |||||
| coefficient | standard error | coefficient | standard error | coefficient | standard error | coefficient | standard error | |
| Basic education and skills (other than high school diploma or general equivalency diploma) | 0.015Note ** | 0.005 | 0.010Note * | 0.004 | 0.018Note * | 0.007 | 0.007 | 0.006 |
| High school diploma or general equivalency diploma | 0.002 | 0.001 | 0.001 | 0.002 | 0.002 | 0.002 | 0.000 | 0.002 |
| Non-credential, non-program enrolment | -0.131Note *** | 0.015 | -0.091Note *** | 0.013 | -0.118Note *** | 0.018 | -0.114Note *** | 0.015 |
| Other type of postsecondary credential (not elsewhere classified) | 0.013Table 3 Note † | 0.007 | 0.005 | 0.006 | 0.022Note * | 0.009 | 0.015Note * | 0.006 |
| Attestation and other short program credentials | 0.009 | 0.008 | 0.008 | 0.005 | 0.018Table 3 Note † | 0.009 | 0.013Table 3 Note † | 0.008 |
| Apprenticeship certificate or diploma | 0.038Note *** | 0.008 | -0.007 | 0.006 | 0.007 | 0.005 | 0.001 | 0.003 |
| Qualifying or pre-postsecondary | 0.003 | 0.003 | 0.000 | 0.001 | -0.001Table 3 Note † | 0.001 | -0.002Table 3 Note † | 0.001 |
| Career, technical or professional training certificate | 0.059Note *** | 0.010 | 0.050Note *** | 0.009 | 0.059Note *** | 0.013 | 0.037Note *** | 0.011 |
| Career, technical or professional training diploma | 0.055Note *** | 0.010 | 0.034Note *** | 0.008 | 0.078Note *** | 0.013 | 0.044Note *** | 0.011 |
| Undergraduate certificate, diploma or associate degree | -0.010Note * | 0.004 | 0.001 | 0.004 | -0.028Note *** | 0.006 | -0.014Note * | 0.006 |
| Degree | -0.047Note *** | 0.006 | -0.013Note ** | 0.005 | -0.043Note *** | 0.010 | 0.004 | 0.008 |
| Post-program certificate or diploma, health-related residency program, or graduate certificate or diploma | -0.008Note *** | 0.002 | 0.002 | 0.002 | -0.013Note ** | 0.004 | 0.009Note * | 0.004 |
Sources: Statistics Canada, Longitudinal Worker File, Postsecondary Student Information System, 2006 Census of Population and T1 Family File. |
A similar analysis was conducted for the field of study choice (Table 4). The results reveal that after accounting for differences in personal and job characteristics, women who were laid-off were still more likely to take STEM programs. This was true for both categories of STEM programs, but it was more evident in STEM (Other) plus health care programs (where a permanent layoff was associated with a higher probability of enrolment equivalent to 6.2 percentage points). The same was true for their male counterparts, but to a much lesser extent. Finally, a permanent layoff was associated with a lower probability of enrolment in non-STEM (Business) programs compared to not being laid-off equivalent to 4.6 and 4.1 percentage points for men and women, respectively.
| Men | Women | |||||||
|---|---|---|---|---|---|---|---|---|
| No covariates | Personal and job characteristics added | No covariates | Personal and job characteristics added | |||||
| coefficient | standard error | coefficient | standard error | coefficient | standard error | coefficient | standard error | |
| STEM (mathematics-intensive) | 0.050Note ** | 0.018 | 0.026 | 0.018 | 0.026Note * | 0.011 | 0.021Table 4 Note † | 0.011 |
| STEM (other) plus health care | 0.025Table 4 Note † | 0.013 | 0.024Table 4 Note † | 0.014 | 0.069Note ** | 0.022 | 0.062Note ** | 0.022 |
| Non-STEM (business) | -0.084Note *** | 0.016 | -0.046Note ** | 0.016 | 0.003 | 0.022 | -0.041Table 4 Note † | 0.022 |
| Non-STEM (other) | 0.009 | 0.023 | -0.004 | 0.022 | -0.098Note *** | 0.024 | -0.042Table 4 Note † | 0.024 |
Sources: Statistics Canada, Longitudinal Worker File, Postsecondary Student Information System, 2006 Census of Population and T1 Family File. |
Conclusion
A permanent layoff often leads to substantial negative labour market outcomes that can have a lasting impact, such as a lower earnings trajectory. One way individuals can mitigate this situation is by acquiring a postsecondary education. Traditionally, data limitations made it difficult to study these decisions in detail, especially since permanent layoffs are relatively rare events. Nevertheless, recent data developments have enabled this analysis through the creation of linked data from the LWF, the PSIS, the 2006 Census of Population and the T1FF. Consequently, the goal of this paper was to examine the detailed postsecondary education schooling decisions of laid-off workers using these data.
The study found that a permanent layoff was associated with an increased likelihood of enrolling in postsecondary education, and once there, a greater propensity to enrol in certain shorter, career-focused programs, and a lower propensity to enrol in longer degree programs. These results may reflect the shorter time horizon faced by displaced workers, because many may need to re-enter the workforce as soon as possible to pay bills and care for dependants.
A useful next step would be to examine the long-term labour market consequences of post-displacement educational decisions of affected workers.
References
Bonikowska, A., and R. Morissette. 2012. Earnings Losses of Displaced Workers with Stable Labour Market Attachment: Recent Evidence from Canada. Analytical Studies Branch Research Paper Series, no. 346. Statistics Canada Catalogue no. 11F0019M. Ottawa: Statistics Canada.
Chan, P.C.W., Handler, T., and Frenette, M. 2021. Gender differences in STEM enrolment and graduation: What are the roles of academic performance and preparation? Economic and Social Reports, Statistics Canada Catalogue no. 36-28-0001. Ottawa: Statistics Canada.
Chan, P.C.W., Morissette, R., and Frenette, M. 2011. Workers Laid-off During the Last Three Recessions: Who Were They, and How Did They Fare? Analytical Studies Branch Research Paper Series, no. 337. Statistics Canada Catalogue no. 11F0019M. Ottawa: Statistics Canada.
Chan, P.C.W., R. Morissette, and H. Qiu. 2020. COVID-19 and Job Displacement: Thinking about the Longer Term. STATCAN COVID-19: Data to Insights for a Better Canada. Statistics Canada Catalogue no. 45280001. Ottawa: Statistics Canada.
Ci, W., M. Frenette, and R. Morissette. 2016. Do Layoffs Increase Transitions to Postsecondary Education Among Adults? Analytical Studies Branch Research Paper Series, no. 380. Statistics Canada Catalogue no. 11F0019M. Ottawa: Statistics Canada.
Couch, Kenneth A., and Dana W. Placzek. 2010. “Earnings Losses of Displaced Workers Revisited.” American Economic Review 100 (1): 572–89.
Eliason, M., and D. Storrie. 2006. “Lasting or latent scars? Swedish evidence on the long-term effects of job displacement.” Journal of Labor Economics 24 (4): 831–856.
Frenette, M., and Handler, T. 2020a. Which Bachelor’s Degree Programs Were Associated with the Highest Pay Prior to the COVID-19 Pandemic? A Focus on Very Detailed Fields of Study. Economic Insights, no. 120, Statistics Canada Catalogue no. 11-626-X. Ottawa: Statistics Canada.
Frenette, M., and Handler, T. 2020b. Which Master’s Degree Programs Were Associated with the Highest Pay Prior to the COVID-19 Pandemic? A Focus on Very Detailed Fields of Study. Economic Insights, no. 121, Statistics Canada Catalogue no. 11-626-X. Ottawa: Statistics Canada.
Frenette, M., and Handler, T. 2020c. Which Doctoral Degree Programs Were Associated with the Highest Pay Prior to the COVID-19 Pandemic? A Focus on Very Detailed Fields of Study. Economic Insights, no. 122, Statistics Canada Catalogue no. 11-626-X. Ottawa: Statistics Canada.
Frenette, M., R. Upward, and P.W. Wright. 2011. The Long-term Earnings Impact of Postsecondary-education Following Job Loss. Analytical Studies Branch Research Paper Series, no. 334. Statistics Canada Catalogue no. 11F0019M. Ottawa: Statistics Canada.
Hijzen, A., R. Upward, and P.W. Wright. 2010. “The income losses of displaced workers.” Journal of Human Resources 45 (1): 243–269.
Huttunen, K., J. Møen, and K. Salvanes. 2006. How Destructive is Creative Destruction? Investigating Long-term Effects of Worker Displacement. IZA Discussion Paper 2316. Bonn, Germany: Institute for the Study of Labor.
Jacobson, L., R.J. Lalonde, and D.G. Sullivan. 1993. “Earnings losses of displaced workers.” American Economic Review 83 (4): 685–709.
Jacobson, L., R.J. Lalonde, and D.G. Sullivan. 2005. “Estimating the returns to community college schooling for displaced workers.” Journal of Econometrics 125 (1–2): 271–304.
Jacobson, L., LaLonde, R.J., & Sullivan, D.G. 2011. Policies to reduce high-tenured displaced workers’ earnings losses through retraining. Washington, DC: Brookings.
Morissette, R. and H. Qiu. 2020. Permanent Layoff Rates in Canada, 1978 to 2016. Economic Insights, no. 108. Statistics Canada Catalogue no. 11-626-X. Ottawa: Statistics Canada.
Morissette, R. and H. Qiu. 2021. Workers’ Responses to Job Loss When Employment Opportunities are Scarce. Economic and Social Reports, 1 (2). Statistics Canada Catalogue no. 36-28-001. Ottawa: Statistics Canada.
Morissette, R., H. Qiu, and P.C.W. Chan. 2013. “The risk and cost of job loss in Canada, 1978–2008.” Canadian Journal of Economics 46 (4): 1480–1509.
Morissette, R., X. Zhang, and M. Frenette. 2007. Earnings Losses of Displaced Workers: Canadian Evidence from a Large Administrative Database on Firm Closures and Mass Layoffs. Analytical Studies Branch Research Paper Series, no. 291. Statistics Canada Catalogue no. 11F0019M. Ottawa: Statistics Canada.
- Date modified: