
 StatCan COVID-19: Data to Insights for a Better Canada COVID-19 and job displacement: Thinking about the longer term

Archived Content
Information identified as archived is provided for reference, research or recordkeeping purposes. It is not subject to the Government of Canada Web Standards and has not been altered or updated since it was archived. Please "contact us" to request a format other than those available.
Text begins
It is too early to know how many Canadian workers will lose their job, i.e. will be permanently laid-off, as a result of the COVID-19 pandemicNote and what will happen to them financially after job loss. Yet a number of stylized facts emerge from the past. While these facts do not necessarily allow accurate predictions of the impact of the pandemic on job displacement, they provide a long-term perspective from which forthcoming labour market developments can be assessed. The goal of this article is to highlight these facts.
What we know so far
On average, 12.4% of Canadian paid workers aged 15 to 64 have been laid-off on a monthly basis since February 2020 (Table 1). In contrast, average monthly layoff rates during the first two months following previous labour market downturns varied between 2.5% and 3.5%.
During the last three recessions (1981-1982, 1990-1992 and 2008-2009), young workers, less educated workers, and recently hired workers were more likely to be laid-off—temporarily or permanently—than other employees (Chan, Morissette and Frenette, 2011). This is still the case so far: layoff rates since February 2020 have been higher among the aforementioned groups than among other groups of workers (Table 1).
During the last three recessions, roughly 45% of all laid-off workers were permanently laid-off (Table 1). The remainder were involved in temporary layoffs. But these temporarily laid-off workers were not insulated from subsequent job loss: about 15% of them lost their job year the following year.
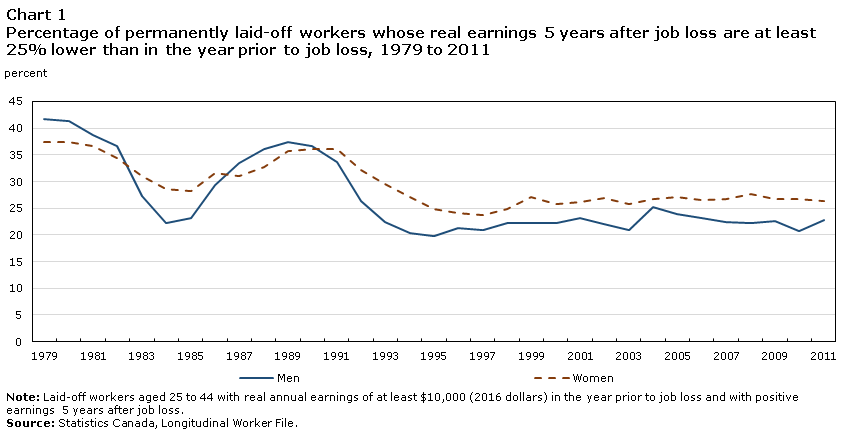
The degree to which the COVID-19 pandemic will result in permanent layoffs, i.e. job losses, is crucial to understanding how it might affect Canadian workers in the longer term. The reason is simple: job loss reduces the earnings of many displaced workers not only in the short term, but also in the longer term (Jacobson, Lalonde and Sullivan, 1993; Morissette, Zhang and Frenette, 2007; Morissette, Qiu and Chan, 2013). From the late 1970s to the early 2010s, at least one in five permanently laid-off workers saw their real earnings decline by at least 25% even five years after job loss (Chart 1).
Although Employment Insurance benefits offset part of the earnings losses, these benefits are usually exhausted after one year. As a result, five years after job loss, the earnings losses of displaced workers can be mitigated only by the progressivity of the tax and transfer system and, for some of those who are married or in a common-law relationship, by an increase in the annual hours worked by their spouse (Stephens, 2002).
What we do not know
How many Canadian workers will end up losing their job as a result of the COVID-19 pandemic and how these workers will fare after job loss remains unknown. The degree to which the pandemic will adversely affect Canadian workers in the longer term depends on several interrelated factors, such as the degree to which it will:
- affect consumption expenditures, as households try to improve their balance sheets;
- reduce exports, as Canada’s trading partners work towards re-opening their economies;
- stifle investment, as firms face uncertainty about the speed of the recovery and the possibility of subsequent lockdowns;
- reduce firm entry and increase firm closures (e.g. conventional retail trade stores);
- lead firms to automate certain tasks through the use of robots and computer algorithms;
- prompt firms to expand their telework and online sales capacity, adopt shiftwork and modify the work space to protect workers against subsequent waves of the virus;
- affect employment by generating new business costs related to the implementation of sanitary and physical distancing measures in the workplace;
- reduce world oil prices and employment in the energy sector;
- induce displaced workers to retire early or to upgrade their skills and move to dynamic regions, as the pandemic subsides.
| Labour market downturn | Average monthly layoff rates | |||
|---|---|---|---|---|
| 1981 to 1982 | 1990 to 1992 | 2008 to 2009 | February-March and March-April 2020 | |
| percent | ||||
| Overall | 3.5 | 3.4 | 2.5 | 12.4 |
| Men | 3.9 | 4.1 | 3.3 | 12.2 |
| Women | 2.9 | 2.5 | 1.8 | 12.6 |
| Age group | ||||
| 15 to 24 | 5.2 | 4.8 | 4.1 | 25.1 |
| 25 to 44 | 2.9 | 3.1 | 2.1 | 10.7 |
| 45 to 64 | 2.8 | 2.9 | 2.3 | 9.9 |
| Educational attainment | ||||
| Below Bachelor's degree | 3.8 | 3.8 | 3.0 | 15.1 |
| Bachelor's degree or higher | 1.2 | 0.8 | 1.1 | 7.2 |
| Tenure with employer | ||||
| Less than 2 years | 6.2 | 6.2 | 4.3 | 17.7 |
| 2 to 5 years | 2.5 | 2.2 | 2.0 | 13.2 |
| More than 5 years | 1.3 | 1.4 | 1.4 | 8.2 |
| Permanently laid-off workers as a percentage of all laid-off workers | 46.2 | 46.4 | 44.6 | Note ...: not applicable |
| Percentage of temporarily laid-off workers who lose their job the following year | 15.2 | 16.4 | 15.4 | Note ...: not applicable |
|
... not applicable Notes: Paid workers aged 15 to 64. Montly layoff rates include temporary layoffs and permanent layoffs and are computed for the first two pairs of months of each labour market downturn. Source: Statistics Canada, Labour Force Survey and Longitudinal Worker File. |
||||
Data table for Chart 1
| All industries | ||
|---|---|---|
| Men | Women | |
| percent | ||
| 1979 | 41.7 | 37.4 |
| 1980 | 41.4 | 37.3 |
| 1981 | 38.8 | 36.7 |
| 1982 | 36.6 | 34.4 |
| 1983 | 27.3 | 31.0 |
| 1984 | 22.3 | 28.7 |
| 1985 | 23.3 | 28.2 |
| 1986 | 29.3 | 31.7 |
| 1987 | 33.4 | 31.0 |
| 1988 | 36.1 | 32.8 |
| 1989 | 37.4 | 35.6 |
| 1990 | 36.6 | 36.1 |
| 1991 | 33.6 | 36.1 |
| 1992 | 26.4 | 32.2 |
| 1993 | 22.3 | 29.6 |
| 1994 | 20.4 | 27.2 |
| 1995 | 19.8 | 24.8 |
| 1996 | 21.3 | 24.0 |
| 1997 | 20.9 | 23.7 |
| 1998 | 22.3 | 24.9 |
| 1999 | 22.3 | 27.0 |
| 2000 | 22.3 | 25.8 |
| 2001 | 23.2 | 26.1 |
| 2002 | 22.1 | 26.8 |
| 2003 | 20.9 | 25.8 |
| 2004 | 25.2 | 26.7 |
| 2005 | 23.8 | 27.0 |
| 2006 | 23.1 | 26.5 |
| 2007 | 22.4 | 26.7 |
| 2008 | 22.2 | 27.6 |
| 2009 | 22.7 | 26.8 |
| 2010 | 20.7 | 26.6 |
| 2011 | 22.7 | 26.4 |
|
Note: Laid-off workers aged 25 to 44 with real annual earnings of at least $10,000 (2016 dollars) in the year prior to job loss and with positive earnings 5 years after job loss. Source: Statistics Canada, Longitudinal Worker File. |
||
References
Chan, W., R. Morissette and M. Frenette. 2011. “Workers Laid-off During the Last Three Recessions: Who Were They, and How Did They Fare?”, Statistics Canada catalogue no. 11F0019M, Analytical Studies Branch Research Paper Series. No. 337.
Jacobson, L.S., R.J. LaLonde, and D.G. Sullivan. 1993. “Earnings Losses of Displaced Workers” American Economic Review. 83(4), 685−709.
Morissette, R., X. Zhang and M. Frenette. 2007. “Earnings Losses of Displaced Workers: Canadian Evidence from a Large Administrative Database” Statistics Canada catalogue no. 11F0019M, Analytical Studies Branch Research Paper Series. No. 291.
Morissette, R., H. Qiu, and P.C.W. Chan. 2013. “The Risk and Cost of Job Loss in Canada, 1978-2008”, Canadian Journal of Economics, 46(4), 1480-1509.
Stephens, M. 2002. “Worker Displacement and the Added Worker Effect.” Journal of Labor Economics. 20, 3: 504–537.
- Date modified: