
Economic and Social Reports
Workers’ responses to job loss when employment opportunities are scarce
DOI: https://doi.org/10.25318/36280001202100200002-eng
Skip to text
Text begins
Abstract
This Insights article examines the degree to which workers who lost their job in 2009 started a business, changed regions, went back to school or began a registered apprenticeship in 2010, the year following job loss. The analysis combines the 2001 Census of Population with Statistics Canada’s Longitudinal Worker File and Registered Apprenticeship Information System. The study shows that about one in six displaced workers used at least one of the aforementioned adjustment strategies in 2010. Displaced workers who did not find a new paid job in 2010 were more likely to do so than their counterparts who found a new paid job that year. Yet three-quarters of the displaced workers who had no paid job in 2010 did not use any of the four strategies defined above.
Authors
René Morissette and Hanqing Qiu are with the Social Analysis and Modelling Division, Analytical Studies Branch at Statistics Canada.
Introduction
As a result of the COVID-19 pandemic, thousands of Canadian workers have been laid off, many of them permanently. These job losses raise several questions. Which strategies will these displaced workers use to cope with job loss? More generally, how do displaced workers respond to job loss when employment opportunities are relatively scarce? How many start a business, move to another region, go back to school or begin a registered apprenticeship? The answers to these questions are relevant to discussions about designing appropriate policies, if any, to help displaced workers in Canada.
Using a dataset that links the 2001 Census of Population with Statistics Canada’s Longitudinal Worker File and Registered Apprenticeship Information System, this study documents how displaced workers respond to job loss when employment opportunities are scarce. The study follows workers who were permanently laid off in 2009, i.e., in the middle of the 2008-2009 recession. It examines four adjustment strategies used in response to job loss: changing regions, moving into unincorporated self-employment, entering postsecondary education and beginning a registered apprenticeship.Note The focus is on workers who were aged 25 to 44 in 2001 and, therefore, aged 33 to 52 when they lost their job in 2009.Note The full version of the study was published by the Institute for Research on Public Policy (Morissette and Qiu 2021).
Although the findings of this study cannot necessarily be generalized to years of economic expansion, they are informative about how Canadian workers adjusted to job loss during the last recession prior to the COVID-19 pandemic. In other words, these findings highlight the fairly recent responses of Canadian workers to job loss during a period of slack labour markets. Such information is valuable as Canadian workers go through the unprecedented economic shock triggered by COVID-19.
Roughly one in six workers displaced in 2009 used at least one adjustment strategy in 2010
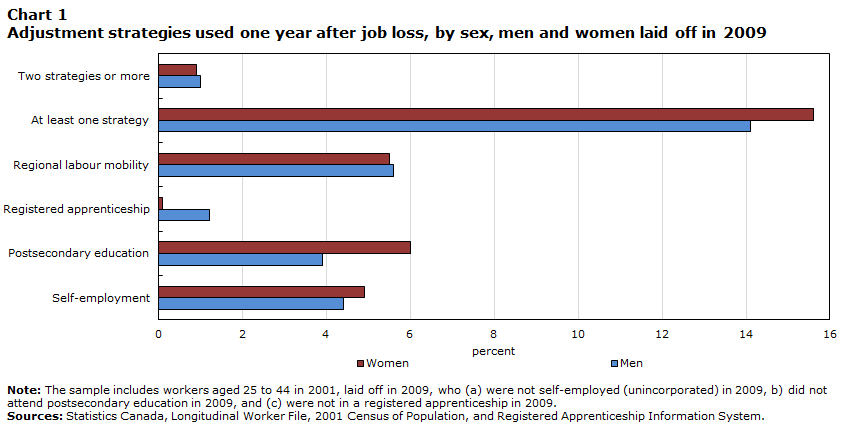
Chart 1 shows the degree to which men and women laid off in 2009 used specific adjustment strategies in 2010, the year following job loss.
The first pattern that emerges is that laid-off workers used transitions into postsecondary education, transitions into unincorporated self-employment and regional mobility roughly to the same degree to cope with job loss in the short run. Between 4% and 6% of laid-off men and women entered postsecondary education in 2010. A similar proportion—close to 6%—changed economic regions from the year prior to job loss (2008) to the year following job loss (2010). Slightly more than 4% moved into unincorporated self-employment in 2010. In contrast, no more than 1% began a registered apprenticeship.
Overall, between 14% and 16% of laid-off workers used at least one of these four strategies.Note This implies that at least 8 displaced workers out of 10 used none of these strategies in the short run. This proportion is very similar to the overall proportion of displaced workers who, from 2000 to 2007, found a new job in the year following job loss (80%). This in turn suggests that many of the displaced workers who did not use any adjustment strategies may have found a job in 2010. Only a minority of the workers displaced in 2009—about 1%—used more than one strategy.
Data table for Chart 1
| Men | Women | |
|---|---|---|
| percent | ||
| Two strategies or more | 1.0 | 0.9 |
| At least one strategy | 14.1 | 15.6 |
| Regional labour mobility | 5.6 | 5.5 |
| Registered apprenticeship | 1.2 | 0.1 |
| Postsecondary education | 3.9 | 6.0 |
| Self-employment | 4.4 | 4.9 |
|
Note: The sample includes workers aged 25 to 44 in 2001, laid off in 2009, who (a) were not self-employed (unincorporated) in 2009, b) did not attend postsecondary education in 2009, and (c) were not in a registered apprenticeship in 2009. Sources: Statistics Canada, Longitudinal Worker File, 2001 Census of Population, and Registered Apprenticeship Information System. |
||
Displaced workers who had no job in 2010 were almost twice as likely as other displaced workers to use at least one adjustment strategy that year
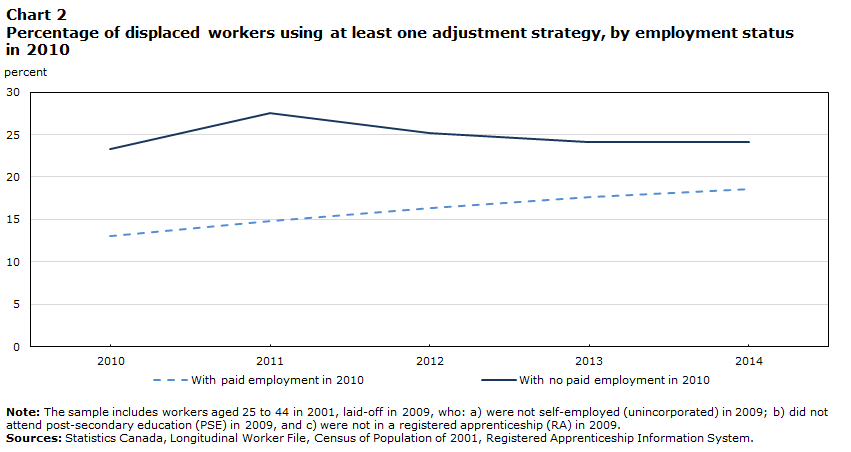
Displaced workers who did not have paid employment in the year following job loss were more likely to use at least one adjustment strategy than other displaced workers. This difference was mainly driven by the greater propensity of the former group to make transitions into self-employment or postsecondary education. However, differences in the propensity of the two groups to use at least one adjustment strategy narrowed over time. For example, 23% of the workers laid off in 2009 who had no paid job in 2010 used at least one adjustment strategy in that year (Chart 2). This was 10 percentage points higher than the corresponding proportion (13%) among their counterparts who had a new job in 2010. Five years after job loss, the propensity of the two groups to use at least at one strategy differed by five percentage points, at 24% and 19%, respectively.
Remarkably, three-quarters of the displaced workers who did not find a paid job in 2010 did not use any adjustment strategies that year. Some of them—for example, long-tenured displaced workers—might have been waiting for job offers that paid as well as their previous job and might have joined the ranks of the long-term unemployed. Others might have left the labour force temporarily and might have contributed to increases in the number of discouraged workers.Note
Data table for Chart 2
| With paid employment in 2010 | With no paid employment in 2010 | |
|---|---|---|
| percent | ||
| 2010 | 13.0 | 23.3 |
| 2011 | 14.8 | 27.5 |
| 2012 | 16.4 | 25.2 |
| 2013 | 17.7 | 24.1 |
| 2014 | 18.6 | 24.1 |
|
Note: The sample includes workers aged 25 to 44 in 2001, laid-off in 2009, who: a) were not self-employed (unincorporated) in 2009; b) did not attend post-secondary education (PSE) in 2009, and c) were not in a registered apprenticeship (RA) in 2009. Sources: Statistics Canada, Longitudinal Worker File, Census of Population of 2001, Registered Apprenticeship Information System. |
||
The patterns shown in Chart 2 need to be interpreted carefully. One interpretation is that workers who were hit severely by job loss—i.e., who had higher-than-average difficulty finding a paid job in the year following job loss—were more likely to transition into self-employment or postsecondary education than other laid-off workers. An alternative interpretation is that laid-off workers who chose to become self-employed or to go back to school after job loss had less time available to find paid employment and, as a result, were less likely to be employed in a paid job in the year following job loss.
Regardless of the interpretation, laid-off workers who did not have paid employment in the year following job loss appear to have done more to adjust to job loss than other laid-off workers. This is true for both men and women.
Different groups of displaced workers responded differently to job loss
Not all displaced workers responded to job loss in the same way. For example, 4.7% of laid-off women aged 48 to 52 attended a postsecondary institution in 2010, compared with 8.0% of those aged 33 to 37 (Table 1). Likewise, 4.5% of men aged 48 to 52 changed regions from 2008 to 2010, compared with 7.6% of men aged 33 to 37. The age differences in the propensity to make a transition into postsecondary education likely reflect—at least in part—the fact that the future (discounted) benefits of investments in additional schooling are generally lower for older displaced workers than for their younger counterparts. The age differences in regional mobility may be driven by a variety of factors such as differences in marriage rates, in attachment to family and friends, and in rates of homeownership, all of which may tend to reduce rates of labour mobility.
While regional mobility and transitions into postsecondary education fell with age, displaced workers’ transitions into unincorporated self-employment and postsecondary education increased with educational attainment. For example, roughly 7.5% of laid-off men with a bachelor’s degree or higher education moved into self-employment or attended a postsecondary institution in 2010, about twice the rate observed for their counterparts with a high school diploma or less.
The take-up of strategies varied by additional worker characteristics. For example, immigrant women who were laid off in 2009 were two times less likely than Canadian-born laid-off women to change economic regions from 2008 to 2010. Laid-off men with at least six years of tenure in their previous job tended to change regions to a lesser extent than their counterparts who, prior to job loss, had been hired within the last two years.
In sum, the study found that in the year following job loss:
- regional mobility was relatively low for older workers, immigrant workers and long-tenured men (those who had been with the same employer for at least six years prior to job loss);
- transitions into postsecondary education were relatively infrequent for older workers, less educated workers and men employed in the resource sector;
- transitions into unincorporated self-employment were relatively rare for less educated workers, men with activity limitations, and men and women laid off from firms with 500 employees or more;
- transitions into registered apprenticeship generally varied little across socioeconomic characteristics.
| Adjustment strategies | Men | Women | ||||||
|---|---|---|---|---|---|---|---|---|
| Self employment | PSE | RA | ∆ER | Self employment | PSE | RA | ∆ER | |
| percent | ||||||||
| All | 4.4 | 3.9 | 1.2 | 5.6 | 4.9 | 6.0 | 0.1 | 5.5 |
| Age in 2009 | ||||||||
| 33 to 37 | 4.8 | 5.3 | 1.8 | 7.6 | 5.7 | 8.0 | 0.1 | 6.9 |
| 38 to 42 | 4.3 | 4.3 | 1.2 | 6.1 | 5.2 | 6.6 | 0.0 | 5.4 |
| 43 to 47 | 4.1 | 3.9 | 1.3 | 5.0 | 4.6 | 5.2 | 0.1 | 5.0 |
| 48 to 52 | 4.3 | 2.5 | 0.7 | 4.5 | 4.4 | 4.7 | 0.1 | 5.1 |
| Education in 2001 | ||||||||
| High school or less | 4.1 | 3.2 | 1.1 | 5.4 | 4.3 | 4.9 | 0.1 | 5.5 |
| Trades certificate | 2.9 | 3.2 | 1.7 | 5.7 | 3.7 | 6.6 | 0.0 | 5.3 |
| PSE below bachelor's degree | 5.4 | 4.9 | 1.2 | 5.8 | 5.3 | 6.5 | 0.2 | 5.4 |
| Bachelor's degree or higher | 7.7 | 7.5 | 0.2 | 6.6 | 7.5 | 8.8 | 0.0 | 5.9 |
| Tenure in previous job | ||||||||
| 2 years or less | 4.1 | 3.4 | 1.2 | 6.4 | 5.1 | 5.8 | 0.1 | 6.0 |
| 3 to 5 years | 5.1 | 3.7 | 1.1 | 5.3 | 5.3 | 5.9 | 0.1 | 5.4 |
| 6 years or more | 4.3 | 5.4 | 1.2 | 4.1 | 4.0 | 6.6 | 0.1 | 4.7 |
| Immigrant status | ||||||||
| Born in Canada | 4.0 | 3.6 | 1.3 | 6.0 | 4.4 | 5.9 | 0.1 | 6.4 |
| Landed in last 10 years | 7.0 | 6.3 | 0.3 | 4.1 | 7.0 | 6.8 | 0.0 | 3.2 |
| Landed over 10 years ago | 4.9 | 3.7 | 0.6 | 3.6 | 5.5 | 5.7 | 0.1 | 3.1 |
| Non-permanent resident | 9.5 | 10.5 | 2.2 | 13.5 | 4.6 | 8.4 | 0.0 | 3.1 |
| Disability status in 2001 | ||||||||
| Not disabled | 4.5 | 3.9 | 1.2 | 5.5 | 4.8 | 5.9 | 0.1 | 5.4 |
| Yes, sometimes | 3.7 | 4.5 | 0.5 | 8.7 | 6.2 | 8.1 | 0.0 | 6.5 |
| Yes, often | 2.3 | 3.9 | 0.7 | 4.5 | 3.8 | 4.7 | 0.1 | 7.4 |
| Not stated | 2.5 | 0.0 | 0.0 | 7.8 | 9.4 | 7.2 | 0.0 | 6.9 |
| Industry of previous job | ||||||||
| Mining, oil and gas | 4.2 | 2.3 | 2.3 | 9.6 | 2.9 | 5.3 | 0.0 | 9.0 |
| Construction | 2.7 | 2.3 | 1.9 | 5.1 | 3.9 | 4.8 | 0.2 | 6.7 |
| Manufacturing | 4.1 | 5.7 | 1.2 | 4.6 | 3.6 | 6.2 | 0.1 | 4.7 |
| Low-skilled services | 6.1 | 4.4 | 0.6 | 6.5 | 5.5 | 7.1 | 0.0 | 5.7 |
| Highly skilled services | 4.3 | 3.3 | 0.4 | 5.6 | 4.4 | 4.2 | 0.1 | 5.2 |
| Public services | 5.0 | 5.3 | 1.0 | 8.9 | 4.5 | 7.1 | 0.1 | 6.1 |
| Other | 5.3 | 4.1 | 0.9 | 5.2 | 6.1 | 5.5 | 0.1 | 5.2 |
| Unknown | 4.1 | 1.2 | 0.5 | 5.9 | 7.0 | 3.1 | 0.0 | 7.0 |
| Firm size of previous job | ||||||||
| Fewer than 20 employees | 5.1 | 3.4 | 1.1 | 5.2 | 5.7 | 5.0 | 0.1 | 4.9 |
| 20 to 99 employees | 4.8 | 3.6 | 0.9 | 5.3 | 4.3 | 6.2 | 0.1 | 6.1 |
| 100 to 499 employees | 3.8 | 4.5 | 1.3 | 5.0 | 4.3 | 6.9 | 0.1 | 6.2 |
| 500 employees or more | 3.3 | 4.4 | 1.4 | 6.9 | 4.6 | 6.7 | 0.1 | 5.6 |
|
Note: The sample includes workers aged 25 to 44 in 2001, laid off in 2009, who (a) were not self-employed (unincorporated) in 2009, (b) did not attend postsecondary education (PSE) in 2009, and (c) were not in a registered apprenticeship (RA) in 2009. ∆ER means changing economic regions from 2008 to 2010. Sources: Statistics Canada, Longitudinal Worker File, 2001 Census of Population, and Registered Apprenticeship Information System. |
||||||||
Conclusion
An important concern that has emerged since the COVID-19 pandemic began is whether the current social safety net and retraining and education policies are well suited to provide assistance to the Canadians who have been displaced since mid-March 2020 and who will be displaced in coming months. While addressing this concern is an important task, it is also imperative to know which adjustment strategies displaced workers use to cope with job loss when employment opportunities are scarce. The goal of this study was to provide such information.
Using a linked dataset that combines administrative data and census data, the study documented the degree to which Canadian workers who were displaced in 2009 started a business, changed regions, went back to school or began a registered apprenticeship following job loss.
The numbers suggest that, because adjustment is either easier for them or financially more rewarding, relatively younger and more highly educated displaced workers often made greater use of adjustment strategies than other displaced workers. The fact that less educated workers used adjustment strategies relatively less is important. It raises the possibility that, in a context where these workers have been disproportionately affected by COVID-19, education and retraining programs might benefit them or reach them to a lesser extent than more highly educated workers.
Yet the study makes it clear that the likelihood of using a given adjustment strategy varies not only across age and education levels, but also across several additional dimensions. For example, regional mobility was shown to vary across immigrant status. These differences in regional mobility suggest that social factors (e.g., family considerations) might play an important role in individuals’ willingness to move to other areas to find employment (Morissette 2017).
Lastly, the study showed that the vast majority—three-quarters—of displaced workers who did not find a paid job in the year following job loss did not use any of the four strategies analyzed in this study in the short term. Identifying who these workers are, finding out why they did not use any of the aforementioned strategies to cope with job loss; and determining which policies, if any, can help them fare better in the labour market are important questions for future research.
References
Ci, W., M. Frenette, and R. Morissette. 2017. Do Layoffs Increase Transitions to Postsecondary Education Among Adults? Analytical Studies Branch Research Paper Series, no. 380. Statistics Canada Catalogue no. 11F0019M. Ottawa: Statistics Canada.
Frenette, M., R. Upward, and P.W. Wright. 2011. The Long-term Earnings Impact of Post-secondary Education Following Job Loss. Analytical Branch Research Paper Series, no. 334. Statistics Canada Catalogue no. 11F0019M. Ottawa: Statistics Canada.
Huttunen, K., J. Moen, and K.G. Salvanes. 2018. “Job loss and regional mobility. ” Journal of Labor Economics 36 (2): 479–509.
Morissette, R. 2017. Barriers to Labour Mobility in Canada: Survey-based Evidence. Economic Insights, no. 76. Statistics Canada Catalogue no. 11-626-X. Ottawa: Statistics Canada.
Morissette, R. and T.H. Qiu. 2021. Adjusting to Job Loss When Times Are Tough. IRPP Study 82. Montreal: Institute for Research on Public Policy.
Von Greiff, J. 2009. “Displacement and self-employment entry.” Labour Economics 16: 556–565.
- Date modified: