
Canada at a Glance, 2022
Environment

Archived Content
Information identified as archived is provided for reference, research or recordkeeping purposes. It is not subject to the Government of Canada Web Standards and has not been altered or updated since it was archived. Please "contact us" to request a format other than those available.
Population and the environment
Did you know?
- In 2018, 250,323 tonnes of plastic from residential sources were diverted from landfills and incinerators.
- In 2019:
- 22% of households were environmentally engaged, without pay, in activities aimed at conservation or protection of the environment or wildlife
- 76% of households composted either kitchen or yard waste
- the average amount of energy consumed per household was 90.5 gigajoules
- Canada’s per capita household greenhouse gas emissions were 3.8 tonnes per person.
- In 2021, 97% of households reported using their own bags or containers when grocery shopping.
Population and the environment… in numbers and pictures
Canadian greenhouse gas emissions attributable to households, 2018

Data table for Chart 33
| 2011 | 2013 | 2015 | 2017 | 2019 | |
|---|---|---|---|---|---|
| litres per person per day | |||||
| Average daily total litres per capita | 485 | 460 | 446 | 427 | 411 |
| Average daily residential litres per capita | 251 | 222 | 234 | 220 | 215 |
| Source: Table 38-10-0271-01. | |||||
Businesses and the environment
Did you know?
- Canadian businesses sold $19.5 billion worth of environmental and clean technology goods in 2020, while sales of related services accounted for $11.1 billion.
- The value of the environmental and clean technology products sector in Canada was $67.5 billion in 2020, accounting for 3.3% of Canadian gross domestic product.
- In 2020, 322,972 jobs were attributed to the environmental and clean technology sector in Canada.
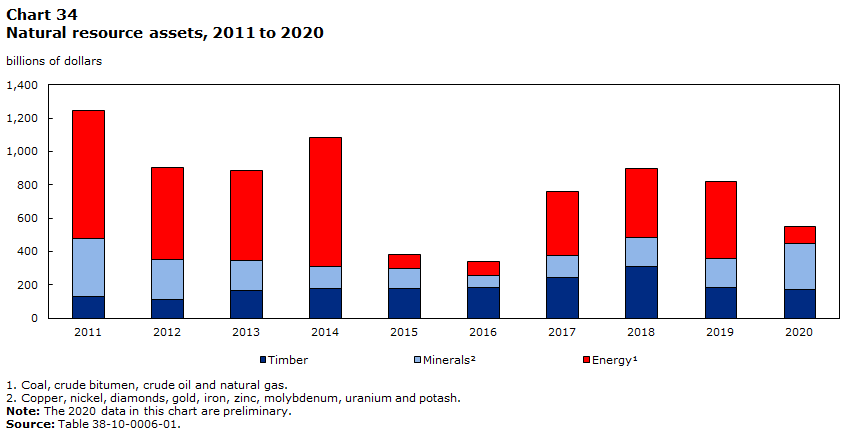
Data table for Chart 34
| Timber | MineralsData table for chart 33 Note 2 | EnergyData table for chart 33 Note 1 | |
|---|---|---|---|
| billions of dollars | |||
| 2011 | 127 | 349 | 769 |
| 2012 | 113 | 240 | 552 |
| 2013 | 163 | 184 | 541 |
| 2014 | 179 | 131 | 774 |
| 2015 | 176 | 120 | 83 |
| 2016 | 185 | 73 | 84 |
| 2017 | 245 | 131 | 386 |
| 2018 | 308 | 175 | 412 |
| 2019 | 186 | 172 | 460 |
| 2020 | 173 | 273 | 104 |
Source: Table 38-10-0006-01. |
|||
To learn more
- Date modified: