
Accounting for ecosystem change in Canada: selected findings from Human Activity and the Environment, 2021.

Archived Content
Information identified as archived is provided for reference, research or recordkeeping purposes. It is not subject to the Government of Canada Web Standards and has not been altered or updated since it was archived. Please "contact us" to request a format other than those available.
Release date: January 25, 2022
Description: Accounting for ecosystem change in Canada: selected findings from Human Activity and the Environment, 2021.
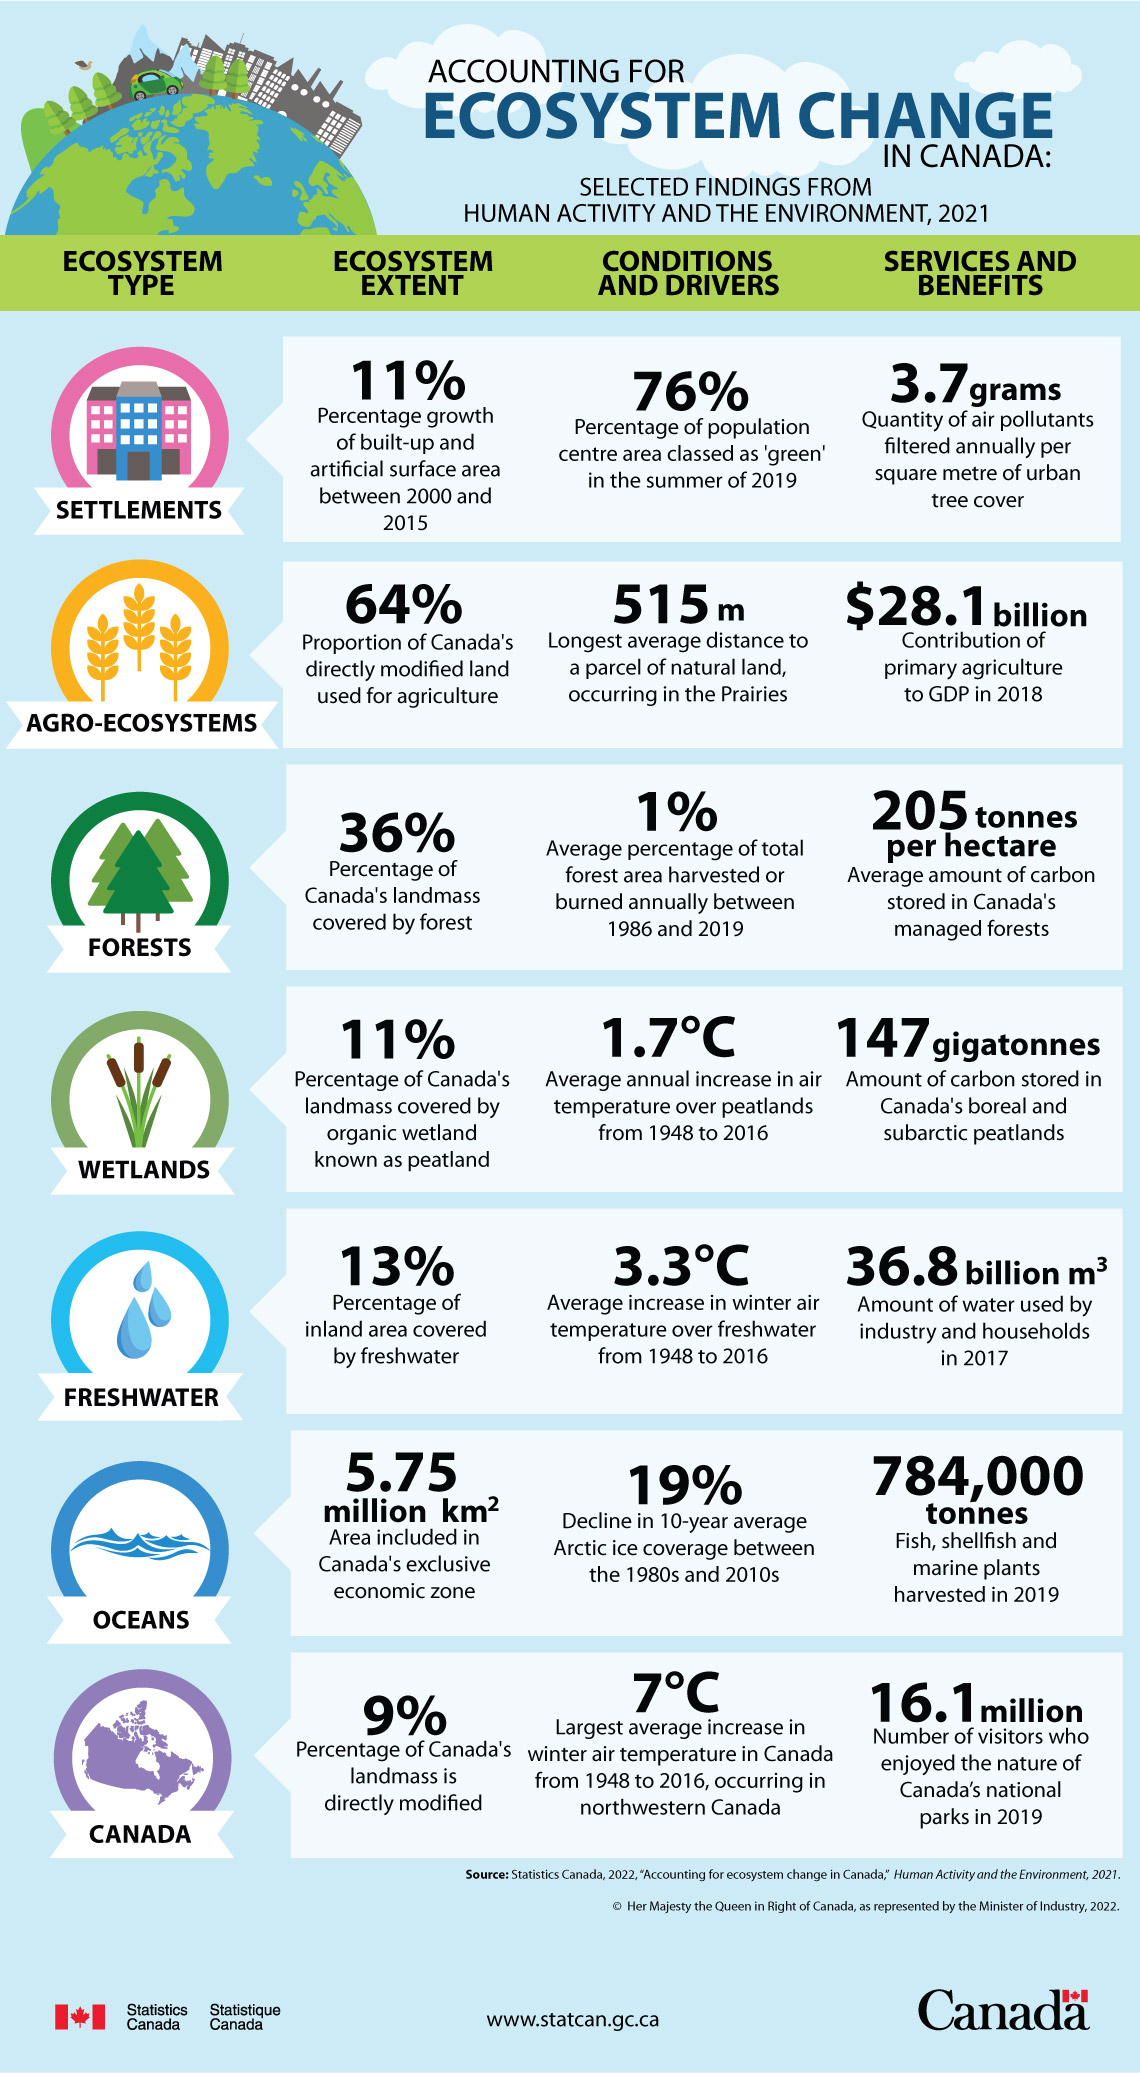
The title of this infographic is “Accounting for ecosystem change in Canada: selected findings from Human Activity and the Environment, 2021.”
On the page there are four columns, from left to right: Ecosystem type, Ecosystem extent, Condition and drivers, and Services and benefits. The rows are categorized by the first column heading - Ecosystem type.
| Ecosystem type | Ecosystem extent | Condition and drivers | Services and benefits |
|---|---|---|---|
| Settlements | 11% - Percentage growth of built-up and artificial surface area between 2000 and 2015 | 76% - Percentage of population centre area classed as 'green' in summer 2019 | 3.7 grams - Quantity of air pollutants filtered annually per square metre of urban tree cover |
| Agro-ecosystems | 64% - Proportion of Canada's directly modified land used for agriculture | 515 m - Longest average distance to a parcel of natural land, occuring in the Prairies | $28.1 billion - Contribution of primary agriculture to GDP in 2018 |
| Forests | 36% - Percentage of Canada's landmass covered by forest | 1% - Average percentage of total forest area harvested or burned annually between 1986 and 2019 | 205 tonnes per hectare - Average amount of carbon stored in Canada's managed forests |
| Wetlands | 11% - Percentage of Canada's landmass covered by organic wetland known as peatland | 1.7 °C - Average annual increase in air temperature over peatlands from 1948 to 2016 | 147 gigatonnes - Amount of carbon stored in Canada's boreal and subarctic peatlands |
| Freshwater | 13% - Percentage of inland area covered by freshwater | 3.3 °C - Average increase in winter air temperature over freshwater from 1948 to 2016 | 36.8 billion m3 - Amount of water used by industry and households in 2017 |
| Oceans | 5.75 million km2 - Area included in Canada's exclusive economic zone | 19% - Decline in 10-year average Arctic ice coverage between the 1980s and 2010s | 784,000 tonnes - Fish, shellfish and marine plants harvested in 2019 |
| Canada | 9% - Percentage of Canada's landmass is directly modified | 7 °C - Largest average increase in winter air temperature in Canada from 1948 to 2016, occurring in northwestern Canada | 16.1 million - Number of visitors who enjoyed the nature of Canada’s national parks in 2019 |
| Source: Statistics Canada, 2022, “Accounting for ecosystem change in Canada,” Human Activity and the Environment, 2021. | |||
- Date modified: