
Canada at a Glance, 2022
Travel and tourism

Archived Content
Information identified as archived is provided for reference, research or recordkeeping purposes. It is not subject to the Government of Canada Web Standards and has not been altered or updated since it was archived. Please "contact us" to request a format other than those available.
Travel and tourism… in brief
With the onset of the COVID-19 pandemic in 2020, travel and tourism were among the first- and hardest-hit sectors of the Canadian economy. Travel restrictions, border closures and business closures drastically curtailed non-resident arrivals to Canada and altered the travel behaviour of Canadians. As a result, some passenger industries, including airlines and urban transit, were devastated, while others continued to provide essential freight services, including rail and trucking. The food and accommodation industries, along with travel agencies and charter and sight-seeing activities suffered as the flow of international visitors to Canada was reduced to a trickle.

Data table for Chart 31
| Year | June (excluding Toronto Pearson Terminal 1) | June (including Toronto Pearson Terminal 1) |
|---|---|---|
| persons | ||
| 2019 | 970,596 | 0 |
| 2020 | 15,731 | 0 |
| 2021 | 26,225 | 0 |
| 2022 | 635,724 | 211,008 |
|
Note: Target population: All entries into Canada by international commercial air visitors or returning visitors who made their declaration at a Primary Inspection Kiosk (PIK). This excludes NEXUS travellers, commercial crew members as well as individuals who are arriving in Canada as immigrants or for work purposes. Source: Table 24-10-0056-01. |
||
Did you know?
- April 2020 marked the first full month of border restrictions enacted around the world, which brought international travel to and from Canada to a virtual stop. The number of non-domestic arrivals to Canada from overseas countries (countries other than the United States) fell by 96.6%, while those from the United States were down 96.8%.
- Over two years later, in June 2022, the number of international arrivals landing at Canadian airports was nearing levels recorded before the pandemic. Estimates of non-resident visitors totalled 846,700, up sharply compared with the 26,200 arrivals observed in June 2021.
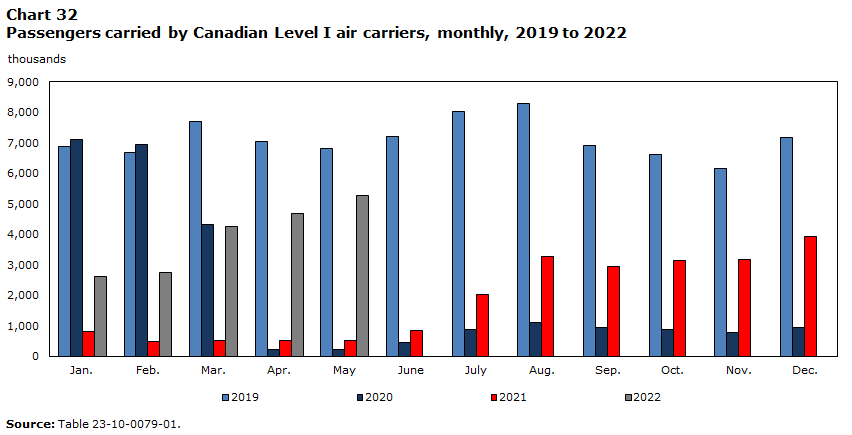
Data table for Chart 32
| Year | Jan. | Feb. | Mar. | Apr. | May | June | July | Aug. | Sep. | Oct. | Nov. | Dec. |
|---|---|---|---|---|---|---|---|---|---|---|---|---|
| thousands | ||||||||||||
| 2019 | 6,882 | 6,667 | 7,688 | 7,054 | 6,822 | 7,204 | 8,028 | 8,276 | 6,913 | 6,608 | 6,145 | 7,172 |
| 2020 | 7,092 | 6,946 | 4,322 | 213 | 227 | 449 | 860 | 1,106 | 931 | 886 | 781 | 934 |
| 2021 | 797 | 483 | 522 | 520 | 514 | 844 | 2,010 | 3,255 | 2,939 | 3,128 | 3,162 | 3,931 |
| 2022 | 2,606 | 2,730 | 4,244 | 4,669 | 5,276 | Note ..: not available for a specific reference period | Note ..: not available for a specific reference period | Note ..: not available for a specific reference period | Note ..: not available for a specific reference period | Note ..: not available for a specific reference period | Note ..: not available for a specific reference period | Note ..: not available for a specific reference period |
|
.. not available for a specific reference period Source: Table 23-10-0079-01. |
||||||||||||
Did you know?
- The impact of the COVID-19 pandemic was far more damaging to the airline industry than any other global event, including the terrorist attacks of September 11, 2001, or the severe acute respiratory syndrome (SARS) outbreak in 2003, which were both associated with year-over-year drops of more than 25% in air passengers. In April 2020, Canada’s airlines reported a year-over-year drop of 97.0% in passengers carried.
- Just over two years later, in May 2022, the 5.3 million passengers on scheduled and charter services reported by Canada’s major airlines were the highest monthly total since before the pandemic. The industry has now recovered over three-quarters (77.3%) of its pre-pandemic traffic.
| Activities, third quarter 2021 | Change, third quarter 2019 to third quarter 2021 | Change, third quarter 2019 to third quarter 2021 | |
|---|---|---|---|
| thousands | % | thousands | |
| Festival or fair | 756 | -82.1 | -3,473 |
| Performance such as a play or concert | 671 | -74.5 | -1,960 |
| Business meeting, conference or seminar | 827 | -63.3 | -1,424 |
| Go to the movies | 715 | -51.4 | -756 |
| Casino | 601 | -49.1 | -580 |
| Sports event as a spectator | 1,180 | -48.2 | -1,099 |
| Aboriginal event | 161 | -38.6 | -101 |
| Museum or art gallery | 2,300 | -29.0 | -941 |
| Zoo or aquarium | 1,443 | -28.1 | -564 |
| Historic site | 3,681 | -27.7 | -1,407 |
| Hiking or backpacking | 10,199 | 47.8 | 3,298 |
| Cycling | 3,661 | 42.7 | 1,096 |
| Golfing | 3,436 | 35.9 | 907 |
| National, provincial, or nature park | 11,952 | 29.6 | 2,731 |
| Canoeing or kayaking | 6,267 | 19.7 | 1,031 |
| Beach | 11,608 | 15.7 | 1,577 |
| Camping | 6,716 | 6.6 | 416 |
| Go wildlife viewing or birdwatching | 6,061 | 5.9 | 339 |
| Boating | 6,482 | 5.6 | 343 |
|
Note(s): Multiple counts: respondents can indicate multiple activities done on any given trip. Source(s): National Travel Survey (5232). |
|||
Did you know?
- During the busy summer travel season, from July to September 2021, fewer Canadians attended festivals or fairs, performances such as plays or concerts, or sporting events as spectators. Compared with the same period in 2019, relatively fewer Canadians reported attending such events, with declines of 82.1% for fairs and festivals, 74.5% for performances such as plays and concerts, and 48.2% for sporting events.
- By contrast, over the same period, more Canadians were engaging in outdoor activities. For example, relatively more travellers reported hiking or backpacking (+47.8%), cycling (+42.7%) and golfing (+35.9%) in the summer of 2021 as part of their domestic vacations.
To learn more
- Date modified: