Canada at a Glance, 2022
Housing
| Census metropolitan areas | Average monthly shelter cost per household |
|---|---|
| dollars | |
| Toronto | 1,880 |
| Montréal | 1,170 |
| Vancouver | 1,840 |
| Ottawa - Gatineau | 1,450 |
| Calgary | 1,670 |
| Edmonton | 1,580 |
| Québec | 1,040 |
| Winnipeg | 1,230 |
| Hamilton | 1,550 |
| Kitchener - Cambridge - Waterloo | 1,470 |
| Canada (provinces only) | 1,370 |
|
Notes: Shelter costs includes rent or mortgages, utilities, property taxes and condo fees. Dollar amounts are rounded to the nearest multiple of 10. Top 10 most populated census metropolitan areas based on 2021 Census. Source: Statistics Canada, Canadian Housing Survey, custom table. |
|
| Province | Total | Owner | Renter |
|---|---|---|---|
| Canada (provinces only) | 15,067,800 | 10,214,900 | 4,852,900 |
| Newfoundland and Labrador | 223,600 | 171,700 | 51,900 |
| Prince Edward Island | 67,400 | 47,200 | 20,200 |
| Nova Scotia | 416,700 | 286,500 | 130,100 |
| New Brunswick | 335,600 | 250,100 | 85,500 |
| Quebec | 3,701,200 | 2,289,100 | 1,412,100 |
| Ontario | 5,694,400 | 3,940,000 | 1,754,400 |
| Manitoba | 508,700 | 362,300 | 146,400 |
| Saskatchewan | 444,400 | 328,500 | 115,900 |
| Alberta | 1,598,700 | 1,151,300 | 447,600 |
| British Columbia | 2,077,200 | 1,388,400 | 688,800 |
| Source: Statistics Canada, Canadian Housing Survey, Table 46-10-0059-01. | |||

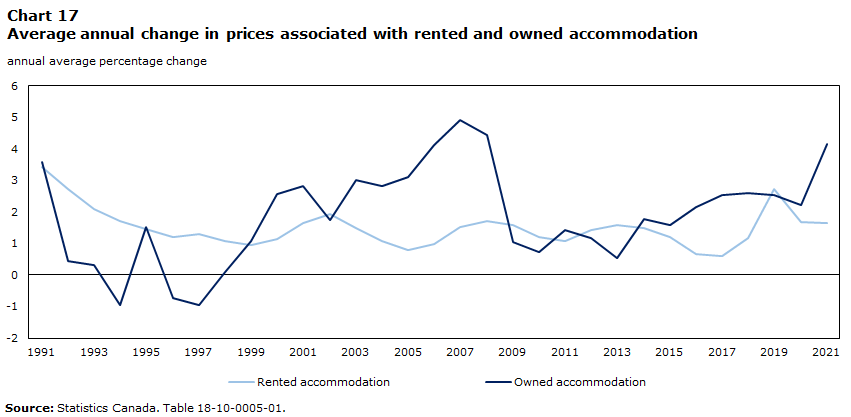
Data table for Chart 17
| All-items | Rented accommodation | Owned accommodation | |
|---|---|---|---|
| annual average percentage change | |||
| 1991 | 5.6 | 3.4 | 3.6 |
| 1992 | 1.4 | 2.7 | 0.4 |
| 1993 | 1.9 | 2.1 | 0.3 |
| 1994 | 0.1 | 1.7 | -1.0 |
| 1995 | 2.2 | 1.4 | 1.5 |
| 1996 | 1.5 | 1.2 | -0.7 |
| 1997 | 1.7 | 1.3 | -1.0 |
| 1998 | 1.0 | 1.1 | 0.1 |
| 1999 | 1.8 | 1.0 | 1.1 |
| 2000 | 2.7 | 1.2 | 2.6 |
| 2001 | 2.5 | 1.7 | 2.8 |
| 2002 | 2.2 | 1.9 | 1.7 |
| 2003 | 2.8 | 1.5 | 3.0 |
| 2004 | 1.8 | 1.1 | 2.8 |
| 2005 | 2.2 | 0.8 | 3.1 |
| 2006 | 2.0 | 1.0 | 4.1 |
| 2007 | 2.2 | 1.5 | 4.9 |
| 2008 | 2.3 | 1.7 | 4.4 |
| 2009 | 0.3 | 1.6 | 1.0 |
| 2010 | 1.8 | 1.2 | 0.7 |
| 2011 | 2.9 | 1.1 | 1.4 |
| 2012 | 1.5 | 1.4 | 1.2 |
| 2013 | 0.9 | 1.6 | 0.5 |
| 2014 | 2.0 | 1.5 | 1.8 |
| 2015 | 1.1 | 1.2 | 1.6 |
| 2016 | 1.4 | 0.7 | 2.1 |
| 2017 | 1.6 | 0.6 | 2.5 |
| 2018 | 2.3 | 1.2 | 2.6 |
| 2019 | 1.9 | 2.7 | 2.5 |
| 2020 | 0.7 | 1.7 | 2.2 |
| 2021 | 3.4 | 1.7 | 4.1 |
| Source: Statistics Canada. Table 18-10-0005-01. | |||
Did you know?
- Homeownership still eludes some population groups and the Residential Property Price Index shows that housing prices rose 20.6% from 2018 to 2021.
- In 2021, 11.9% of renters in the provinces lived in social and affordable housing (SAH).
- From 2018 to 2021, the annual average increase in shelter costs in Canada was 8.4%, according to the Consumer Price Index.
- Shelter costs rose at the fastest pace since 2008 as Canadians sought out additional living space and interest rates remained at historically low levels, among other pandemic-related factors.
To learn more
- Date modified: