
Canada at a Glance, 2022
Digital society

Archived Content
Information identified as archived is provided for reference, research or recordkeeping purposes. It is not subject to the Government of Canada Web Standards and has not been altered or updated since it was archived. Please "contact us" to request a format other than those available.

Data table for Chart 14
| percent | |
|---|---|
| All individuals | 94.2 |
| 15 to 24 | 98.9 |
| 25 to 34 | 98.5 |
| 35 to 44 | 98.4 |
| 45 to 54 | 96.9 |
| 55 to 64 | 94.4 |
| 65 to 74 | 90.5 |
| 75 and older | 70.8 |
|
Notes: 1. The target population is all people 15 years of age and older living in the 10 Canadian provinces. It excludes full-time residents of institutions (residing for more than six months). 2. The Canadian Internet Use Survey was redesigned in 2018 and its findings should not be compared with those from previous surveys. 3. Responses of "Not stated" are excluded from the numerator and the denominator. Source: Statistics Canada, special request, Canadian Internet Use Survey, 2020. |
|

Data table for Chart 15
| percent | |
|---|---|
| All individuals | 81.7 |
| 15 to 24 | 89.8 |
| 25 to 34 | 95.5 |
| 35 to 44 | 94.2 |
| 45 to 54 | 88.7 |
| 55 to 64 | 77.8 |
| 65 to 74 | 65.7 |
| 75 and older | 38.1 |
|
Notes: 1. The target population is all people 15 years of age and older living in the 10 Canadian provinces. It excludes full-time residents of institutions (residing for more than six months). 2. The Canadian Internet Use Survey was redesigned in 2018 and its findings should not be compared with those from previous surveys. 3. Only respondents who used the Internet in the past three months received this question. 4. Responses of "Not stated" are excluded from the numerator and the denominator. Source: Statistics Canada, special request, Canadian Internet Use Survey, 2020. |
|
Did you know?
- In 2020, 84.4% of Canadians owned a smartphone.
- Just over half of Canadians (53%) said that checking their smartphone was the first thing they did when they woke up and the last thing they did before going to bed (51%).
- In a typical day, 43% of Canadians said they checked their smartphone at least every 30 minutes.
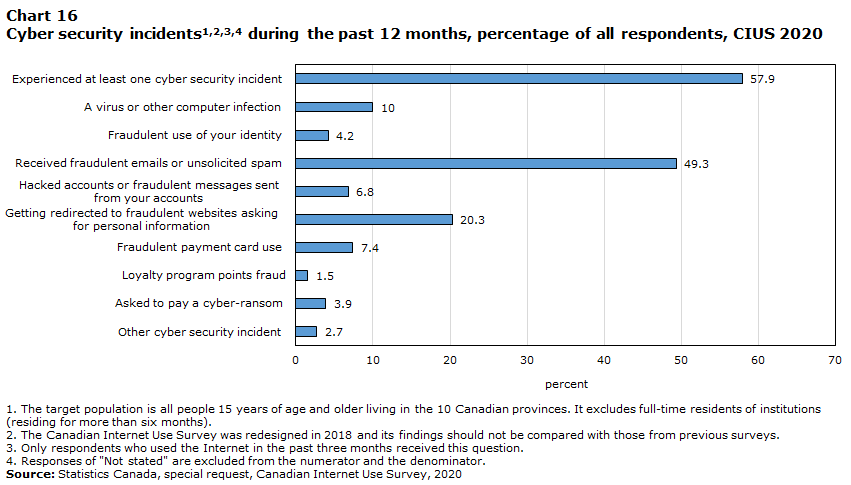
Data table for Chart 16
| percent | |
|---|---|
| Experienced at least one cyber security incident | 57.9 |
| A virus or other computer infection | 10.0 |
| Fraudulent use of your identity | 4.2 |
| Received fraudulent emails or unsolicited spam | 49.3 |
| Hacked accounts or fraudulent messages sent from your accounts |
6.8 |
| Getting redirected to fraudulent websites asking for personal information |
20.3 |
| Fraudulent payment card use | 7.4 |
| Loyalty program points fraud | 1.5 |
| Asked to pay a cyber-ransom | 3.9 |
| Other cyber security incident | 2.7 |
|
Notes: 1. The target population is all people 15 years of age and older living in the 10 Canadian provinces. It excludes full-time residents of institutions (residing for more than six months). 2. The Canadian Internet Use Survey was redesigned in 2018 and its findings should not be compared with those from previous surveys. 3. Only respondents who used the Internet in the past three months received this question. 4. Responses of "Not stated" are excluded from the numerator and the denominator. Source: Statistics Canada, special request, Canadian Internet Use Survey, 2020. |
|
To learn more
- Date modified: