Police-reported hate crime, 2022
Released: 2024-03-13
The number of hate crimes reported by police in Canada rose from 3,355 incidents in 2021 to 3,576 in 2022, a 7% increase. This followed two sharp annual increases, resulting in a cumulative rise of 83% from 2019 to 2022. In general, self-reported experiences of discrimination also increased during the first several months of the COVID-19 pandemic (Discrimination before and since the start of the pandemic).
Higher numbers of hate crimes targeting a race or an ethnicity (+12% to 1,950 incidents) and a sexual orientation (+12% to 491 incidents) accounted for most of the increase in 2022. In 2022, hate crimes targeting a religion were down 15% from 2021 yet remained above the annual numbers recorded from 2018 to 2020.
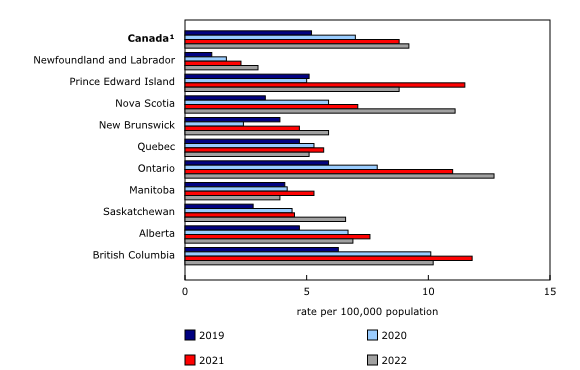
When accounting for population size, the rate of police-reported hate crime in Canada rose 5% in 2022 to 9.2 incidents per 100,000 population. The overall crime rate in Canada also rose 5% in 2022. From 2019 to 2022, however, the rate of police-reported hate crime rose 77%, while the overall crime rate declined by 4%. Among the provinces in 2022, Ontario (12.7 incidents per 100,000), Nova Scotia (11.1 incidents per 100,000) and British Columbia (10.2 incidents per 100,000) recorded the highest hate crime rates.
An interactive data visualization dashboard for police-reported hate crime statistics is now available through the Police-reported Information Hub: Hate crime in Canada. The accompanying infographic, "Infographic: Police-reported hate crime in Canada, 2022," is also now available.
This release and these products were made possible with funding support from the Department of Canadian Heritage.
Understanding police-reported hate crime information:
Police-reported data on hate crimes reflect only incidents that come to the attention of police and that are subsequently classified as confirmed or suspected hate-motivated crimes. Many factors can influence the likelihood that a given crime is reported to the police and subsequently reflected in police-reported statistics. General awareness among the community and the expertise of local police, and the relationship between a given community and the police, can play a role in whether and how a crime is reported. These and other factors can impact whether a hate crime comes to the attention of the police.
As a complement to police-reported data, self-reported data provide further insight into experiences of discrimination and hate-motivated crime. Specifically, according to the 2019 General Social Survey on Canadians' Safety (Victimization), Canadians were the victims of over 223,000 criminal incidents that they perceived as being motivated by hate in the 12 months that preceded the survey (3% of total self-reported criminal incidents). Approximately one in five of these incidents (22%) were reported to the police.
Police-reported hate crime data for 2023 will be released alongside other police-reported crime data in summer 2024.
Violent and non-violent hate crimes continue to rise
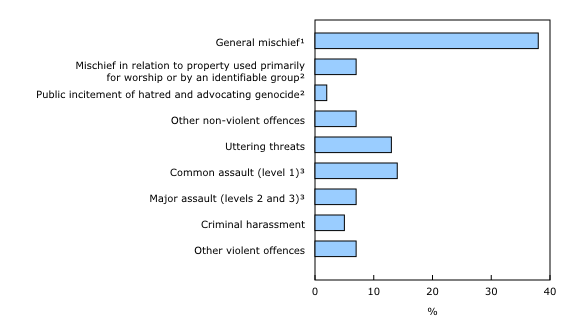
The proportion of violent (46%) and non-violent (54%) hate crimes reported in 2022 were similar to previous years, with the majority of hate crimes being non-violent. Violent hate crimes increased 12%, and non-violent hate crimes increased 3%.
The rise in violent hate crime in 2022 was the result of more incidents of several violations, including common (level 1) assault (+72 incidents), uttering threats (+26 incidents), and major (levels 2 and 3) assault (+20 incidents). Hate-related homicide was also up, with the number of victims rising 53% from 15 in 2021 to 23 in 2022. By comparison, non-hate-related homicide was up 9%. (Assault is classified into three levels according to the seriousness of physical injury; for more information, see Definitions).
Like in previous years, the increase in non-violent hate crime in 2022 was largely the result of more incidents of general mischief (+90 incidents) (General mischief includes all mischief-related violations except for mischief in relation to property used primarily for worship or by an identifiable group, which is captured separately). Overall, general mischief accounted for 38% of hate crime incidents in 2022.
Hate crimes targeting a race or an ethnicity increase for the fourth straight year
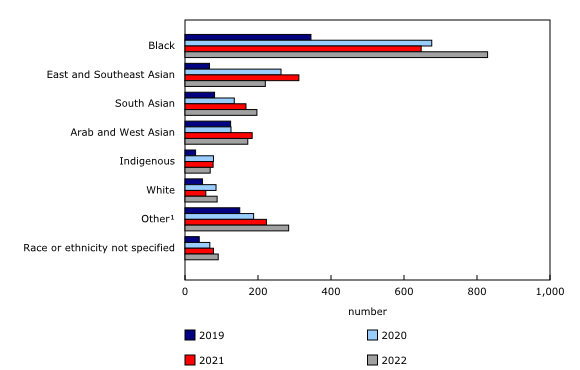
From 2021 to 2022, much of the rise in hate crimes targeting a race or an ethnicity (+12%) was the result of more reported crimes targeting the Black population (+28%; +182 incidents). Overall, incidents targeting the Black population accounted for 57% of the increase in these types of hate crimes. Hate crimes targeting the White population (+54%; +31 incidents) and the South Asian population (+18%; +30 incidents) and those targeting other or multiple races or ethnicities (+27%; +61 incidents) also increased.
Hate crimes targeting the South Asian population have increased three years in a row, rising 143% from 2019 to 2022, including an 18% rise from 2021 to 2022. Hate crimes targeting the East and Southeast Asian populations decreased 29% in 2022, following relatively large rises in 2020 and 2021. Similarly, hate crimes targeting the Arab and West Asian populations decreased 7% in 2022, following a 46% rise in 2021.
Following a large increase from 2019 to 2020 (+169%; +49 incidents), the number of police-reported hate crimes targeting Indigenous people—First Nations people, Métis and Inuit—declined 1% in 2021 and 10% in 2022 to 69 incidents in 2022. Still, the number of hate crimes targeting Indigenous people was 138% higher in 2022 than in 2019, before the pandemic (from 29 to 69 incidents).
Hate crimes targeting a religion are down in 2022, after a peak in the previous year
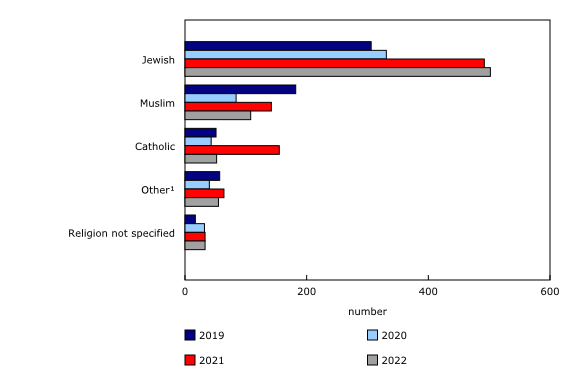
Following a peak of 886 incidents in 2021, hate crimes targeting a religion were down 15% in 2022 to 750 incidents. This decline was largely the result of fewer police-reported hate crimes targeting the Catholic (-66%; -103 incidents) and Muslim (-24%; -34 incidents) populations. Hate crimes targeting the Jewish population were up slightly in 2022, rising 2% (+10 incidents). Despite the overall year-over-year decline, the number of incidents targeting a religion in 2022 was well above what was recorded from 2018 to 2020.
Hate crimes targeting the Jewish population accounted for 67% of hate crimes targeting a religion in 2022, while those targeting the Muslim population represented 14%.
Like other types of crime, counts of police-reported hate crime can be impacted by major social events, policing initiatives or awareness campaigns. Information here reflects data reported for 2022. It does not include information from 2023, when the crisis in Israel, the West Bank and the Gaza Strip began. Information for 2023 will be released in summer 2024.
Hate crimes targeting a sexual orientation increase for the second year in a row
The 491 hate crimes targeting a sexual orientation recorded in 2022 marked a 12% rise from the previous peak recorded in 2021 (438). Nearly three-quarters (74%) of these crimes specifically targeted the gay and lesbian population, while the remainder targeted the bisexual population (1%) and people of another sexual orientation that is not heterosexual, such as asexual and pansexual people (15%), or where the targeted sexual orientation was reported as unknown (9%). (See the Note to readers for information on hate crime categories related to sexual orientation and sex or gender.)
Victims of hate crime are most often men and boys, except for crimes targeting sex or gender
Among the 5,946 victims involved in police-reported violent hate crime incidents from 2018 to 2022, 63% were men and boys and 37% were women and girls. More specifically, the proportion of victims identified as men or boys was higher among hate crimes targeting sexual orientation (73%), race or ethnicity (63%) and religion (56%), compared with hate crimes targeting sex or gender, where 73% of victims were women or girls.
The median age of victims of violent hate crime (31.5 years) was very similar to that for victims of violent crime in general (31 years). More specifically, victims of violent hate crimes targeting religion (median age of 35 years) and race or ethnicity (32 years) tended to be older compared with victims of violent hate crimes targeting sexual orientation (27 years) and sex or gender (29 years).
From 2019 to 2022—the period over which hate crime incidents increased 83% overall—the number of children and youth victims (aged 0 to 17 years) of hate crime increased 198%, from 99 to 295 victims. By comparison, the number of young adult victims (18 to 24 years) increased 102% and that of adult victims (25 years and older) increased 91%. The number of young girl victims (aged 0 to 17 years) increased 232%, while that of young boy victims increased 172%.
From 2018 to 2022, victims of violent hate crimes typically sustained no physical injuries (75%) or they sustained minor physical injuries that did not require professional medical treatment (22%). That said, 3% of victims sustained major injuries requiring professional treatment or were killed. Men and boys were more likely to sustain an injury regardless of the motivation for the hate crime compared with women and girls.
From 2018 to 2022 still, the distribution of the types of relationships between the victim and the accused was similar among victims who are men and boys and among victims who are women and girls. Unlike violent crime in general, a large proportion of violent hate crimes were committed by strangers. Victims of hate crimes targeting sexual orientation (49%) and sex or gender (41%) were more likely to know the accused compared with victims of hate crimes targeting religion (36%) and race or ethnicity (34%).
People accused of hate crime are most often men and boys
Like crime in general, people accused of hate crime tended to be young men and boys. From 2018 to 2022, 86% of the accused were men and boys. Over the same period, the median age for people accused of hate crime was 33 years.
Among hate crime incidents from 2018 to 2022 where an accused was identified, 9% involved more than one accused person, down from 13% of incidents over the previous five years, from 2013 to 2017.
Less than one-third of hate crimes were cleared (solved)
In 2022, less than one-third (29%) of hate crimes were cleared (meaning solved) compared with 34% of all criminal incidents (excluding traffic offences) reported to police that year.
Specifically, of the hate crimes that were cleared, 73% resulted in charges laid against one or more individuals, and 27% were cleared otherwise, meaning an accused was identified but a charge was not laid. The clearance rate for non-violent hate crimes (12%) was far lower than that for violent hate crimes (48%).
More specifically, in 2022, for all mischief motivated by hate, the most common type of non-violent hate crime, 9% were cleared compared with 24% of mischief that was not motivated by hate. Of these cleared criminal incidents, 58% resulted in the laying of charges for hate-motivated mischief, a larger proportion than the 23% of non-hate-motivated mischief.
Similarly, in 2022, for common assault—historically one of the most frequent types of violent hate crime—clearance rates were lower for assault motivated by hate (54%) compared with assault that was not motivated by hate (60%). Moreover, of those cleared criminal incidents, 80% of assaults motivated by hate were cleared by charge, compared with 68% of assaults not motivated by hate.
In 2022, three-quarters (75%) of unsolved police-reported hate crimes were due to insufficient evidence to proceed. Again, some non-violent crimes, particularly mischief, can have low clearance rates, as it can be difficult to identify a perpetrator.
Most cyber hate crimes involve harassing and threatening behaviours
Over the last five years, the number of police-reported hate crime incidents that were recorded by police as cybercrimes more than doubled, increasing 138% from 92 incidents in 2018 to 219 incidents in 2022 (there was a slight decrease from 223 incidents in 2021). Over that same period, non-cyber hate crimes increased 95%. By comparison, from 2018 to 2022, cybercrimes not identified as hate-motivated increased 118%, while non-cybercrimes that also were not identified as hate-motivated increased 4%.
From 2018 to 2022, over 8 in 10 cyber hate crimes (82%) were classified as violent (against a person rather than property). Harassing and threatening behaviours (such as uttering threats, criminal harassment and indecent or harassing communications) accounted for almost all (97%) of these violent incidents. Among non-violent cyber hate crimes, public incitement of hatred accounted for just over half (52%) of incidents.
Women or girls accounted for a larger proportion of victims of violent cyber hate crimes (47%) than victims of non-cyber hate crimes (37%) from 2018 to 2022. Additionally, people who were accused of a cyber hate crime (median age of 27 years) tended to be younger than those accused of a non-cyber hate crime (median age of 33 years).
Did you know we have a mobile app?
Get timely access to data right at your fingertips by downloading the StatsCAN app, available for free on the App Store and on Google Play.
Note to readers
Police-reported hate crime data are drawn from the Uniform Crime Reporting (UCR) Survey, a census of all criminal incidents known to police services in Canada. For more information on the UCR Survey, key terminology and definitions, see "Police-reported crime statistics in Canada, 2021."
Hate crimes target the integral or visible parts of a person's identity, and a single incident can affect the wider community. A hate crime may be carried out against a person or property and may be motivated in whole or in part by race, colour, national or ethnic origin, religion, sexual orientation, gender identity or expression, language, sex, age, mental or physical disability, or any other similar factor. Additionally, in reference to 2021, there were four specific offences listed as hate propaganda or hate crimes in the Criminal Code of Canada: advocating genocide, public incitement of hatred, wilful promotion of hatred and mischief motivated by hate in relation to property used by an identifiable group. In 2022, an additional offence of wilful promotion of antisemitism was introduced in the Criminal Code.
Police data on hate crimes reflect only the incidents that come to the attention of police and are classified as hate crimes. Police determine whether a crime was motivated by hatred. They indicate the type of motivation based on information gathered during the investigation and common national guidelines for record classification. Hate crime counts include both confirmed and suspected hate crime incidents. Like other types of crime, counts of police-reported hate crime can be impacted by major social events, policing initiatives or awareness campaigns. Additionally, reporting may also be influenced by language barriers, issues of trust or confidence in the police, or fear of further victimization or stigma. For example, see Text box 1 and Text box 5 in "Police-reported hate crime in Canada, 2020." In this release, police data on hate crimes reflect the primary hate crime motivation in a criminal incident, as determined through police investigation. To better understand the complex nature of hate crimes and allow for increased analysis of intersectionality, existing hate crime motivation categories have been expanded and a secondary motivation category has been added to the UCR Survey. These changes were undertaken following extensive consultation with hate crime subject-matter experts and were made available for reporting purposes in October 2021. It can take a period of time for these data to be collected and disseminated, in part due to privacy and confidentiality concerns.
In this release, data on hate crimes targeting race or ethnicity are measured with the hate crime detailed motivation variable in the UCR Survey. The reporting categories are informed by the Employment Equity Act and may be grouped to simplify data collection and reporting and to ensure confidentiality when disseminating results. Therefore, the groupings in the race or ethnicity category, as it pertains to police-reported hate crimes, may differ from the more general definition of "visible minority" groups, below.
"Visible minority" refers to whether a person belongs to one of the visible minority groups defined by the Employment Equity Act. The Employment Equity Act defines visible minorities as "persons, other than Aboriginal peoples, who are non-Caucasian in race or non-white in colour." The visible minority population consists mainly of the following groups: South Asian, Chinese, Black, Filipino, Latin American, Arab, Southeast Asian, West Asian, Korean and Japanese.
In this release, the term "Indigenous" is used to refer to individuals identifying themselves, or who have been identified as, "First Nations people, Métis or Inuit." In the context of police-reported hate crime data, it is not currently possible to further disaggregate the category for Indigenous peoples.
In this release, data on police-reported hate crimes targeting sexual orientation are collected based on the following detailed motivation categories: bisexual, heterosexual, gay and lesbian, the LGBTQ2+ community, asexual, pansexual and another sexual orientation that is not heterosexual. Prior to October 2021, hate crimes targeting sex or gender were collected based on detailed motivation categories for: male, female, and other sex or gender (including transgender, agender, intersex). With the expansion of UCR hate crime motivation categories as of October 2021, the gender category includes: man or woman, transgender man or woman, transgender target not specified, and non-binary. It is possible that these categories could be disaggregated with future releases.
The option for police to code victims as "non-binary" in the UCR Survey was implemented in 2018. In the context of the UCR Survey, "non-binary" refers to a person who publicly expresses as neither exclusively man nor exclusively woman. Given that small counts of victims identified as gender diverse may exist, the UCR Survey data available to the public have been recoded with these victims distributed in the "men and boys" or "women and girls" categories based on the regional distribution of victims' gender. This recoding ensures the protection of the confidentiality and privacy of victims.
A criminal incident may comprise multiple violations of the law. For the analysis of cyber-related violations, one distinct violation within the incident was identified as the "cybercrime violation." The cybercrime violation represents the specific criminal violation within an incident in which a computer or the Internet was the target of the crime or the instrument used to commit the crime. For most incidents, the cybercrime violation and the most serious violation were the same.
Products
An interactive data visualization dashboard, Police-reported Information Hub: Hate crime in Canada, is now available through the Police-reported Information Hub as part of the publication Statistics Canada – Data Visualization Products (71-607-X).
The infographic "Infographic: Police-reported hate crime in Canada, 2022," which is part of the series Statistics Canada — Infographics (11-627-M), is now available.
Contact information
For more information, or to enquire about the concepts, methods or data quality of this release, contact us (toll-free 1-800-263-1136; 514-283-8300; infostats@statcan.gc.ca) or Media Relations (statcan.mediahotline-ligneinfomedias.statcan@statcan.gc.ca).
- Date modified:


