
Police-reported hate crime in Canada, 2020
by Jing Hui Wang and Greg Moreau, Canadian Centre for Justice and Community Safety Statistics
Highlights
- In 2020, Canadian police reported 2,669 criminal incidents that were motivated by hate. This was the largest number recorded since comparable data became available in 2009. The first year of the pandemic saw the number of police-reported hate crimes increase by 37%, or 718 more incidents, compared with the previous year.
- Between 2019 and 2020, the number of police-reported crimes motivated by hatred of a race or ethnicity increased 80%, from 884 to 1,594. Much of this increase was a result of more police-reported hate crimes targeting the Black population (+318 incidents), East or Southeast Asian population (+202 incidents), the Indigenous population (+44 incidents) and the South Asian population (+38 incidents).
- Police reported fewer hate crimes targeting religion for the third consecutive year, after peaking in 2017. Police-reported hate crimes targeting religion declined 16% from 613 incidents in 2019 to 515 incidents in 2020. This decrease was primarily due to fewer hate crimes targeting the Muslim population, which declined from 182 to 82 incidents in 2020 (-55%). Hate crimes against the Jewish population rose slightly in 2020, from 306 to 321 incidents (+5%).
- Hate crimes targeting the Black and Jewish populations remained the most common types of hate crimes reported by police, representing 26% and 13% of all hate crimes, respectively. These were followed by hate crimes targeting the East or Southeast Asian population (11%) and those targeting a sexual orientation (10%).
- In 2020, the largest increases in the number of hate crimes were reported in Ontario (+316 incidents), British Columbia (+198 incidents), Quebec (+86 incidents), and Alberta (+84 incidents). The majority of the provinces and two territories reported increases, with the exceptions of New Brunswick (-11 incidents), Northwest Territories (-2 incidents), Prince Edward Island (-1 incident) and Manitoba (no change). When accounting for population size among the provinces, rates of hate crimes per 100,000 population increased the most in Nova Scotia (+70%), British Columbia (+60%), Saskatchewan (+60%), Alberta (+39%) and Ontario (+35%).
- Among census metropolitan areas (CMAs), police reported more hate crime incidents in 22 of 35 CMAs. The largest volume increases were generally reported in the more populous CMAs (Vancouver, Toronto, Montréal, Ottawa and Calgary). When accounting for population size among CMAs with at least 10 police-reported hate crimes in 2019 and 2020, rates of hate crimes increased the most in Kitchener-Cambridge-Waterloo (+253%), Peterborough (+126%), Victoria (+97%), Guelph (+80%) and Calgary (+75%). In contrast, police reported decreases in Hamilton (-36%), Gatineau (-33%), Winnipeg (-32%) and Windsor (-8%). The relatively small number of police-reported hate crimes in many CMAs, along with smaller populations, can translate to more unstable changes in rates.
- Based on the reported characteristics of hate crimes, both non-violent hate crimes (+41%) and violent hate crimes (+32%) increased in 2020. There were increases in all selected hate crime violations, except for advocating genocide (decreased from 9 incidents to 5).
- Non-violent hate crimes accounted for the majority of incidents (57%) in 2020, with the increase in non-violent hate crime largely due to more incidents involving general mischief (+251 incidents) and mischief in relation to property used primarily for worship or by an identifiable group (+51 incidents).
- The number of violent hate crimes rose from 865 in 2019 to 1,143 in 2020. This was partially the result of increases in common assault (+66 incidents), assault with a weapon or causing bodily harm and aggravated assault (+62 incidents), criminal harassment (+47 incidents), and uttering threats (+31 incidents).
- Analysis of all police-reported hate crimes between 2011 and 2020 shows that victims of violent hate crimes committed on the basis of their perceived Indigenous identity or sexual orientation tended to be the youngest among hate crime victims and sustain the highest proportion of injury.
Canada is a multicultural and diverse country. According to the 2016 Census, First Nations people, Métis and Inuit (Indigenous)Note comprised 4.9% of the population in 2016, up from 4.3% in 2011 (Statistics Canada 2013a). Additionally, 22.3% of Canadians belonged to groups designated as visible minorities, an increase of 3% since the 2011 National Household Survey.Note Further, consistent with changing immigration patterns and other cultural shifts, a growing proportion of people have reported religious affiliations other than Christianity. In 2011,Note 67.3% of people reported they were affiliated with a Christian religion, down from 77.1% in 2001. Another 7.2% of the Canadian population identified as Muslim, Hindu, Sikh or Buddhist, compared to 4.9% in 2001. The Jewish population has remained stable at 1% from 2001 to 2011 (Statistics Canada 2013b). Canada is also home to approximately one million people who are LGBTQ2+, accounting for 4% of the population aged 15 and older in 2018 (Statistics Canada 2021a).
According to demographic projections, the proportion of Canadians designated as members of visible minority groups and the proportion who are affiliated with non-Christian religions are expected to increase. In particular, by 2036, more than one in three working-age Canadians (15 to 64 years of age) are expected to be members of a visible minority group, and the number of Canadians affiliated with a non-Christian religion is expected to increase from 9% in 2011 to between 13% and 16% of the population in 2036 (Statistics Canada 2017a). It is also expected that over half of immigrants in Canada will be of Asian origin (Statistics Canada 2017a). South Asian and Chinese populations are expected to continue to be the largest visible minority groups in Canada, while Arab or West Asian populations are expected to grow the fastest over the next two decades (Statistics Canada 2017a). More recent projections from 2016 to 2041 suggest the Indigenous population—which is on average younger than the non-Indigenous population—will increase at a rate faster than the non-Indigenous population (Statistics Canada 2021b).
Canada’s multiculturalism and diversity are legally protected. The enhancement and protection of diversity as a fundamental characteristic of Canadian society is codified in the Canadian Multiculturalism Act. Similarly, discrimination on the basis of race, national or ethnic origin, colour, religion, age, sex, gender identity or expression, sexual orientation, marital status, family status, disability or conviction for an offence which has been pardoned are formally prohibited by the Canadian Human Rights Act. All Canadians have the right to equal opportunity and treatment, regardless of their personal characteristics.
Despite the emphasis on multiculturalism and social equality as public policy, people living in Canada are not always treated equally. Indigenous peoples and those designated as visible minorities generally report feeling less safe than the rest of the population, in some cases are much more likely to be overrepresented in the justice system, and along with sexual minorities,Note are more likely to report experiencing discrimination and victimization (Allen 2020; Burczycka 2020; Cotter 2022a; Cotter 2022b; Heidinger and Cotter 2020; Jaffray 2020; Office of the Correctional Investigator 2020; Simpson 2018; Statistics Canada 2020a). Hate crimes are a specific example of discrimination and exclusion. Hate crimes target the integral and visible parts of a person’s identity and may affect not only the individual but the wider community (Office for Democratic Institutions and Human Rights 2018; Perry 2010). As this behaviour impacts individuals, their communities and society generally, hate crimes are a focus of social concern in Canada and other countries. As a member of the Office for Democratic Institutions and Human Rights of the Organization for Security and Co-operation in Europe, Canada works with other countries to monitor and combat hate crimes (Office for Democratic Institutions and Human Rights 2021).Note
The COVID-19 pandemic, which hit Canada in March 2020, further brought to light the varying experiences and perceptions of some of Canada’s diverse population, as well as the systemic barriers they face, including varying levels of perceived safety and self-reported victimization. For instance, Chinese (30%), Korean (27%), and Southeast Asian (19%) participants in a crowdsourcing initiativeNote were the most likely to perceive an increase in the frequency of harassment or attacks based on race, ethnicity or skin colour as a result of COVID-19 (Heidinger and Cotter 2020). Furthermore, persons designated as visible minorities considered their neighbourhoods to be less safe during the pandemic (Statistics Canada 2021c). Persons designated as Indigenous and visible minorities also reported lower levels of confidence in the police and higher levels of discrimination (Cotter 2022a; Cotter 2022b).
This Juristat article presents the most recent trends in police-reported hate crime in Canada using data from the Uniform Crime Reporting Survey (see Text box 1).Note More specifically, the first section of this article examines the number and characteristics of hate crime incidents reported by police in 2020.Note Due to the relatively small annual counts and variability in the reporting of hate crimes, the second section of this article examines characteristics of hate crime incidents, victims and accused based on total hate crimes reported from 2011 to 2020.
This article was made possible with funding support from the Department of Canadian Heritage.
Start of text box 1
Text box 1
Police-reported hate crime statistics
Definition and coverage
The Uniform Crime Reporting (UCR) Survey collects police-reported crimes, including information on hate crimes. The UCR defines police-reported hate crime as follows:
“Police-reported hate crime is defined as a criminal violation against a person or property motivated by hate, based on race, national or ethnic origin, language, colour, religion, sex, age, mental or physical disability, sexual orientation or gender identity or expression, or any other similar factor.”
In addition to police-reported incidents that involve a hate crime motivation, there are four specific offences listed as hate propaganda and hate crimes in the Criminal Code of Canada: advocating genocide; incitement of hatred in a public place that is likely to lead to a breach of the peace [public incitement of hatred]; wilful promotion of hatred, all when directed against an identifiable group, and; mischief motivated by hate in relation to property primarily used for religious worship that, in late 2017, was expanded to include certain other kinds of property primarily used by an identifiable group.Note In addition, subparagraph 718.2(a)(i) of the Criminal Code allows for increased penalties when sentencing any criminal offence, such as assault or mischief, where there is evidence that the offence was motivated by bias, prejudice or hatred based on various criteria as set out in that subparagraph. These are also considered hate crimes.Note
Since 2005, Statistics Canada has collected data on hate crimes according to this standard definition from police services in Canada via the UCR. As per former Bill C-16 “An Act to amend the Canadian Human Rights Act and the Criminal Code”, the definition of hate crime was amended in 2017 to add gender identity or expression as a motivation. This updated definition of hate crime was endorsed by the Canadian Association of Chiefs of Police and is the standard used for data collection purposes as well as training by police services across Canada. Statistics Canada has worked closely with hate crime experts and the policing community Canada-wide to build standards and guidelines in identifying and reporting hate-motivated crimes.
Determination of a hate crime by police
Police-reported hate crimes are reported as criminal incidents (see “Survey description” for more details). Within the UCR Survey, depending on the level of evidence at the time of the incident, police can record the incident as either a “suspected” or “confirmed” hate-motivated crime. As more information is gathered, incidents are reviewed and verified and as a result, their status may be reclassified. The analysis in this report includes crimes that have been confirmed to be, or are strongly suspected to be, motivated by hate. Suspected hate crimes may include criminal incidents that cannot be confirmed as hate crimes, but for which there is sufficient evidence to suspect that they are motivated by hate, e.g., hate graffiti where no accused has been identified. The majority (77%) of hate crimes in 2020 were confirmed hate crimes, while the remainder were suspected hate crimes (Table 2).
It is important to note that victims of hate crimes targeting specific populations are not necessarily members of those specific populations. For example, if someone is assaulted and there is anti-Muslim language used during the assault, the hate crime will be considered anti-Muslim whether or not the victim is Muslim. The hate crime is classified by the perception of the accused, not by the characteristics of the victim.
Interpretation of police-reported numbers
Police data on hate-motivated crimes include only those incidents that come to the attention of police services and also depend on a police service’s level of expertise in identifying crimes motivated by hate. As a result, an increase in numbers may be related to more reporting by the public to the authorities (for example, as a result of outreach by police to communities or heightened sensitivity after high profile events), and/or a true increase in the extent of hate crimes being committed. Victims of crime may also be influenced by, among other things, language barriers, issues of trust or confidence in the police, or fear additional victimization or stigma by the very act of reporting (Department of Justice 2015). Police-reported data represent one dimension in the analysis of hate crime. As with other crimes, self-reported data provide another way of monitoring hate-motivated crimes. According to the 2019 General Social Survey on Canadian’s Safety (Victimization), Canadians self-reported being the victim of over 223,000 criminal incidents that they perceived as being motivated by hate (3% of the total self-reported incidents) in the 12 months preceding the survey. Approximately one in five (22%E) incidents perceived to be motivated by hate were reported to the police (see Text box 4 for information on self-reported victimization). There is not a direct correspondence between the number of police-reported hate crimes and the number of self-reported incidents of victimization perceived to be motivated by hate as the collection methodologies and reporting definitions differ between the two surveys.
Over the past two decades, police services across Canada have continued to advance their identification and reporting of hate crime incidents. Based on publicly available information, the majority of the 20 largest municipal police services in Canada had dedicated hate crime units or hate crime officers. Various organizations also exist across Canada to network with police services and communities to educate and coordinate hate crime reporting (see Text box 5 for information on initiatives to address and prevent hate crime in Canada). Changes in reporting practices can have an effect on hate crime statistics. It is therefore important to recognize that, according to police services, higher rates of police-reported hate crime in certain jurisdictions may reflect differences or changes in the recognition, reporting and investigation of these incidents by police and community members.
Due to the impact of changes in reporting practices and the variability of hate crime, particularly by motivation or in jurisdictions where numbers are small, changes over time should be interpreted with caution.
End of text box 1
Section 1: Police-reported hate crime in 2020
Hate-motivated crime rose sharply in 2020, reaching the highest number recorded since comparable data have been available
The number of police-reported hate crimes in Canada increased 37% in 2020, rising from 1,951 incidents to 2,669. This marks the largest number of police-reported hate crimes recorded since comparable data became available in 2009. A similar increase was observed between 2016 and 2017, when the number of hate crimes rose 47% (Chart 1). The largest volume increases were reported in Canada’s most populous provinces: Ontario (+316 incidents), British Columbia (+198 incidents), Quebec (+86 incidents), and Alberta (+84 incidents).
Chart 1 start
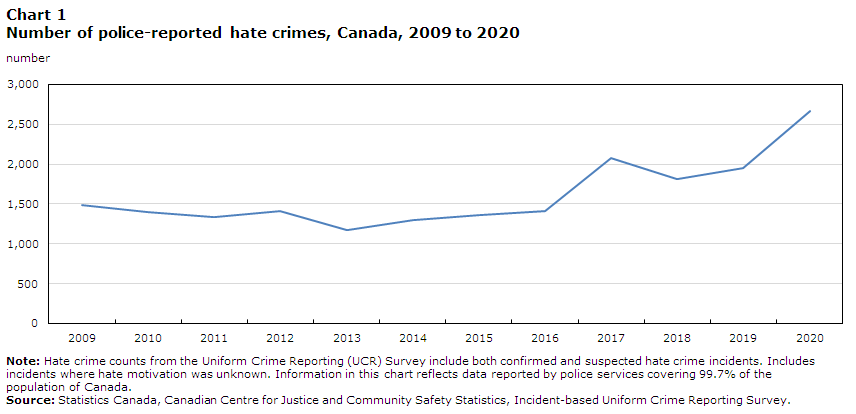
Data table for Chart 1
| Year | Number |
|---|---|
| 2009 | 1,482 |
| 2010 | 1,401 |
| 2011 | 1,332 |
| 2012 | 1,414 |
| 2013 | 1,167 |
| 2014 | 1,295 |
| 2015 | 1,362 |
| 2016 | 1,409 |
| 2017 | 2,073 |
| 2018 | 1,817 |
| 2019 | 1,951 |
| 2020 | 2,669 |
|
Note: Hate crime counts from the Uniform Crime Reporting (UCR) Survey include both confirmed and suspected hate crime incidents. Includes incidents where hate motivation was unknown. Information in this chart reflects data reported by police services covering 99.7% of the population of Canada. Source: Statistics Canada, Canadian Centre for Justice and Community Safety Statistics, Incident-based Uniform Crime Reporting Survey. |
|
Chart 1 end
Overall, hate crimes accounted for slightly more than 0.1% of the over 2 million police-reported crimes in 2020 (excluding traffic offences). Unlike police-reported hate crimes, the overall police-reported crime rate (excluding traffic offences) decreased 10% from 2019 to 2020. The annual rates of all violent crime, property crime and other Criminal Code offences decreased for the first time after five years of increases (Moreau 2021a). Monthly data on criminal incidents reported by police indicate different progressions for hate crimes versus other police-reported crimes throughout 2020 (Chart 2). Hate-motivated crime and non-hate motivated crime decreased in March and April 2020 compared with the same period in 2019. This was the first month and a half of the pandemic period. From May to December, however, non-hate motivated crime remained lower month-to-month compared to 2019 (-12%), while hate-motivated crime increased substantially (+52%) over the same period.
Chart 2 start

Data table for Chart 2
| Month and Year | Hate-motivated crime | Other crimeData table for Chart 2 Note 1 |
|---|---|---|
| percent change in number of incidents from previous year | ||
| January 2020 | 34 | 5 |
| February 2020 | 27 | 17 |
| March 2020 | -11 | -9 |
| April 2020 | -31 | -17 |
| May 2020 | 16 | -21 |
| June 2020 | 81 | -14 |
| July 2020 | 60 | -10 |
| August 2020 | 59 | -10 |
| September 2020 | 30 | -10 |
| October 2020 | 59 | -9 |
| November 2020 | 57 | -11 |
| December 2020 | 71 | -12 |
Source: Statistics Canada, Canadian Centre for Justice and Community Safety Statistics, Incident-based Uniform Crime Reporting Survey. |
||
Chart 2 end
Since the availability of comparable data in 2009, the number of police-reported hate crimes has ranged from a low of 1,167 incidents in 2013 to a high of 2,669 in 2020 (Chart 1). Although changes over time could reflect real increases in the number of hate crimes occurring, differences or changes in the recognition, reporting by victims and investigation of these incidents by police and community members could also have had an impact on these trends (see Text box 1).
In 2020, hate crimes motivated by hatred of a race or ethnicity represented 62% of all hate crimes, followed by those targeting religion (20%) (Table 1). Compared to previous years, the proportion of hate crimes targeting race or ethnicity increased substantially, while those targeting religion decreased. Crimes motivated by hatred of a sexual orientation accounted for 10% of hate crimes, while those targeting other factors such as language, disability, age, and sex or gender comprised 7%. These proportions are similar to those from recent years.
The number of police-reported hate crimes targeting race or ethnicity almost doubled (+80%) compared with the previous year, accounting for the vast majority of the national increase. Much of the rise in hate crimes targeting race or ethnicity was the result of more crimes targeting the Black population (+318 incidents, +92%), the East or Southeast Asian populationNote (+202 incidents, +301%), the Indigenous population (+44 incidents, +152%) and the South Asian populationNote (+38, incidents, +47%). There were fewer police-reported hate crimes targeting religion (-98 incidents, -16%), the result of fewer incidents targeting the Muslim population (-100 incidents, -55%),Note while incidents targeting the Jewish population rose slightly (+15 incidents, +5%). Overall, hate crimes targeting the Black population accounted for 26% of hate crimes in 2020, while those targeting the Jewish and East or Southeast Asian populations accounted for 13% and 11%, respectively.
Start of text box 2
Text box 2
Collecting and reporting data on specific population groups
This report presents information on population groups categorized according to characteristics such as race, ethnicity or religion. These groupings are based on hate crime motivations outlined in the Uniform Crime Reporting (UCR) survey which are informed by the Employment Equity Act. Further consultation on these categories was conducted with police services to reflect the most common motivations already captured by police. The hate crime motivation categories captured in the UCR are generally a combination of these groups so as to simplify the collection and reporting of hate crimes and to ensure the protection of confidentiality when disseminating results.
With the above in mind, the experiences of many populations are grouped together in this article for the purposes of analysis. It is important to note, however, experiences of a given population group are not homogenous, but rather represent varying backgrounds, circumstances and experiences. Furthermore, in the case of police-reported hate crimes, the motivation for a hate crime is determined through investigation by the police and is based on the perceptions of the accused, and in turn may not necessarily represent how a victim self-identifies.
In order to better understand the complex nature of hate crimes and allow for increased analysis of intersectionality, existing hate crime motivation categories have been expanded and a secondary motivation category has been added to the UCR. These changes were undertaken following extensive consultation with hate crime subject matter experts and were made available to police services for reporting purposes in October 2021.
In addition, as part of Statistics Canada’s ongoing commitment to publishing data that are disaggregated to the fullest extent possible, further updates are planned for the UCR survey. The Canadian Association of Chiefs of Police and Statistics Canada have committed to working together to enable police to report statistics on the Indigenous and racialized identity of victims and accused persons in police-reported crime statistics (Statistics Canada 2020b).
End of text box 2
Despite an increase in the number of hate crimes reported by the police, the proportion of non-violent and violent hate crimes remained similar to recent years. Nationally, more than half (57%) of all hate crime incidents reported by police were non-violent in 2020, while violent crimes accounted for 43%. From 2019 to 2020, the number of non-violent hate crimes increased from 1,086 incidents to 1,526 (+41%). This increase was primarily due to more police-reported incidents of general mischiefNote (+33%), followed by mischief in relation to property used primarily for worship or by an identifiable group (+47%), and public incitement of hatred (+23%). In 2020, police reported a 32% increase in violent hate crimes (from 865 incidents to 1,143). All selected types of violent hate crime increased, including criminal harassment (+70%), assault with a weapon or causing bodily harm and aggravated assault (+58%), common assault (+23%), and uttering threats (+11%) (Table 3).
In 2020, the vast majority (90%) of police-reported hate crimes were offences other than the four offences explicitly defined as hate crimes under the Criminal Code (see Text box 1). When examining these four offences specifically within the context of all hate crimes, 6% were for mischief in relation to property primarily used for religious worship or by an identifiable group (159 incidents), 4% were for either public incitement of hatred or wilful promotion of hatred (111 incidents), and fewer than 1% involved advocating genocide (5 incidents) (Table 3).
The most common type of hate crime was mischief, with 1,180 incidents (accounting for 44% of all incidents) (Chart 3). Given its volume relative to other violations, mischief tends to be an important driver for changes in hate crime, as fluctuations in mischief can have a large impact across motivations. The most common police-reported violent hate crime in 2020 was common assault with 358 incidents (13%), followed by uttering threats with 325 incidents (12%) (Chart 3). These crimes—mischief, common assault and uttering threats—are also among the most common criminal violations in general, though at comparatively lower proportions.
Chart 3 start
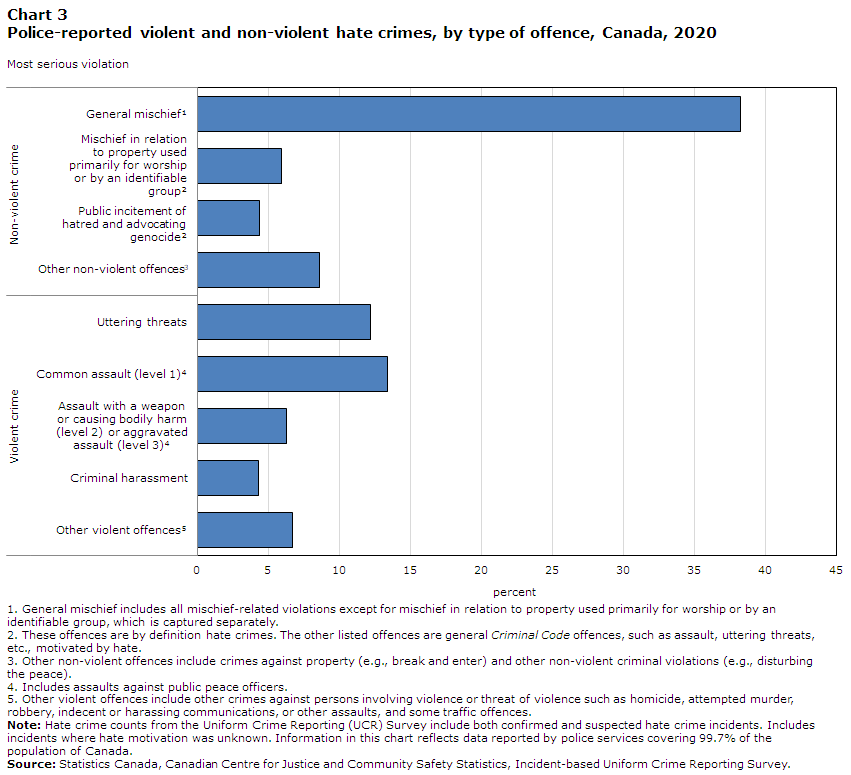
Data table for Chart 3
| Percent | |
|---|---|
| Non-violent crime | |
| General mischiefData table for Chart 3 Note 1 | 38 |
| Mischief in relation to property used primarily for worship or by an identifiable groupData table for Chart 3 Note 2 | 6 |
| Public incitement of hatred and advocating genocideData table for Chart 3 Note 2 | 4 |
| Other non-violent offencesData table for Chart 3 Note 3 | 9 |
| Violent crime | |
| Uttering threats | 12 |
| Common assault (level 1)Data table for Chart 3 Note 4 | 13 |
| Assault with a weapon or causing bodily harm (level 2) or aggravated assault (level 3)Data table for Chart 3 Note 4 | 6 |
| Criminal harassment | 4 |
| Other violent offencesData table for Chart 3 Note 5 | 7 |
Source: Statistics Canada, Canadian Centre for Justice and Community Safety Statistics, Incident-based Uniform Crime Reporting Survey. |
|
Chart 3 end
Most provinces and two territories reported increases in hate crime
In 2020, the largest increases in hate crimes were reported in Ontario (+316 incidents), British Columbia (+198 incidents), Quebec (+86 incidents), and Alberta (+84 incidents). Overall, the majority of the provinces and Yukon (+2 incidents) and Nunavut (+1 incidents) reported increases. Those areas that did not report increases were New Brunswick (-11 incidents), Northwest Territories (-2 incidents), Prince Edward Island (-1 incident) and Manitoba (no change) (Table 4).
Among the provinces, Canada’s four most populous have typically had the highest volumes and rates of hate crime in the country (Chart 4). The increases in British Columbia, Ontario, Alberta and Quebec were predominantly due to more hate crimes targeting race or ethnicity. Specifically, all four provinces reported relatively large increases in hate crimes targeting the Black population (Ontario +175 incidents, British Columbia +47 incidents, Alberta +46 incidents and Quebec +37 incidents) and the East or Southeast Asian population (British Columbia +106 incidents, Ontario +55 incidents, Quebec +20 incidents and Alberta +18 incidents). Ontario also reported the largest increases in hate crimes targeting the Indigenous population (+24 incidents) and the Arab or West Asian populationNote (+18 incidents).
Chart 4 start

Data table for Chart 4
| 2017 | 2018 | 2019 | 2020 | |
|---|---|---|---|---|
| Province | rate per 100,000 population | |||
| CanadaData table for Chart 4 Note 1 | 5.7 | 4.9 | 5.2 | 7.0 |
| N.L. | 0.4 | 0.4 | 1.1 | 1.5 |
| P.E.I. | 0.7 | 1.3 | 5.1 | 4.4 |
| N.S. | 2.2 | 3.3 | 3.3 | 5.6 |
| N.B. | 2.9 | 1.9 | 3.9 | 2.4 |
| Que. | 5.9 | 4.5 | 4.7 | 5.7 |
| Ont. | 7.3 | 5.7 | 5.9 | 7.9 |
| Man. | 2.7 | 3.1 | 4.1 | 4.0 |
| Sask. | 1.8 | 2.6 | 2.8 | 4.6 |
| Alta. | 4.5 | 5.7 | 4.7 | 6.6 |
| B.C. | 5.2 | 5.2 | 6.3 | 10.1 |
Source: Statistics Canada, Canadian Centre for Justice and Community Safety Statistics, Incident-based Uniform Crime Reporting Survey. |
||||
Chart 4 end
When accounting for population size, Nova Scotia (+70% rate per 100,000) reported the largest change in rate in 2020, primarily due to more hate crimes targeting race or ethnicity. Rates of hate crime in British Columbia (+60%), Saskatchewan (+60%), Alberta (+39%) and Ontario (+35%) all increased at or more than the national increase (+35%). The relatively small population counts in the Territories typically translate to higher and more unstable rates, making year-over-year comparisons less meaningful.
Census data show that diversity has increased in all provinces from 2011 to 2016 and that the largest proportion of individuals designated as visible minorities live in the three provinces of British Columbia, Ontario, and Alberta (Table 5).
Start of text box 3
Text box 3
Canada’s most diverse populations living in the three largest census
metropolitan areas
According to the 2016 Census, 22% of the Canadian population were a member of a visible minority group, compared to 19% in the 2011 National Household Survey. Canada’s visible minority population is most concentrated in the country’s three largest census metropolitan areas (CMAs)—Toronto, Montréal and Vancouver, home to 36% of the total Canadian population. Of the total visible minority population in Canada, 66% lived in one of these three CMAs in 2016. In that year, about 5 in 10 people residing in Toronto (51%) and Vancouver (49%) were visible minorities, whereas the same was true for 2 in 10 people residing in Montréal (23%). Population projections indicate that by 2036, more than 6 in 10 individuals among the working-age population living in the CMAs of Toronto and Vancouver could be members of a visible minority. In Montréal, the proportion is expected to increase to more than 4 in 10 (Statistics Canada 2017a).
Canada’s three largest CMAs are also home to a great majority of Canadians who are members of religious groups that were most frequently targeted in religiously motivated hate crimes. For instance, in 2011, 1% of the Canadian population identified as Jewish, with most (82%) living in Toronto, Montréal or Vancouver. The majority (68%) of those identifying as Muslim, who made up 3% of the Canadian population, resided within Toronto, Montréal or Vancouver. Buddhists, Hindus and Sikhs represented 4% of the Canadian population, and the majority resided in these three largest CMAs (74%) (Statistics Canada 2013b). As with visible minority groups, these proportions are expected to increase over the next two decades (Statistics Canada 2017a; Statistics Canada 2010).
In 2016, same-sex couples (both married and common-law) accounted for 1% of all couples in Canada, but had risen 13% from 2011 (Statistics Canada 2017b). Close to half (45%) of these couples resided in Toronto, Montréal, or Vancouver, compared to just over one-third (34%) of opposite-sex couples.
End of text box 3
Areas inside and outside of CMAs posted similar increases in hate crimes
While the vast majority (84%) of police-reported hate crimes in Canada occurred in a census metropolitan area (CMA) in 2020 (Table 6),Note CMAs and non-CMAs (smaller cities, small towns and rural areas) recorded similar increases of 37% (+605 incidents) and 36% (+113 incidents), respectively, compared with the previous year. For non-CMA areas, increases were reported in all provinces and territories except for New Brunswick (-9 incidents), the Northwest Territories (-2 incidents) and Prince Edward Island (-1 incident). British Columbia (+40 incidents) and Ontario (+20 incidents) had the largest provincial increases among non-CMA areas.
Among the CMAs, the largest volume increases were generally reported in the more populous CMAs (Vancouver, Toronto, Montréal, Ottawa and Calgary). When accounting for population size among CMAs with at least 10 police-reported hate crimes in 2019 and 2020, rates of hate crimes per 100,000 population increased the most in Kitchener-Cambridge-Waterloo (+253%), Peterborough (+126%), Victoria (+97%), Guelph (+80%) and Calgary (+75%). In contrast, police reported decreases in Hamilton (-36%), Gatineau (-33%), Winnipeg (-32%) and Windsor (-8%). The relatively small number of police-reported hate crimes in many CMAs, along with smaller populations, can translate to more unstable changes in rates, making year-over-year comparisons less meaningful.
Similar to last year, the increase in incidents outside CMAs was due to increases in both violent and non-violent hate crimes, including general mischief (+44 incidents), public incitement of hatred (+18 incidents) and common assault (+15 incidents). Additionally, there were more incidents targeting race or ethnicity (+111 incidents), but fewer incidents targeting religion (-29 incidents). In general, hate crimes targeting the Black and East or Southeast Asian populations were the primary contributors to increases across CMAs, and hate crimes targeting the Muslim population were the primary contributor to decreases.
Nationally, the majority of CMAs (22 of 35 CMAs)Note reported increases in hate crimes from 2019 to 2020, and another 3 CMAs reported no change year-over-year. When controlling for the size of the population of each CMA, the CMAs with the highest rates of police-reported hate crime were Peterborough (19.4 hate crimes per 100,000 population), Ottawa (16.6), Guelph (15.1), Vancouver (13.8) and Thunder Bay (11.1) (Chart 5).Note
Chart 5 start

Data table for Chart 5
| Census metropolitan areaData table for Chart 5 Note 1 | Rate - 2020 |
|---|---|
| Canada | 7.0 |
| Peterborough | 19.4 |
| OttawaData table for Chart 5 Note 2 | 16.6 |
| Guelph | 15.1 |
| Vancouver | 13.8 |
| Thunder Bay | 11.1 |
| Kingston | 10.4 |
| HamiltonData table for Chart 5 Note 3 | 10.0 |
| TorontoData table for Chart 5 Note 4 | 9.5 |
| Calgary | 9.2 |
| Kitchener–Cambridge–Waterloo | 8.9 |
| Québec | 8.5 |
| Victoria | 8.3 |
| London | 8.1 |
| Montréal | 7.4 |
| LethbridgeData table for Chart 5 Note 5 | 6.4 |
| GatineauData table for Chart 5 Note 6 | 6.1 |
| Edmonton | 5.4 |
| Saskatoon | 5.0 |
| Brantford | 4.8 |
| Barrie | 4.6 |
| Moncton | 4.2 |
| Windsor | 4.0 |
| Abbotsford–Mission | 3.9 |
| Trois-Rivières | 3.7 |
| Halifax | 3.6 |
| Winnipeg | 3.4 |
| Sherbrooke | 2.4 |
| Saint John | 2.3 |
| Kelowna | 2.3 |
| St. Catharines–Niagara | 2.1 |
| Regina | 1.9 |
| Greater Sudbury | 1.8 |
| BellevilleData table for Chart 5 Note 5 | 0.9 |
| Saguenay | 0.6 |
| St. John's | 0.0 |
Source: Statistics Canada, Canadian Centre for Justice and Community Safety Statistics, Incident-based Uniform Crime Reporting Survey. |
|
Chart 5 end
Less rural hate crime than urban hate crime
Rural areas were home to approximately 16% of the Canadian population but accounted for 7% of police-reported hate crimes (188 incidents) in 2020.Note
The relatively small number of hate crimes occurring in rural areas makes more detailed analysis difficult on an annual basis. Looking at data grouped from 2017 to 2020, hate crimes targeting the Black population (86 incidents), the lesbian and gay population (79 incidents) and the Indigenous population (51 incidents) were the most frequently reported in rural areas. Among hate crime motivation types where there were at least 100 reported incidents in total, crimes targeting the Indigenous population (30%) had the highest proportion occurring in rural areas, followed by crimes targeting the Catholic population (18%), the white or Caucasian population (13%) and the lesbian and gay population (10%). Compared to urban hate crimes, hate crimes occurring in rural areas were less likely to be violent (43% violent versus 37% violent, respectively).
Among the provinces and territories, from 2017 to 2020, the majority of rural hate crimes occurred outside of Ontario, Quebec and British Columbia, which accounted for 44% of rural hate crimes, but 84% of urban hate crimes.
It is important to note that the number of police-reported hate crimes among individual CMAs or other selected areas can be relatively small and are sensitive to fluctuations. Therefore, these data are highly variable according to policing practices, shifting attitudes and reporting practices among the public. For example, some local police services, especially those serving large cities, have dedicated hate crime units or allow for online reporting. Additionally, many cities have local anti-racism or anti-hate committees that work with police to address issues of hate in their communities (see Text box 5). These practices may influence the likelihood that a hate crime is reported to police.
Start of text box 4
Text box 4
Self-reported victimization data on hate-motivated incidents
Crime, and the factors related to it, are complex and can be measured in a variety of ways. Police-reported statistics are a critical source of information, however their main limitation is that they are unable to provide information on crime that does not come to the attention of police or other authorities. Crimes that are not reported or recorded, often referred to as the “dark figure of crime”, account for the majority of criminal incidents. For some types of crime, such as hate crime, intimate partner violence or sexual assault, only a very small proportion are ever brought to the attention of police or other officials. Relying solely on official statistics for an understanding of these crime types could therefore result in a skewed understanding of the nature of crime and victimization in Canada, as those that come to the attention of police are not necessarily representative of all incidents of crime (Cotter 2021).
Information on self-reported victimization is collected every five years by the General Social Survey (GSS) on Canadian’s Safety (Victimization). This survey asks a sample of Canadians, aged 15 years and older, if they had been a victim in the previous 12 months of any of the following offences: sexual assault, robbery, physical assault, break and enter, theft of motor vehicles or parts, theft of household property, theft of personal property, and vandalism. If respondents indicate that they had been victimized, they are subsequently asked if they believed that the incident had been motivated by hate and, if so, to state the motivation(s). For more detailed information on the GSS and its collection, refer to the GSS survey information page.Note
It is important to note that data collected by the GSS differ from police-reported data. Information from the GSS is based upon the perceptions of individuals regarding whether or not a crime occurred and what the motivation for the crime may have been. Data on self-reported victimization provide information on incidents that may or may not have come to the attention of police. In contrast, information from police is based on incidents that have been substantiated through investigation. The police use strict legal criteria to determine whether or not a crime is motivated by hate and to indicate the type of motivation. They also look at information gathered during the investigation and adhere to national guidelines in order to define and classify the incident as a hate crime. Police-reported data also depend on whether victims are willing to report hate crimes to an official body.
Overall, about one-fifth (22%E) of incidents perceived to be motivated by hate were reported to the police. Due to a smaller number of respondents, data were not available for the 2019 GSS on reasons for not reporting, however according to data from 2014, of the victims who did not report the hate crime targeting themselves, 64% said they did not report it because they thought the police would not have considered the incident important enough. Similarly, 62% felt that the crime was minor and not worth taking the time to report to the police. Another reason, cited by 58% of victims, was the belief that the accused would not be convicted or adequately punished.Note For more detailed analysis of the 2014 GSS data as it relates to hate crimes, refer to Text box 2 in the “Police-reported hate crime in Canada, 2017” report (Armstrong 2019). For more detailed information on self-reported criminal victimization in general, see Cotter 2021.
According to recent data from the 2020 General Social Survey on Social Identity, Black and Indigenous people and people belonging to other ethno-cultural groups were less likely than non-Indigenous, non-visible minority people to have confidence in the police (Cotter 2022a). A lack of confidence or trust in the police or other social institutions could make reporting crime and victimization less likely for certain populations.
End of text box 4
Police-reported hate crimes motivated by hatred of a race or ethnicity nearly doubled
Police reported hate crimes targeting race or ethnicity nearly doubled (+80%) from the previous year, increasing from 884 incidents in 2019 to 1,594 incidents in 2020 (Table 1; Chart 6). Hate crimes targeting race or ethnicity accounted for the vast majority of the national increase in hate crimes overall. Ontario (+321 incidents), British Columbia (+196 incidents) and Alberta (+105 incidents) reported the largest increases among the provinces and territories.
Chart 6 start

Data table for Chart 6
| 2017 | 2018 | 2019 | 2020 | |
|---|---|---|---|---|
| Type of motivation | number | |||
| Race or ethnicity | 878 | 793 | 884 | 1,594 |
| Religion | 842 | 657 | 613 | 515 |
| Sexual orientation | 204 | 186 | 265 | 259 |
| Sex or gender | 32 | 54 | 56 | 46 |
| Other motivationData table for Chart 6 Note 1 | 85 | 105 | 94 | 143 |
Source: Statistics Canada, Canadian Centre for Justice and Community Safety Statistics, Incident-based Uniform Crime Reporting Survey. |
||||
Chart 6 end
The rise in police-reported hate crimes targeting race or ethnicity was predominantly the result of crimes targeting the Black population (+318 incidents or +92%), the East or Southeast Asian population (+202 incidents or +301%), the Indigenous population (+44 incidents or +152%), and the South Asian population (+38 incidents or +47%) (Table 1; Chart 7). In 2020, police reported the highest number of hate crimes targeting each of these populations since comparable data have been available. Overall, 62% of all police-reported hate crime was motivated by hatred of a race or ethnicity. This proportion of the total was the highest recorded since comparable data have been available, and it was 30% to 45% higher than the previous six years, where hate crime motivated by hatred of a race or ethnicity accounted for between 43% and 48% of hate crimes (Chart 8).
Chart 7 start

Data table for Chart 7
| Race or ethnicity | 2017 | 2018 | 2019 | 2020 |
|---|---|---|---|---|
| number | ||||
| Black | 321 | 295 | 345 | 663 |
| East and Southeast Asian | 61 | 60 | 67 | 269 |
| South Asian | 67 | 84 | 81 | 119 |
| Arab / West Asian | 142 | 93 | 125 | 123 |
| Indigenous | 31 | 39 | 29 | 73 |
| White | 46 | 42 | 48 | 81 |
| OtherData table for chart 7 Note 1 | 169 | 163 | 150 | 193 |
| Race or ethnicity not specified | 41 | 17 | 39 | 73 |
Source: Statistics Canada, Canadian Centre for Justice and Community Safety Statistics, Incident-based Uniform Crime Reporting Survey. |
||||
Chart 7 end
Chart 8 start

Data table for Chart 8
| Year | Total | Race or ethnicity | Religion | Sexual orientation | Sex or gender | Other motivationData table for chart 8 Note 1 |
|---|---|---|---|---|---|---|
| number | ||||||
| 2011 | 1,332 | 679 | 326 | 240 | 10 | 58 |
| 2012 | 1,414 | 704 | 419 | 185 | 10 | 72 |
| 2013 | 1,167 | 585 | 326 | 186 | 9 | 51 |
| 2014 | 1,295 | 611 | 429 | 155 | 22 | 55 |
| 2015 | 1,362 | 641 | 469 | 141 | 12 | 74 |
| 2016 | 1,409 | 666 | 460 | 176 | 24 | 64 |
| 2017 | 2,073 | 878 | 842 | 204 | 32 | 85 |
| 2018 | 1,817 | 793 | 657 | 186 | 54 | 105 |
| 2019 | 1,951 | 884 | 613 | 265 | 56 | 94 |
| 2020 | 2,669 | 1,594 | 515 | 259 | 46 | 143 |
Source: Statistics Canada, Canadian Centre for Justice and Community Safety Statistics, Incident-based Uniform Crime Reporting Survey. |
||||||
Chart 8 end
In 2020, police services in Canada reported 663 incidents motivated by hatred against the Black population, the highest number recorded dating back to 2009. This represented 42% of all hate crimes targeting race or ethnicity, and 26% of all hate crimes in 2020. The Black population was the most commonly targeted group overall for 2020, more than double the next highest group, the Jewish population. Historically, the Black, Jewish, gay and lesbian, and Muslim populations have tended to be the most targeted groups. In 2020, the East or Southeast Asian population was the third most targeted group. Ontario (+175 incidents), British Columbia (+47 incidents) and Alberta (+46 incidents) accounted for the largest increases in crimes against the Black population.
On both sides of the Canadian border, widespread social movements took place in 2020 in response to injustices and police misconduct, particularly with respect to police use of force targeting the Black population and other visible minority groups. While it is not possible to connect the police-reported hate crime incidents to specific events, it can be said that social movements can bring to light issues of discrimination, potentially increasing awareness and reporting, as well as potentially exacerbating crimes targeting a particular group as a result of individuals or groups reacting to the movement. For more detailed information on self-reported experiences with victimization and determinants of social identity among the Black population in Canada, see Cotter 2022a and Cotter 2022b.
Highest recorded number of police-reported hate crimes against the East or Southeast Asian and South Asian populations
In 2020, the number of police-reported hate crimes against the East or Southeast Asian population increased significantly from 67 incidents in 2019 to 269 incidents (+301%) (Table 1). As was the case with the Black population, the number of police-reported hate crimes targeting the East or Southeast Asian population in 2020 was the highest since comparable data were available. The increase in incidents motivated by hatred of the East or Southeast Asian population was largely due to more police-reported hate crimes in British Columbia (+106 incidents), Ontario (+55 incidents), Quebec (+20 incidents), and Alberta (+18 incidents).
Similarly, the number of police-reported hate crimes targeting the South Asian population increased from 81 in 2019 to 119 in 2020 (+47%). This increase was largely due to more hate crimes in Ontario (+15 incidents), British Columbia (+14 incidents), and Alberta (+8 incident). In contrast, police reported a slight decrease in incidents targeting the Arab or West Asian population, from 125 in 2019 to 123 in 2020. The relative stability in the number of hate crimes targeting the Arab or West Asian population was largely due to increases in Ontario (+18 incidents) and British Columbia (+6 incidents) combined with decreases in Quebec (-16 incidents), Manitoba (-6 incidents) and Alberta (-4 incidents).
In Canada, broader anti-Asian racism refers to historical and ongoing discrimination, negative stereotyping, and injustice experienced by peoples of Asian descent, based on others’ assumptions about their ethnicity and nationality (Canadian Heritage n.d. a; Canadian Heritage n.d. b). Throughout the COVID-19 pandemic, reports of increased anti-Asian sentiment have been widespread in Canada and elsewhere (United Nations 2020; United Nations 2021; Xu 2020). As part of Statistics Canada’s effort to provide insights into the social and economic impacts of the early stages of the pandemic, a crowdsourcing initiativeNote was conducted to measure perceptions of personal safety during the pandemic among population groups designated as visible minorities (Heidinger and Cotter 2020). The proportion of visible minority participants who perceived an increase in the frequency of harassment or attacks based on race, ethnicity or skin colour was three times larger than the proportion among the rest of the population since the start of the COVID-19 pandemic (18% compared with 6%). This difference was most pronounced among Chinese (30%), Korean (27%), and Southeast Asian (19%) participants. It should be noted that the methodology used for this study was not designed using a probabilistic sampling method, therefore we cannot make an inference about these results for the overall Canadian population. Several initiatives were developed to respond to the increase in anti-Asian discrimination and discrimination in general in Canada, see Text box 5.
Relatively few police-reported hate crimes against Indigenous peoples
Feelings of safety and public perceptions of institutions like the police and the criminal justice system can impact the willingness of particular communities to report incidents to the police. According to data from the 2020 General Social Survey (GSS) on Social Identity, one in five (22%) Indigenous people have little or no confidence in police, double the proportion of non-Indigenous, non-visible minority people (11%) (Cotter 2022a). Furthermore, according to the 2014 GSS on Victimization, Indigenous victims of non-spousal violence were more likely not to report the crime to police than their non-Indigenous counterparts (Boyce 2016).
Poor relations between the police and Indigenous and racialized peoples in Canada are well documented (Ben-Porat 2008; Brown and Benedict 2002; Chan and Mirchandani 2002; Council of Canadian Academies 2019; Ibrahim 2020; Jones et al. 2014; Nilson and Mantello 2019; Selkirk 2020). The relationship between Indigenous peoples and the police has been described as one of mistrust. This characterization is rooted in a history of colonization, including residential schools (the last of which closed in 1996), forced relocation and the Sixties Scoop, and is recognized for having profoundly impacted Indigenous communities and families (Bombay et al. 2014; Bombay et al. 2011; Bombay et al. 2009; The Truth and Reconciliation Commission of Canada 2015). The Truth and Reconciliation Commission, for example, has described how the involvement of police in the residential school system has impacted Indigenous peoples and their trust in police (Truth and Reconciliation Commission of Canada 2015). In addition, The Final Report of the National Inquiry into Missing and Murdered Indigenous Women and Girls presents other recent evidence of how historical events and systemic responses to missing and murdered Indigenous women and girls directly contribute to a lack of trust in police among Indigenous peoples (MMIWG 2019). Indigenous peoples often experience social and institutional marginalization, discrimination, and various forms of trauma and violence, including intergenerational trauma and gender-based violence (Armstrong and Jaffray 2021; Arriagada et al. 2020; MMIWG 2019; Statistics Canada 2020c; The Truth and Reconciliation Commission of Canada 2015). These factors play a significant role in the overrepresentation of Indigenous people in the criminal justice system and as victims of crime, and may also impact the likelihood that a crime is reported in the first place (Allen 2020; Ontario Human Rights Commission 2003; House of Commons 2018).
Bearing in mind the above systemic issues, the number of police-reported hate crimes targeting Indigenous people increased from 29 in 2019 to 73 in 2020. The majority of this increase occurred in Ontario. While Indigenous peoples are generally overrepresented as victims of crime and discrimination—for example the rate of homicide for Indigenous peoples was almost seven times higher than for non-Indigenous people in 2020—Indigenous people accounted for 5% of the Canadian population in 2020, but police-reported hate crime incidents targeting Indigenous people accounted for 3% of hate crime incidents (Armstrong and Jaffray 2021) (Table 1).
The year 2020 was marked by various social movements, including protests related to Indigenous sovereignty, rights and land claims in Canada. As is the case with other social movements, it is not possible to tie police-reported hate crime incidents directly to particular events, but media coverage and public discourse around particular issues can increase awareness and reporting, and also exacerbate or entice negative reactions from people who oppose the movement. It is also noteworthy that the data in this report cover the year 2020, and so they were reported prior to the discoveries of unmarked graves on former residential school sites in 2021. Following these discoveries, there were reports of incidents targeting the Indigenous population as well as targeting churches. Any resulting criminal incident deemed to be motivated by hate reported by police would be included in subsequent statistics.
Start of text box 5
Text box 5
Initiatives to address and prevent hate crime in Canada
In an effort to address and prevent hate crime, as well as provide reporting alternatives other than police, a number of governmental and non-governmental initiatives have been developed. These initiatives range from federal action plans, to community-based outreach by police, to creating websites for people to report hate crimes and non-criminal hate incidents online. These and other practices may influence the likelihood that a hate crime is reported to police.
In an effort to combat racism and discrimination, the Government of Canada funded Building a Foundation for Change: Canada’s Anti-Racism Strategy 2019-2022 (Canadian Heritage 2019). Part of the Anti-Racism Strategy involves the creation of an Anti-Racism Secretariat to coordinate federal action and engage with relevant communities, experts and stakeholders. Additionally, in response to the increase in false, misleading and inflammatory disinformation published online and through social media, the Government of Canada has made it a priority to help people to critically assess online information. The Digital Citizen Initiative is a multi-component strategy that aims to support democracy and social cohesion in Canada by building resilience against online disinformation (Digital Citizen Initiative 2022).
Many of the police services that serve large cities, such as Ottawa, Edmonton, Toronto and Vancouver have specialized hate crime units. These units are composed of officers and/or civilian professionals that have specific training in crimes motivated by hate. Specialized hate crime units help to provide support to front line officers, conduct hate crime-specific investigative work, educate other police officers and the community, and provide outreach to affected communities. Alongside hate crime units, some police services allow some hate crimes to be reported online, including offering reporting in various languages to increase accessibility.
Many provinces and cities have local anti-racism or anti-hate committees that work with police to address issues of hate in their communities. These include, for example, the Resilience B.C.: Anti-hate crime network, the Alberta Hate Crimes Committee, the Thunder Bay Anti-Racism and Respect Advisory Committee, the Hamilton Committee against Racism, and the Peterborough Community Race Relations Committee. These groups may also help encourage the reporting of hate crime.
Non-governmental organizations (NGOs) play a role in addressing and preventing hate crime. Organizations such as the Alberta Hate Crimes Committee, and Stop Racism and Hate Canada have spaces on their websites for the public to report hate incidents including both actual crimes and non-criminal incidents that involve bias or prejudice.Note NGOs also raise awareness by providing online educational courses for secondary school students and workshops for professionals to teach about multiculturalism and human rights in Canada and how to work positively in a multicultural environment.
In response to reported increases in incidents of discrimination during the COVID-19 pandemic, various Canadian organizations have developed initiatives to report incidents of discrimination and collect information for specific groups. For example, “Project 1907”, “Elimin8Hate” and “Fight COVID Racism” have created centralized online tools and information for reporting incidents of anti-Asian discrimination (Elimin8Hate 2022; Project 1907 2021; Fight COVID Racism 2022). Additionally, in an effort to understand the historical antecedents for hate and discrimination and respond to present and future issues related to hate during the pandemic in British Columbia, the British Columbia Human Rights Commissioner is conducting an inquiry into hate incidents during the COVID-19 pandemic (BC Office of the Human Rights Commissioner 2022).
It is important to note that the initiatives and reporting mechanisms outlined above are not comparable to police-reported metrics obtained through the Uniform Crime Reporting Survey, as they have different methodologies and scope. Many of these and other similar initiatives document hate incidents which may not necessarily be criminal in nature, rather than criminal incidents determined to be motivated by hate. Still, they can offer an important complement to police-reported crime and self-reported victimization motivated by hate.
End of text box 5
Decrease in the number of police-reported hate crimes targeting a religious group for the third year in a row
According to the 2011 National Household Survey, the proportion of people who reported religious affiliations other than Christianity increased from 2001.Note In 2011, 7.2% of the Canadian population reported that they identify as Muslim, Hindu, Sikh or Buddhist, compared to 4.9% in 2001 (Statistics Canada 2013b) (Table 5). The Jewish population has remained stable at 1.0%. Almost one-quarter (23.9%) of Canadians reported no religious affiliation, compared to 16.5% in 2001.
The majority of Canadians who reported non-Christian religious affiliation were also members of a visible minority group, with one exception. The exception was for those who were Jewish, among whom 2% were members of a visible minority group. In 2011, 88% of Muslims and 97% of Buddhists, Hindus and Sikhs residing in Canada were also members of a visible minority group (Statistics Canada 2013b). The overlap between race or ethnicity and religion may have an impact on hate crime statistics, as some religious populations or communities may also be targeted in hate crimes motivated by race or ethnicity. When a hate crime incident involves or appears to involve more than one motivation (e.g., religion and race or ethnicity), the incident is reported by the police only once according to the primary motivation determined by the circumstances of the incident. See Text Box 2 for more information on upcoming changes to the UCR to accommodate reporting incidents with multiple motivations.
In 2020, 515 hate crimes targeting religion were reported by police, a decrease of 16% compared with 2019 (Table 1; Chart 6). This is the third consecutive year-over-year decrease, following a peak of 842 incidents in 2017, yet the number remains higher than those recorded prior to 2017. Among reported hate crimes targeting a religion in 2020, the Jewish and Muslim populations continue to be the most frequent targets, accounting for 62% and 16% of crimes against a religion, respectively.
The decrease of hate crimes targeting religion was primarily due to a relatively large decline in crimes against the Muslim population, which dropped by more than half (-55%) in 2020. There were 100 fewer incidents reported by the police, dropping from 182 incidents to 82 incidents (Chart 9). The decrease in police-reported hate crimes against the Muslim population was largely the result of decreases in Quebec (-50 incidents), Ontario (-27 incidents) and Alberta (-19 incidents).
Chart 9 start
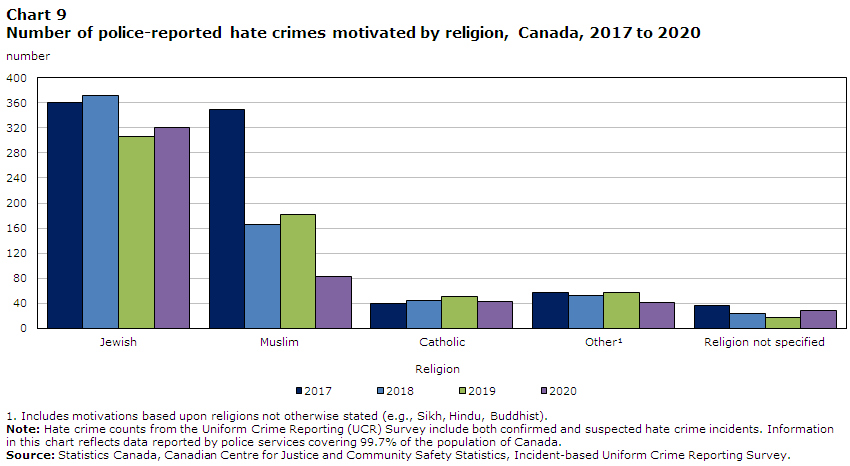
Data table for Chart 9
| Religion | 2017 | 2018 | 2019 | 2020 |
|---|---|---|---|---|
| number | ||||
| Jewish | 360 | 372 | 306 | 321 |
| Muslim | 349 | 166 | 182 | 82 |
| Catholic | 39 | 44 | 51 | 42 |
| OtherData table for chart 9 Note 1 | 57 | 52 | 57 | 41 |
| Religion not specified | 37 | 23 | 17 | 29 |
Source: Statistics Canada, Canadian Centre for Justice and Community Safety Statistics, Incident-based Uniform Crime Reporting Survey. |
||||
Chart 9 end
In contrast, there were 15 more incidents targeting the Jewish population in 2020 compared with 2019, for a total of 321. Among the provinces and territories, notable changes occurred in Ontario (+15 incidents), Quebec (+10 incidents) and Manitoba (-13 incidents). While police-reported metrics indicate a decrease in hate crimes targeting religion, the 2019 General Social Survey on Victimization has shown that people affiliated with a non-Christian religionNote are significantly more likely to report experiencing discrimination on the basis of their religion in the five years preceding the survey than ChristiansNote and those not affiliated with any religion (13.5% compared to 2.6% and 0.7%, respectively).
As with many groups, throughout the pandemic there have been reports of discrimination targeting the Jewish and Muslim populations as a result of disinformation and conspiracy theories related to the pandemic, often tied to broader anti-Jewish or anti-Muslim theories or beliefs (United Nations 2020; Moonshot 2020a). The Canadian Anti-Racism Secretariat, established under Canada’s Anti-Racism Strategy, organized two national summits in 2021: the National Summit on Islamophobia and the National Summit on Antisemitism (Canadian Heritage 2021a; Canadian Heritage 2021b). Both of these summits were intended to build awareness around prejudice and strategies to combat discrimination of religions or religiosity.
Slight decrease in crimes that are motivated by hatred of a sexual orientation
In the police-reported data, a hate crime can be reported as being motivated by the hatred of a (perceived) sexual orientation, including heterosexual, lesbian or gay, bisexual, or any other sexual orientation. This category does not include crimes motivated by hatred targeting the transgender population, as those are collected under the category of sex or gender. That being said, some victims of hate crimes based on sexual orientation may be transgender individuals targeted because of their perceived sexual orientation. When a hate crime incident involves, or appears to involve, more than one motivation (e.g., gender and sexual orientation), the incident is reported by the police only once according to the primary motivation determined by the circumstances of the incident. See Text Box 2 for more information on changes to the UCR to accommodate reporting incidents with multiple motivations.
Canada is home to approximately one million people who are LGBTQ2+, accounting for 4% of the total population aged 15 and older in 2018 (Statistics Canada 2021a). According to the Survey of Safety in Public and Private Spaces, sexual minority people are almost three times more likely to experience violent victimization than heterosexual people (Jaffray 2020). Due to the sensitive nature of hate crimes, particularly those targeting sexual orientation or gender, some individuals may be less likely to report the crime to police for fear of secondary victimization or stigma on the basis of discrimination toward their sexual orientation or gender expression or identity (Department of Justice 2015).
In 2020, police reported 259 hate crimes targeting a perceived sexual orientation, a 2% decrease compared to the previous year (Table 1). Among the provinces and territories, the majority of incidents motivated by hatred of a sexual orientation were reported in Ontario (115 incidents), followed by British Columbia (40 incidents), Alberta (39 incidents) and Quebec (35 incidents) (Table 4).
Crimes motivated by hatred of a sexual orientation made up 10% of all police-reported hate crimes in 2020. The large majority (81%) of these crimes specifically targeted the gay and lesbian community. This proportion, however, has been trending down since 2010, with a peak of 94% in 2013. The remaining hate crimes targeting a sexual orientation in 2020 consisted of those specifically targeting the bisexual orientation (2%), another sexual orientation excluding heterosexual (9%) and an unknown sexual orientation (7%).
Police-reported hate crimes motivated by hatred of a gender expression or identity
From 2011 to 2020, 65 hate crimes targeting gender identities other than male or femaleNote were reported by police. In 2020, there was a decline of 5 incidents compared to the previous year. Even though the overall number is small relative to some other hate crime categories, incidents motivated by hatred of gender diverse people were more often violent in nature, with 80% of incidents involving a violent violation.
Over the same 10 year time period, 74 hate crimes motivated by hatred of women and girls were reported by police. The majority (51 incidents) occurred in the last three years (22 incidents in 2018, 15 in 2019 and 14 in 2020), and the majority of all incidents targeting women or girls (66%) were violent in nature.
Research suggests that discrimination and violence toward individuals based on their gender identity or expression or sexual orientation is widespread (Burczycka 2020; Cotter and Savage 2019; Jaffray 2020; Simpson 2018). According to the latest Survey of Safety in Public and Private Spaces (SSPPS), an estimated 75,000 people in Canada are transgender (Jaffray 2020). For a detailed discussion of discrimination based on gender identity, gender expression or sexual orientation, refer to Text box 5 in the “Police-reported hate crime in Canada, 2019” report (Moreau 2021b).
One-third of hate crimes were cleared
In 2020, nearly one-third (30%) of hate crime incidents were cleared (meaning solved). This compares to 37% of all criminal incidents (excluding traffic offences) reported to police in 2020.
Specifically, of the hate-motivated incidents that were cleared, 73% resulted in charges laid against one or more individuals, and 27% were cleared otherwise, meaning an accused was identified but a charge was not laid. As has historically been the case, in most incidents cleared otherwise in 2020, charges were not laid due to departmental discretion – meaning that in some cases the accused received a warning or caution (46%) or the complainant declined to proceed with charges (35%). The clearance rate for non-violent hate crimes was far lower than the rate for violent hate crimes (14% versus 51%). This is primarily due to very low clearance rates for mischief in general, where it is difficult to identify a perpetrator. In addition, the majority of violent hate crime incidents involved a stranger, which may make it more difficult to investigate and identify a perpetrator. Incidents that involve a youth may be dealt with through diversionary programs or when a charge is laid, cases may not flow through the traditional court system if a victim sought resolution through restorative justice or other alternative measures, or if the Crown determines there is insufficient evidence to proceed with a case in court.
For hate-motivated mischief incidents in 2020, the most common type of non-violent hate crime, 9% were cleared compared to 25% of non-hate motivated mischief. Of these cleared incidents, 64% resulted in the laying of charges in hate-motivated mischief, a larger proportion compared to the 23% of non-hate motivated mischief.
Similarly, for common assault (historically one of the most frequent types of violent hate crime), clearance rates were lower for hate-motivated assaults (58%) compared to non-hate motivated common assaults (65%). Moreover, of those cleared incidents, 80% of hate-motivated common assaults were cleared by charge, compared to 69% of non-hate motivated incidents of common assault.
In 2018, Statistics Canada, in collaboration with police services, updated the Uniform Crime Reporting Survey definition of “founded” and “unfounded” criminal incidents to reflect a more victim-centred approach to recording crimes that accounts for the complexities of certain offences, such as sexual assault, family violence and intimate partner violence. In addition, new categories were added to the clearance status of an incident, including “open/still under investigation”, “insufficient evidence to proceed” and “victim/complainant declines to proceed.” Ultimately, changes in the determination of incidents as founded may have an impact on the number of police-reported crimes. For more information on the changes to the classification of founded incidents see Moreau 2021a and Moreau et al. 2020.
In 2020, over three-quarters (78%) of not cleared police-reported hate crime incidents were due to insufficient evidence to proceed. Again, some non-violent crimes, particularly mischief, can have low clearance rates as it can be difficult to identify a perpetrator.
Most hate crime cases completed in court involve public incitement and wilful promotion of hatred offences
The prosecution of crimes as motivated by hate can be complex from a legal standpoint; while any criminal incident has the potential to be motivated by hate, it can be difficult to prove motivation beyond a reasonable doubt in court. Additionally, the prosecution of hate crimes involving hate-motivated language can be difficult due to provisions regarding protected speech. Ultimately, while police may classify a crime as hate-motivated, this may only be considered by a court as an aggravating factor at the time of sentencing. The only exception to this being those Criminal Code offences that are specifically hate crimes.
According to Canada's Integrated Criminal Court Survey, there were 81 cases completedNote in adult criminal and youth courts where the most serious charge in the case was a hate crime related offence, over the period of 2009/2010 to 2019/2020. These were cases, processed mostly in adult criminal courts, where the most serious charge in the case was either advocating genocide (CCC s.318); public incitement and wilful promotion of hatred (CCC s.319); or mischief relating to religious property (CCC s.430 (4.1)).Note In total, 305 charges for hate crime related offences were processed in court between 2009/2010 and 2019/2020. Hate crime charges largely comprised public incitement and wilful promotion of hatred (85%), followed by mischief relating to religious property (9%) and advocating genocide (6%).
Of the 81 completed hate crime cases from 2009/2010 to 2019/2020, 43% ended in a finding of guilt, an additional 38% were stayed, withdrawn, dismissed, or discharged by the courts, 6% were acquitted, and 12% received other decisions.
In 69% of hate crime cases ending in a finding of guilt, the accused was sentenced to probation. A sentence of custody was handed down in 34% of hate crime cases.
Currently, data from courts do not allow for an analysis of the use of sentencing provisions that take hate-motivation into account as an aggravating factor. Still, court data that are available on the hate crime offences outlined in the Criminal Code suggest that there have been relatively few such cases from 2009/2010 to 2019/2020.
Data from a prior linkage study conducted to evaluate court and sentencing outcomes for police-reported hate crime incidents (not necessarily incidents involving a hate crime offence as defined by the Criminal Code) suggest that the majority of hate-motivated crimes do not enter criminal court. Overall, 82% of hate crimes identified between 2013 and 2018 did not result in a charge after being reported by police, typically because there was no accused person identified by police. For court cases that were linked to hate-motivated incidents, more than six in ten (64%) resulted in a finding of guilt, for which almost four in ten (39%) resulted in a custody sentence. Information was not available on whether the sentencing provisions set forth under section 718.2 of the Criminal Code were applied in cases involving hate-motivated crime. For more detailed information from this linkage study, refer to the “Police-reported hate crime in Canada, 2019” report (Moreau 2021b).
Section 2: Police-reported hate crime between 2011 and 2020
Given the annual counts of hate-motivated crimes can be relatively small, the following sections on police-reported hate crime are based on detailed incidents from 2011 to 2020 in order to provide information on the characteristics of incidents, victims and accused persons.
Police-reported hate crime targeting a sexual orientation, the South Asian, the Arab or West Asian, and the East and Southeast Asian populations was more often violent
While the large majority (76% in 2020) of police-reported crime (excluding traffic offences) is non-violent in nature, hate crimes targeting specific population groups were more likely to be violent (Moreau 2021a). Specifically, among police-reported hate crimes targeting race or ethnicity between 2011 and 2020, the majority of hate crimes targeting people perceived to be South Asian (68%), Arab or West Asian (66%), and East or Southeast Asian (57%) were violent. As well, most hate crimes motivated by a person’s perceived sexual orientation were violent (61%). The proportions of violent crimes targeting these populations were similar, with common assault occurring most often (between 22% and 29% of all hate crimes), followed by uttering threats (12% to 19%) and assault with a weapon or causing bodily harm (7% to 10%).
Despite relatively few incidents during that same time frame, those targeting people with disabilities (66%) were also more likely to be violent. The 2017 Canadian Survey on Disability (CSD)Note found that just over one in five (22%) Canadians aged 15 and older had at least one disability (Morris et al. 2018). Research to date has found that having a disability, and the severity of the disability, are linked to lower levels of employment and higher levels of poverty and victimization (Cotter 2018; Morris et al. 2018). A recent analysis of self-reported data on violent victimization found that women with a disability were twice as likely to be victims of violent crime (137 incidents per 1,000 women with a disability versus 65 incidents per 1,000 women without a disability), and are more likely to experience repeated violence over a 12-month period, than women who do not have a disability (Cotter 2018).
Notably, mischief (which includes graffiti) accounted for the largest proportion of hate crime violations in 2020 (44%). Mischief may be especially impacted by greater variation in identification by and reporting to the police, thus it can affect the proportion of hate crime motivations reported for non-violent crimes versus violent crimes. For example, 71% of police-reported hate crimes targeting religion were mischief, compared to 39% targeting race or ethnicity.
Police-reported hate crime targeting the Black population and religion more often non-violent
Between 2011 and 2020, the majority of hate crimes against the Black population were non-violent crimes (59%). The vast majority of these non-violent crimes were general mischief (82%), while the most common violent crimes were common assault (37%), followed by uttering threats (27%). Although there were relatively few police-reported hate crimes against the Indigenous population, they were more or less as likely to be non-violent (51%) as violent (49%).
During the same period, the vast majority (85%) of hate crimes targeting the Jewish population were non-violent. Among these non-violent crimes, general mischief accounted for the largest proportion (80%), as well as hate-motivated mischief relating to property primarily used for religious worship or by an identifiable group (9%). The most common violent offence against this population was uttering threats (40% of violent offences and 6% of all offences targeting the Jewish population).
From 2011 to 2020, hate crimes against the Muslim population were also more likely to be non-violent (57%). The most common non-violent hate crime was general mischief (57% of non-violent offences). Violent hate crimes accounted for 43% of crimes targeting the Muslim population, with uttering threats (43%) and common assault (25%) being the most common.
Start of text box 6
Text box 6
Hate crime and violent extremism
Hate crime and violent extremism are motivated by hate of perceived or real differences between an individual and others, be it race, religion, gender, sexual orientation, or other identity (CSIS 2020; CSIS 2021; Perry and Scrivens 2017; Stevkovski 2015). There is no specific Criminal Code definition for violent extremism, rather Section 83 of the Criminal Code specifies terrorism offences which include an ideological component. Hate crime and terrorism offences can overlap because there can be multiple motives for a criminal act. Terrorism offences differ from hate crimes in that they are motivated by the goal of advancing a cause, whether political, ideological or religious, rather than a particular bias motivation toward the characteristics of others.
Public Safety Canada defines violent extremism as “a term describing the beliefs and actions of people who support or use violence to achieve extreme ideological, religious or political goals” (Public Safety Canada 2018b). While not all hate crimes or hate incidents are perpetrated by violent extremists or those holding concerted hateful attitudes, the presence of these entities, particularly online, can legitimize broader racist or discriminatory attitudes. As well, comparatively innocuous or non-violent statements or actions can serve to radicalize or mobilize certain individuals or groups into potentially violent action.
Violent extremism can be religiously (RMVE), politically (PMVE) or ideologically motivated (IMVE). There are four subcategories under IMVE, including xenophobic violence, anti-authority violence, gender-driven violence and other grievance-driven and ideologically motivated violence. This framework helps bring clarity to the concepts in use and helps to ensure that the language used does not unintentionally or unfairly stigmatize any given community, notably those with radical points of view, which are not necessarily problematic in and of themselves and are legally protected under the Canadian Charter of Rights and Freedoms.
In December 2018, the Government of Canada’s National Strategy on Countering Radicalization to Violence articulated an approach toward preventing and countering expressions of intolerance, hate, and violent extremism in the public and online spheres (Public Safety Canada 2018a). Part of this approach involves funding initiatives that aim to prevent radicalization to violence in Canada, particularly with respect to the online space.
One such initiative is the “Canada Redirect” project, with partnership from the company Moonshot CVE (Countering Violent Extremism). The objective of the project is to help counter radicalization and provide positive alternative content to anyone searching online for extremist topics and who may be vulnerable to radicalizationNote (Public Safety Canada 2018b). Moonshot CVE has released various reports documenting search traffic related to specific topics throughout the COVID-19 pandemic. In an early review of internet search engine traffic at the outset of the pandemic, weekly searches for violent “far-right” keywords had increased since the beginning of the pandemic across six Canadian cities by an average of 18.5% (Moonshot 2020b). Furthermore, there was evidence of an increase in Twitter discourse targeting China and Chinese people as well as anti-Jewish and conspiracy theory content (Moonshot 2020a).
End of text box 6
Police-reported violent hate crimes against Indigenous and Muslim populations more likely than other hate crimes to involve women victims
For all types of hate crimes reported to police between 2011 and 2020, 66% of victims were men and 34% were women. While men accounted for the majority of victims in all types of hate crimes, this was particularly the case among crimes targeting a person’s sexual orientation, where 79% of victims were men.
Relative to other types of violent hate crime, incidents targeting the Muslim and Indigenous populations were more likely to involve women victims. Of all victims of violent crimes targeting the Muslim population that were reported to police, 47% were women or girls, while this was the case for 44% of victims of hate crimes against the Indigenous population (Table 7).
Of note, the relatively high proportion of women victims of hate crimes targeting the Muslim and Indigenous populations could be related to specific factors. For example, the practice of wearing head coverings may make religious identity more visible for Muslim women than for men (National Council of Canadian Muslims 2014; National Council of Canadian Muslims 2017). Additionally, the overrepresentation of Indigenous women as victims of violence has been documented in several reports, for example: Boyce 2016; Miladinovic and Mulligan 2015; Perreault 2015; Scrim 2009). For the most recent information on self-reported victimization in Canada and its context, see Cotter 2021.
Hate crimes typically occur in open areas and at residences
From 2011 to 2020, police-reported hate crimes most often occurred in open areas or at residences. Specifically, violent hate crimes occurred most frequently in open areas like on the street or in parks or fields (33%), at residences (26%) and at commercial businesses (18%) (Table 8). These proportions were similar for violent offences targeting race or ethnicity, although those targeting East or Southeast Asian (46%) Indigenous (44%), and South Asian (41%) populations were more likely to occur in open areas.
Violent hate crimes targeting religion were the most likely to occur in religious institutions (12% occurred in religious institutions) than other types of violent hate crime, while incidents targeting the Muslim population (28%) were more likely to occur in an open area compared to those targeting the Jewish population (19%).
Non-violent hate crimes most often occurred in open areas (30%), at residences (24%), educational institutions (14%) and commercial businesses (13%). Compared to violent hate crimes, non-violent hate crimes targeting race or ethnicity, and religion, which are largely mischief offences, occurred more often at educational and religious institutions. For instance, 15% of non-violent hate crimes targeting race or ethnicity occurred at an educational institution, compared to 6% of violent hate crimes (Table 8). For non-violent hate crimes targeting religion, 21% occurred at religious institutions, 14% at educational institutions and 10% at commercial businesses. In contrast, non-violent hate crimes targeting sexual orientation occurred more often at a residence (36%) than anywhere else.
Uttering threats the most common type of cyber hate crime
The internet provides a platform for equal communication of beliefs and opinions by all users. It also offers a medium for the spread of hate-related content targeting various groups. According to data from the 2009 GSS, 30% of internet users aged 15 to 24 came across hate content while on the internet, with ethnic and religious minorities the most commonly targeted (Perreault 2013). During the COVID-19 pandemic, Canadians turned to the Internet to facilitate work, school, shopping, health care and social interaction (Bilodeau et al. 2021; Statistics Canada 2020d). A greater online presence could increase the risk for different types of criminal offences facilitated by the Internet, including instances of harassment, discrimination or hate. The Government of Canada recently announced Canada’s Digital Charter, which outlines ten guiding principles under which the public can expect to interact with digital content or platforms (Government of Canada 2019). One of these principles includes being free from hate and violent extremism. The Digital Charter states that Canadians can expect that digital platforms will not foster or disseminate hate, violent extremism or criminal content.
The proportion of police-reported hate crime incidents that were also recorded by police as cybercrimes has been increasing in recent years, from 5.1% in 2018, to 6.9% in 2019 and 7.1% in 2020.Note The majority of cyber-related hate crime was composed of incidents of criminal harassment, indecent or harassing communications, uttering threats and public incitement of hatred. For comparison, just over 3% of all criminal incidents (excluding traffic offences) reported by police in 2020 were recorded as cybercrimes, though this proportion has also been increasing in recent years. Increased focus on the enforcement and reporting accuracy of cybercrime, as well as increased awareness of cybercrime by both the public and police, may contribute to changes over time.
Of the 575 hate crimes that were also recorded by police as cybercrimes between 2016 and 2020,Note these most commonly targeted the Muslim population (16%), the Black population (15%), a sexual orientation (13%), and the Jewish population (13%).Note Over the same 5 year period, uttering threats (39%) was by far the most common type of hate-motivated cybercrime, followed by indecent or harassing communications (24%), public incitement of hatred (12%) and criminal harassment (11%). In comparison, these offences accounted for a smaller proportion of non-cyber hate crimes.
Victims of police-reported violent hate crimes targeting sexual orientation and the Indigenous population are the youngest and have highest percentage of injury
From 2011 to 2020, victims of violent hate crime where their perceived sexual orientation was targeted and victims identified as Indigenous tend to be the youngest, with a median age of 28 years (Table 7). According to police-reported data for violent hate-motivated incidents, the median age of all victims was 32 years. The median age for victims of violent crimes targeting religion was relatively high at 37 years. From 2016 to 2020, the median age of victims targeted for sexual orientation has remained lower than those targeted based on religion or race or ethnicity (Chart 10).
Chart 10 start

Data table for Chart 10
| Year | TotalData table for chart 10 Note 1 | Race or ethnicity | Religion | Sexual orientation |
|---|---|---|---|---|
| median age | ||||
| 2016 | 32.0 | 33.0 | 32.0 | 30.0 |
| 2017 | 34.0 | 31.0 | 39.0 | 31.0 |
| 2018 | 31.0 | 31.0 | 35.0 | 28.0 |
| 2019 | 33.0 | 35.0 | 34.0 | 26.0 |
| 2020 | 32.5 | 33.0 | 39.0 | 27.0 |
Source: Statistics Canada, Canadian Centre for Justice and Community Safety Statistics, Incident-based Uniform Crime Reporting Survey. |
||||
Chart 10 end
Between 2011 and 2020, victims of violent hate crimes targeting Indigenous peoples (42%) and sexual orientation (38%) were the most likely to have sustained injury (Table 7). Overall, victims of violent hate crimes targeting race or ethnicity were more likely to have resulted in injuries than crimes targeting religion.
Victims of police-reported violent hate crimes targeting East and Southeast Asian population, the South Asian population, and the Muslim population more often to be victimized by strangers
Unlike police-reported crime in general, the majority (64%) of hate crime victims were victimized by a stranger. The East and Southeast Asian population (83%) was most likely to be victimized by a stranger, followed by the South Asian population (79%) and the Muslim population (78%) (Table 7). Compared to other types of hate crime victims, the prevalence of victimization by an acquaintance was highest among victims targeted because of their perceived sexual orientation (39%) and victims of hate crimes targeting the Indigenous (37%), Jewish (37%) and Black populations (36%). Overall, very few (4%) hate crime victims were victimized by a family member or intimate partner, compared to an acquaintance (32%) or a stranger (64%).
Persons accused of hate crimes tend to be male and younger
Like crime in general, the vast majority of persons accused of hate crime tend to be young males (Table 9). Overall, from 2011 to 2020, 89% of persons accused of hate crime targeting religion and sexual orientation were male, as were 84% of those targeting race or ethnicity. The median age for persons accused of hate crime was 30, with persons accused of hate crimes against the Muslim and Arab or West Asian populations tending to be oldest (44 and 38 years of age, respectively).
Additionally, when looking the five year trend from 2016 to 2020, the median age of those accused of hate crime has been trending up, from a low of 31 in 2016 to a high of 35 in 2020 (Chart 11). The median age of those accused of hate crimes targeting religion has dropped for three years in a row, from 42 in 2017 to 36 in 2020. In contrast, the median age of those accused of hate crimes targeting race or ethnicity rose for three years in a row and became the oldest at 38 years of age in 2020. As with victims of hate crime, the median age of those accused of hate crimes targeting sexual orientation tends to be younger, ranging from 23 years old in 2020 to 28 years old in 2018 (Chart 11).
Chart 11 start
Data table for Chart 11
| Year | TotalData table for chart 11 Note 1 | Race or ethnicity | Religion | Sexual orientation |
|---|---|---|---|---|
| median age | ||||
| 2016 | 31.0 | 31.0 | 33.0 | 23.0 |
| 2017 | 33.0 | 29.0 | 42.0 | 27.0 |
| 2018 | 32.5 | 32.0 | 40.0 | 27.5 |
| 2019 | 35.0 | 36.0 | 38.0 | 26.0 |
| 2020 | 35.0 | 38.0 | 36.0 | 23.0 |
Source: Statistics Canada, Canadian Centre for Justice and Community Safety Statistics, Incident-based Uniform Crime Reporting Survey. |
||||
Chart 11 end
Between 2011 and 2020, youth aged 12 to 17 made up 21% of all persons accused of hate crime. Similar to all hate crimes, the vast majority of youth accused of hate crime were male (87%). Over half (54%) of the youth accused of hate crimes targeted race or ethnicity, followed by 22% targeting sexual orientation and 18% targeting religion.
Summary
Canada is a multicultural and diverse country, and it is important to understand the experiences of this diverse population, including the nature and extent of hate-motivated crime. The COVID-19 pandemic has exacerbated some of the social barriers that different groups of people face, for example negative interactions with the police and social institutions, job loss, physical and mental health, and feelings of community safety and inclusion. Self-reported victimization surveys, crowdsourcing initiatives and Canada-level surveys indicate disproportionate levels of discrimination experienced by racialized and Indigenous people before and during the pandemic. In the first year of the COVID-19 pandemic, police-reported hate crimes increased 37%, from 1,951 to 2,669 incidents. Hate crimes rose in the majority of provinces and in two territories.
Police-reported hate crime data represent one dimension in a complex analysis of hate-motivated crime more generally. Police-reported hate crime data include only those incidents that come to the attention of police services and are determined to be motivated by hate at the discretion of police following an investigation. A change in the number of police-reported hate crimes could be the result of a change in the actual number of crimes occurring, or it could be the result of changes in the recognition and reporting of hate crimes. Other sources of information, for example self-reported victimization and perceptions of safety and trust in the police are also important indicators for contextualizing hate-motivated crime.
Nationally, police-reported hate crimes targeting race or ethnicity nearly doubled, specifically against the Black, East or Southeast Asian, Indigenous and South Asian populations. For each of these groups, the number of hate crimes was the highest since comparable data have been available. Conversely, police reported a decrease in hate crimes targeting religion. This was largely due to fewer crimes targeting the Muslim population, while there was a slight uptick in crimes targeting the Jewish population. Overall, crimes targeting the Black and Jewish populations were the most prevalent types of police-reported hate crime in Canada, continuing the trend from previous years.
Both non-violent and violent hate crimes increased from 2019 to 2020. The increase in non-violent hate crimes was primarily due to an increase in mischief offences. The rise in violent hate crimes was driven by increases in all selected types of violent hate crimes. Overall in 2020, less than half (43%) of hate crimes were violent, a similar proportion to previous years. Although the majority of hate crimes are non-violent, analysis of characteristics of hate crimes reported to police between 2011 and 2020 suggest that hate-motivated crimes targeting a sexual orientation, the South Asian, the Arab or West Asian, and the East and Southeast Asian populations are more likely to be violent than non-violent.
This multi-year analysis provides other insights into the variations in hate crimes across various groups. For instance, victims of violent hate crimes targeting a sexual orientation and the Indigenous population tend to be the youngest among hate crime victims and sustain the highest rate of injury. Furthermore, compared to other hate crime victims, victims of crimes targeting the East or Southeast Asian, South Asian and Muslim populations were most likely to be victimized by strangers. In contrast, the rate of victimization by someone known to the victim was highest among victims of hate crimes targeting a sexual orientation and the Indigenous, Jewish and Black populations.
Detailed data tables
Table 1 Police-reported hate crimes, by detailed motivation, Canada, 2016 to 2020
Table 2 Confirmed and suspected hate crimes, by type of motivation, Canada, 2016 to 2020
Table 3 Police-reported hate crimes, by most serious violation, Canada, 2019 and 2020
Table 4 Police-reported hate crimes, by type of motivation, province or territory, 2018 to 2020
Table 6 Number and rate of police-reported hate crimes, by census metropolitan area, 2018 to 2020
Table 7 Characteristics of hate crime victims, by detailed motivation, Canada, 2011 to 2020
Survey description
Incident-based Uniform Crime Reporting Survey
This article uses data from the Incident-based Uniform Crime Reporting Survey (UCR2). This is a microdata survey that captures detailed information on crimes reported to and substantiated by police, comprising the characteristics of victims, accused persons and incidents. In response to changing information needs, the survey was modified in 2005 (UCR2.2) to enable identification of incidents motivated by hate based on race, national or ethnic origin, religion, sexual orientation, gender identity or expression, language, sex, age, mental or physical disability, or any other similar factor.
Police-reported hate crimes are reported as criminal incidents. A criminal incident involves one or more related offences that are committed during a single criminal event and have been reported to police. Where there are multiple victims or accused within a single criminal event, one incident is still recorded, with multiple victim or accused records linked to it. For example, a single incident involving an assault on three victims at the same time and location is counted as one incident of assault motivated by hate. When determining the number of victims, there would be three victims of a hate-motivated assault.
In the UCR Survey, police services can report up to four offences per incident. However, to conform to statistical reporting standards for this survey, only the most serious offence in an incident is used in this analysis. Hate crime counts from the Uniform Crime Reporting (UCR) Survey include both confirmed and suspected hate crime incidents. Hate crime, organized crime and cybercrime data from the Uniform Crime Reporting (UCR) Survey are now revised back one year with each annual release. This approach was introduced for the 2019 data release and was applied to the 2018 revised data.
In 2020, police services reporting to the UCR 2.2 version of the survey or higher served 99.7% of the population of Canada.
Prior to the release of 2018 revised UCR data, which marked the full implementation of enhanced data production processes that allow for the release of hate crime data with annual national UCR crime statistics, the UCR 2.2 Supplemental Survey was conducted each year since 2006 as a means of obtaining information on hate-motivated crimes from those police services reporting microdata but which had not yet converted their electronic reporting systems to the newest UCR2 version. These respondents were asked to identify those criminal incidents that had been motivated by hate and to manually provide aggregate counts of incidents by the detailed motivation to Statistics Canada. Additional information (e.g., type of crime, weapon use, level of injury and relationship) cannot be provided by these respondents.
The Oshawa census metropolitan area (CMA) is excluded from the analysis of hate crimes by CMA due to the incongruity between the police service jurisdictional boundaries and the CMA boundaries. For the same reason, data from the Halton and Durham police services are also excluded. The exclusion of information from Halton police affects the coverage for the Toronto and Hamilton CMAs. The exclusion of information from the Durham police affects coverage for Toronto. As a result, information for the CMA of Toronto reflects data from police serving 91% of the population of the CMA of Toronto. For Hamilton, data cover 75% of the Hamilton CMA population.
The UCR2 Survey collects information on victims of violent crimes when they are identified in an incident. In 2020, information on 1,153 victims of violent offences was reported in 930 hate crime incidents. In 17% of violent hate crime incidents involving victims, more than one victim was identified. Information on victims reflects data reported by police services covering 99.7% of the population of Canada. It is not provided by police services who have reported to the UCR 2.2 Supplemental Survey.
UCR2 also collects information about persons accused of hate crime. In 2020, there was information on 908 accused individuals associated with 796 incidents. In 8% of these incidents, more than one accused was identified. Information on accused reflects data reported by police services serving 99.7% of the population of Canada. It is not provided by police services who have reported to the UCR 2.2 Supplemental Survey.
Data on hate crimes are also available in Tables 35-10-0066-01, 35-10-0067-01, and 35-10-0191-01.
References
Allen, M. 2020. “Crime reported by police serving areas where the majority of the population is Indigenous, 2018.” Juristat. Statistics Canada Catalogue no. 85-002-X.
Armstrong, A. 2019. “Police-reported hate crime in Canada, 2017.” Juristat. Statistics Canada Catalogue no. 85-002-X.
Armstrong, A. and B. Jaffray. 2021. “Homicide in Canada, 2020.” Juristat. Statistics Canada Catalogue no. 85-002-X.
Arriagada, P., T. Hahmann, and V. O’Donnell. 2020. “StatCan COVID-19: Data to insights for a better Canada Indigenous people in urban areas: Vulnerabilities to the socioeconomic impacts of COVID-19.” StatCan COVID-19: Data to insights for a better Canada. Statistics Canada Catalogue no. 45-28-0001.
BC Office of the Human Rights Commissioner. 2022. Inquiry into hate in the pandemic. British Columbia’s Office of the Human Rights Commissioner.
Ben-Porat, Guy. 2008. “Policing multicultural states: lessons from the Canadian model.” Policing and Society. Vol. 18, no. 4, p. 411-425.
Bilodeau, H., A. Kehler and N. Minnema. 2021. “Internet use and COVID-19: How the pandemic increased the amount of time Canadians spend online.” StatCan COVID-19: Data to insights for a better Canada. Statistics Canada Catalogue no. 45-28-0001.
Bombay, A., K., Matheson, and H., Anisman. 2009. “Intergenerational trauma: Convergence of multiple processes among First Nations peoples in Canada.” Journal of Aboriginal Health. p. 6-47.
Bombay, A., K., Matheson, and H., Anisman. 2011. “The impact of stressors on second generation Indian residential school survivors.” Transcultural Psychiatry. 48(4), 367-391.
Bombay, A., K., Matheson, and H., Anisman. 2014. “The intergenerational effects of Indian Residential Schools: Implication for the concept of historical trauma.” Transcultural Psychiatry. 51(3), 320-338.
Boyce, J. 2016. “Victimization of Aboriginal people in Canada, 2014.” Juristat. Statistics Canada Catalogue no. 85-002-X.
Brown, Ben and Wm. Reed Benedict. 2002, “Perceptions of the police: Past findings, methodological issues, conceptual issues and policy implications.” Policing: An International Journal of Police Strategies and Management. Vol. 25, no. 3. p. 543-580.
Burczycka, M. 2020. “Students’ experiences of discrimination based on gender, gender identity or sexual orientation at postsecondary schools in the Canadian provinces, 2019.” Juristat Bulletin – Quick Fact. Statistics Canada Catalogue no. 85-005-X.
Canadian Heritage. 2019. Building a Foundation for Change: Canada’s Anti-Racism Strategy 2019-2022. Ottawa.
Canadian Heritage. 2021a. “The Government of Canada concludes national summit on Islamophobia.” News Release. July 22, 2021.
Canadian Heritage. 2021b. “The Government of Canada concludes national summit on Antisemitism.” News Release. July 21, 2021.
Canadian Heritage. n.d. a. “Events in Asian Canadian history.” Asian Heritage Month.
Canadian Heritage. n.d. b. “Addressing anti-Asian racism.” Asian Heritage Month.
Chan, Wendy and Kiran Mirchandani. 2002. Crimes of Colour: Racialization and the Criminal Justice System in Canada. Peterborough. Broadview Press.
Cotter, A. 2018. “Violent victimization of women with disabilities, 2014.” Juristat. Statistics Canada Catalogue no. 85-002-X.
Cotter, A. 2021. “Criminal victimization in Canada, 2019.” Juristat. Statistics Canada Catalogue no. 85-002-X.
Cotter, A. 2022a. “Perceptions of and experiences with police and the justice system among the Black and Indigenous populations in Canada.” Juristat. Statistics Canada Catalogue no. 85-002-X.
Cotter, A. 2022b. “Experiences of discrimination among the Black and Indigenous populations in Canada, 2019.” Juristat. Statistics Canada Catalogue no. 85-002-X.
Cotter, A. and L. Savage. 2019. “Gender-based violence and unwanted sexual behaviour in Canada, 2018: Initial findings from the Survey of Safety in Public and Private Spaces.” Juristat. Statistics Canada Catalogue no. 85-002-X.
Council of Canadian Academies, 2019. “Toward peace, harmony, and well-being: Policing in Indigenous communities.” The Expert Panel on Policing in Indigenous Communities. Council of Canadian Academies. Ottawa, Ontario.
CSIS. 2020. “CSIS public report 2019.” Publications. Canadian Security Intelligence Service.
CSIS. 2021. “CSIS public report 2020.” Publications. Canadian Security Intelligence Service.
Department of Justice. 2015. “Disproportionate Harm: Hate Crime in Canada.” Reports and Publications. January 7, 2015.
Digital Citizen Initiative. 2022. “Online disinformation.” Canadian Heritage. Government of Canada. https://www.canada.ca/en/canadian-heritage/services/online-disinformation.html.
Elimin8Hate. 2022. #Elimin8Hate. https://www.elimin8hate.org
Fight COVID Racism. 2022. Fight COVID-19 racism. https://www.covidracism.ca/.
Government of Canada. 2019. Canada’s Digital Charter. Toronto.
Heidinger, L. and A. Cotter. 2020. “Perceptions of personal safety among population groups designated as visible minorities in Canada during the COVID-19 pandemic.” STATCAN COVID-19: Data to Insights for a Better Canada. Statistics Canada Catalogue no. 45280001.
House of Commons. 2018. “Indigenous people in the federal correctional system.” Report of the Standing Committee on Public Safety and National Security. 42nd Parliament, 1st session (June 2018).
Ibrahim, D. 2020. “Public perceptions of the police in Canada’s provinces, 2019.” Juristat. Statistics Canada Catalogue no. 85-002-X.
Jaffray, B. 2020. “Experiences of violent victimization and unwanted sexual behaviours among gay, lesbian, bisexual and other sexual minority people, and the transgender population, in Canada, 2018.” Juristat. Statistics Canada Catalogue no. 85-002-X.
Jones, N.A., Ruddell, R., Nestor, R., Quinn, K. and Phillips, B. 2014. “First Nations policing: A review of the literature.” Collaborative Centre for Justice and Safety. Regina, Saskatchewan.
Miladinovic, Z. and L. Mulligan. 2015. “Homicide in Canada, 2014.” Juristat. Statistics Canada Catalogue no. 85-002-X.
Moonshot. 2020a. “COVID-19: Conspiracy theories, hate speech and incitements to violence on Twitter.” Moonshot Team Resources.
Moonshot. 2020b. “COVID-19: Increase in far-right searches in Canada.” Moonshot Team Resources.
Moreau, G. 2021a. “Police-reported crime statistics in Canada, 2020.” Juristat. Statistics Canada Catalogue no. 85-002-X.
Moreau, G. 2021b. “Police-reported hate crime in Canada, 2019.” Juristat. Statistics Canada Catalogue no. 85-002-X.
Moreau, G., Jaffray, B. and Armstrong, A. 2020. “Police-reported crime statistics in Canada, 2019.” Juristat. Statistics Canada Catalogue no. 85-002-X.
Morris, S., Fawcett, G., Brisebois L. and J. Hughes. 2018. “A demographic, employment and income profile of Canadians with disabilities aged 15 years and over, 2017.” Canadian Survey on Disability Reports. Statistics Canada Catalogue no. 89-654-X.
National Council of Canadian Muslims. 2014. 2013 ODIHR Hate Crime Report. Ottawa.
National Council of Canadian Muslims. 2017. 2016 ODIHR Hate Crime Report. Ottawa.
National Inquiry into Missing and Murdered Indigenous Women and Girls (MMIWG). 2019. Reclaiming Power and Place: The Final Report on the National Inquiry into Missing and Murdered Indigenous Women and Girls.
Nilson, Chad and Barb Mantello. 2019. “Joining the circle: Identifying key ingredients for effective police collaboration within Indigenous communities.” Community Safety Knowledge Alliance. Saskatoon, Saskatchewan.
Office for Democratic Institutions and Human Rights. 2021. Hate crime data. OSCE ODIHR Hate Crime Reporting.
Office for Democratic Institutions and Human Rights. 2018. Prosecuting Hate Crimes: A Practical Guide.
Office of the Correctional Investigator. 2020. “Indigenous People in Federal Custody Surpasses 30%: Correctional Investigator Issues Statement and Challenge.” News Release. January 21, 2020.
Ontario Human Rights Commission. 2003. “The impact of racial profiling on the Aboriginal community.” Paying the Price: The Human Cost of Racial Profiling. Ontario Human Rights Commission.
Perreault, S. 2013. “Self-reported internet victimization in Canada, 2009.” Juristat. Statistics Canada Catalogue no. 85-002-X.
Perreault, S. 2015. “Criminal victimization in Canada, 2014.” Juristat. Statistics Canada Catalogue no. 85-002-X.
Perry , B. 2010. “Policing hate crime in a Multicultural society observations from Canada.” International Journal of Law, Crime and Justice. Vol. 38. p. 120 to 140.
Perry, B. and Scrivens, R. 2017. “Resisting the Right: Countering right-wing extremism in Canada.” Canadian Journal of Criminology and Criminal Justice. Vol. 59, no. 4. p. 534 to 558.
Project 1907. 2021. Project 1907. https://www.project1907.org/.
Public Safety Canada. 2018b. Funding Project Descriptions: Canada Redirect.
Public Safety Canada. 2018a. National Strategy on Countering Radicalization to Violence.
Scrim , K. 2009. Aboriginal Victimization in Canada: A Summary of the Literature. Department of Justice.
Selkirk, M. 2020. “Visible minority status and confidence in the police.” The Sociological Imagination: Western’s Undergraduate Sociology and Criminology Student Journal. Vol. 6, no. 1.
Simpson, L. 2018. “Violent victimization and discrimination among visible minority populations, Canada, 2014.” Juristat. Statistics Canada Catalogue no. 85-002-X.
Statistics Canada. 2010. Projections of the Diversity of the Canadian Population: 2006 to 2031. Statistics Canada Catalogue no. 91-551-X.
Statistics Canada. 2013a. Aboriginal Peoples in Canada: First Nations People, Métis and Inuit. National Household Survey, 2011. Statistics Canada Catalogue no. 99-011-X.
Statistics Canada. 2013b. Immigration and Ethnocultural Diversity in Canada. National Household Survey, 2011. Statistics Canada Catalogue no. 99-010-X.
Statistics Canada. 2017a. Study: A Look at Immigration, Ethnocultural Diversity and Languages in Canada up to 2036, 2011 to 2036. Statistics Canada Catalogue no. 91-551-X, Ottawa.
Statistics Canada. 2017b. “Same-sex couples in Canada in 2016.” Census in Brief. Statistics Canada Catalogue no. 98-200-X, Ottawa.
Statistics Canada. 2020a. “Impacts on Indigenous Peoples.” A Presentation Series from Statistics Canada About the Economy, Environment and Society. Statistics Canada Catalogue no. 11-631-X.
Statistics Canada. 2020b. “Collection of data on Indigenous and ethno-cultural groups in Canada’s official police-reported crime statistics.” Statistical Announcements. Statistics Canada.
Statistics Canada. 2020c. “First Nations people, Métis and Inuit and COVID-19: Health and social characteristics.” The Daily. Statistics Canada Catalogue no. 11-001-X.
Statistics Canada. 2020d. “Canadians spend more money and time online during pandemic and over two-fifths report a cyber incident.” The Daily. Statistics Canada Catalogue no. 11-001-X.
Statistics Canada. 2021a. “A statistical portrait of Canada's diverse LGBTQ2+ communities.” The Daily. Statistics Canada Catalogue no. 11-001-X.
Statistics Canada. 2021b. “Projections of the Indigenous populations and households in Canada, 2016 to 2041.” The Daily. Statistics Canada Catalogue no. 11-001-X.
Statistics Canada. 2021c. “Portrait of Canadian Society: Experiences during the pandemic.” The Daily. Statistics Canada Catalogue no. 11-001-X.
Stevkovski, L. 2015. “The rise of Right-Wing extremism in European Union.” Interdisciplinary Political and Cultural Journal. Vol. 17, no. 1. p. 43 to 57.
The Truth and Reconciliation Commission of Canada. 2015. Summary of the Final Report of the Truth and Reconciliation Commission of Canada.
United Nations. 2020. “Secretary-General Denounces ‘Tsunami’ of Xenophobia Unleashed amid COVID-19, Calling for All-Out Effort against Hate Speech.” Meetings coverage and press releases. May 8, 2020.
United Nations. 2021. “UN chief ‘profoundly concerned’ over rise in violence against Asian.” UN News. March 22, 2021.
Xu, X. 2020. “Data shows an increase in anti-Asian hate incidents in Canada since onset of pandemic.” The Globe and Mail.
- Date modified: