Natural resource indicators, second quarter 2023
Released: 2023-09-25
Natural resources real gross domestic product decreases in the second quarter
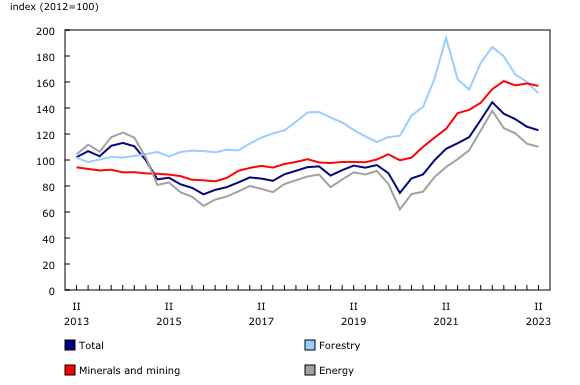
Real gross domestic product (GDP) of the natural resources sector decreased 0.4% in the second quarter, the third consecutive quarterly decline. In contrast, the economy-wide real GDP was nearly unchanged.
The decrease in real GDP in the second quarter was driven by the forestry (-4.4%), minerals and mining (-2.2%) and hunting, fishing and water (-1.8%) subsectors. At the same time, the energy subsector increased 0.4%.
The decline in the forestry subsector was attributable to primary sawmill and wood products (-6.5%), which reflected drops in new construction (-8.2%) and renovation activities (-4.3%) and coincided with higher borrowing costs and lower demand for mortgage funds.
In the minerals and mining subsector, declines in real GDP of metallic (-3.7%) and non-metallic (-5.2%) minerals were partly offset by a rise in real GDP of coal (+5.6%). Metallic and non-metallic minerals' real GDP decreased, as a combination of maintenance and forest fires caused operations to close. The increase GDP of coal was partly due to higher rail carloadings and exports to South Korea.
The increase in real GDP of the energy subsector was attributable to an increase in services (+4.3%), but it was weakened by decreases in natural gas (-2.6%), refined petroleum products (-0.4%) and crude oil (-0.3%). Forest fires in Alberta caused many operations to slow or stop production, which impacted natural gas extraction and crude oil production.
Quarterly export and import volumes rise
Natural resources exports rose 0.5%, with increases in the minerals and mining (+3.2%) and energy (+0.1%) subsectors being offset by a decline in the forestry subsector (-4.7%). In the minerals and mining subsector, exports of unwrought gold posted large increases for both volumes and prices on high transfers of gold assets from Canadian financial institutions to the United States. Lower demand for primary sawmill and wood products contributed to the decrease in the forestry subsector.
Import volumes of the natural resources sector were up (+1.2%) in the second quarter. Import volumes of the minerals and mining subsector rose 12.0% largely due to primary metallic minerals products (+26.3%), notably unwrought gold, silver and platinum group metals from the United Kingdom. Import volumes of the energy subsector decreased 6.7%. Lower import volumes of refined petroleum products (-11.9%) were due to reduced gasoline inventories in the United States. Crude oil import volumes (-2.1%) were down, partly due to lower shipments from Saudi Arabia and the United States. These decreases were partially offset by an increase of natural gas import volumes (+5.2%). In the second quarter, import volumes decreased for the forestry subsector (-5.6%) due to primary pulp and paper product imports falling (-5.8%). Import volumes for the hunting, fishing and water subsector fell (-3.4%).
Natural resources' prices fall
Overall, natural resources' prices decreased 2.1% in the second quarter, while the GDP implicit price rose 0.7% in the second quarter, as consumer inflation remained elevated. Prices fell in the forestry (-5.6%), energy (-2.0%) and minerals and mining (-1.2%) subsectors in the second quarter. Primary pulp and paper products (-11.1%) led the decrease in the forestry subsector due to a slowdown in global demand (especially from China) and excess supply, which put downward pressure on prices. The fall in the minerals and mining subsector was mainly attributable to coal (-25.5%), and the decline in the energy subsector was heavily influenced by natural gas (-13.1%) and crude oil (-4.5%).
Natural resources' nominal GDP fell 2.6% in the second quarter to $315.6 billion at annual rates, representing 11.9% of the Canadian economy.
Employment increases
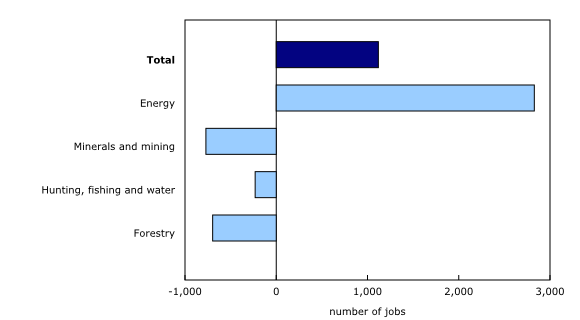
Employment in the natural resources sector rose 0.2% in the second quarter. The energy subsector (+2,800 jobs) recorded increases in employment, and the minerals and mining (-800), forestry (-700 jobs) and hunting, fishing and water (-200 jobs) subsectors recorded decreases.
Over half of total greenhouse gas emissions in Canada and nearly half of all energy use are associated with the natural resources sector
Also released today are new estimates that present the direct energy use and greenhouse gas (GHG) emissions associated with production in the natural resources sector and related downstream activities.
In 2019, the natural resources sector's share of total energy use in Canada was 44.1%, up from 42.7% in 2009, while its share of GHG emissions was 50.8% 2019, down from 51.9% in 2009. This reflects the fact that the ratio of GHG emissions to energy use dropped by over twice as much for the natural resources sector (-10.0%) as it did for Canada as a whole (-4.9%). The strong shift toward natural gas usage and away from coal for power generation was a significant contributor to these trends.
Within the natural resources sector, the energy subsector was responsible for a large majority of the energy use (70.1%) and GHG emissions (74.9%) in 2019. Oil and gas extraction was responsible for more energy use (38.5%) and GHG emissions (42.4%) than the forestry and minerals and mining subsectors combined. Since 2009, the oil and gas extraction subsector has decreased its ratio of GHG emissions to energy use by 15.0%, which is more than triple the rate of Canada as a whole. For oil and gas extraction, reduced fugitive emissions from the production and handling of fuels was responsible for the decreased ratio; the GHG intensity of energy use itself in the oil and gas extraction sector has not changed significantly.
These new data are the result of linking the Natural Resource Satellite Account with Statistics Canada's physical flow account on energy use and GHG emissions. This linkage is the fifth of a series undertaken in collaboration with the Canadian Centre for Energy Information.
Note to readers
Data on natural resources for the second quarter of 2023 have been released along with revised data from the first quarter of 2023.
The natural resource indicators provide quarterly indicators for the main aggregates in the Natural Resources Satellite Account (NRSA), namely gross domestic product, output, exports, imports and employment. The estimates from this account are directly comparable with the estimates in the Canadian System of Macroeconomic Accounts.
Comparisons of energy use and greenhouse gas emissions by the natural resources sector with Canada as a whole use "Total, industries and households" values from the Physical flows by final demand category table. The energy use and greenhouse gas emissions estimates are a subset of the physical flow accounts compiled by Statistics Canada in accordance with the United Nations' System of Environmental-Economic Accounting. The physical flow accounts differ from those published by Environment and Climate Change Canada in Canada's official national greenhouse gas inventory. A description of the differences between the two sources can be found on the Canadian Centre for Energy Information website. The estimates are part of a series of similar linkages undertaken in collaboration with the Canadian Centre for Energy Information.
Core natural resources: The NRSA defines natural resource activities as those that result in goods and services originating from naturally occurring assets used in economic activity, as well as their initial processing (primary manufacturing).
Downstream activities: Although not part of the core account, natural resources have important downstream effects on other sectors. In general, this production uses a large portion of primary manufactured products as inputs.
Employment estimates reported in this release align with the noted definitions of natural resource subsectors. Consequently, these estimates may differ from those release by the labour productivity program.
Next release
Data on natural resource indicators for the third quarter will be released on January 18, 2024.
Products
For more information on energy in Canada, including production, consumption, international trade and much more, please visit the Canadian Centre for Energy Information website and follow #energynews on social media.
The Economic accounts statistics portal, accessible from the Subjects module of the Statistics Canada website, features an up-to-date portrait of national and provincial economies and their structures.
Additional information can be found in the articles "The Natural Resources Satellite Account: Feasibility study" and "The Natural Resources Satellite Account – Sources and methods," which are part of the Income and Expenditure Accounts Technical Series (13-604-M).
The Latest Developments in the Canadian Economic Accounts (13-605-X) is available.
The User Guide: Canadian System of Macroeconomic Accounts (13-606-G) is available.
The Methodological Guide: Canadian System of Macroeconomic Accounts (13-607-X) is available.
Contact information
For more information, or to enquire about the concepts, methods or data quality of this release, contact us (toll-free 1-800-263-1136; 514-283-8300; infostats@statcan.gc.ca) or Media Relations (statcan.mediahotline-ligneinfomedias.statcan@statcan.gc.ca).
- Date modified:


