Jobs in Canada: Navigating changing local labour markets
Released: 2022-11-30
Over several decades, the Canadian labour force has been shaped by many long-term demographic and social trends. The aging of the baby boom generation has contributed directly to declines in the proportion of adults participating in the labour force, raising questions about the future supply of labour and living standards. Given the need to ensure that there are enough workers with the right skills to fill the spaces left by retirements, education has played an increasingly important role in shaping employment opportunities, especially for higher-paying jobs.
In parallel with population aging, several decades of changing social norms have contributed to a closing of the gap in the labour force participation of core-age (25 to 54 years) women and men. Similarly, labour force participation has increased for many diverse groups, including Indigenous people and racialized groups.
With a record number of Canadians approaching retirement age, governments and employers have relied on increased immigration levels to help address labour shortages now and in the future. Immigrants, for their part, have contributed their skills and talents to the labour market, while seeking to overcome barriers to full participation in society.
With these demographic and social changes as a backdrop, technological change, international competition and the COVID-19 pandemic have exposed the extent to which some groups of workers are positioned to benefit from the future of work and the opportunities of tomorrow, while others are more vulnerable to short-term economic downturns and long-term structural changes.
Today's release of the labour results from the 2021 Census—as well as releases on education, commuting and languages used at work—provides new insights into the jobs that Canadians do, and the extent to which securing a job increasingly requires formal education. These new census data also highlight how, in the face of population aging, the increasing diversity of Canada's labour force contributes to growth and prosperity. Finally, today's release illustrates how local circumstances are combining with social, economic and technological forces to shape labour market opportunities in communities across the country.
Data from the 2021 Census reflect labour market conditions as of May 2021. Previously released data from the Labour Force Survey (LFS) indicate that, by May 2021, the labour market had rebounded significantly since the first months of the pandemic beginning in March 2020. However, in May 2021, employment remained below its pre-pandemic level (-559,000 or -2.9%) and the unemployment rate stood at 8.0%, compared with its peak of 13.4% reached in May 2020.
Highlights
In the face of population aging and the COVID-19 pandemic, the number of health care workers increases by over 200,000 in five years to 1.5 million in 2021.
The construction industry, with over 1.3 million workers, continues to be an important employer for men working as labourers and in skilled trades.
Growth in professional, scientific and technical services employment outpaces that of all other industries, with 1.5 million employed in 2021.
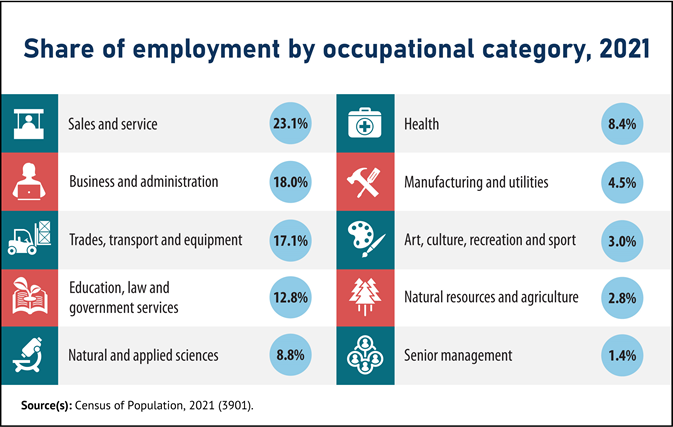
Four million Canadians are working in sales and service occupations.
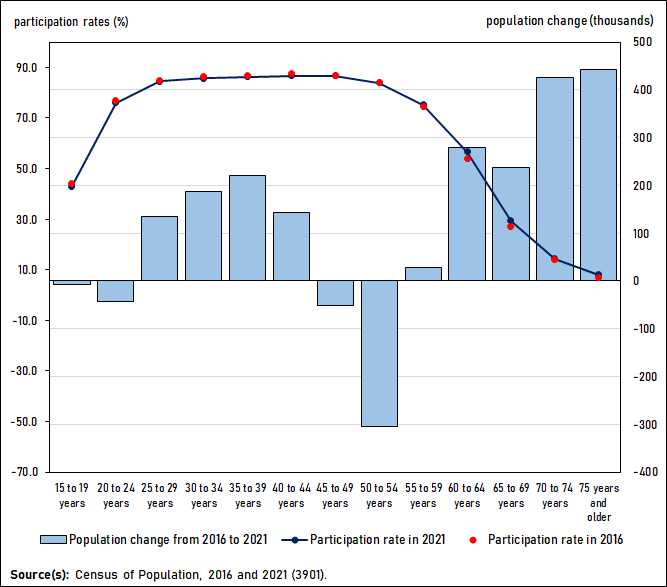
The participation rate fell from 65.2% in 2016 to 63.7% in 2021 as more baby boomers near or enter retirement age.
From 2016 to 2021, a record 1.3 million new immigrants came to Canada seeking opportunities, boosting labour market growth.
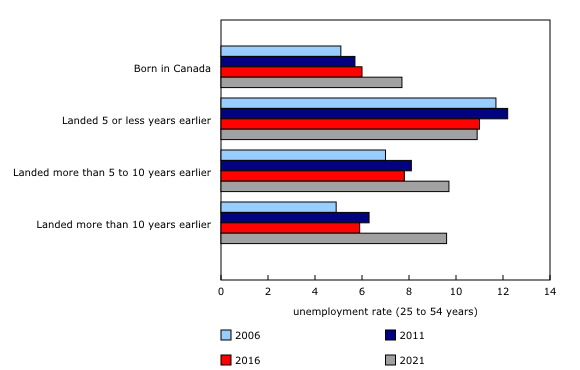
Recent immigrants in 2021 experienced lower unemployment rates than earlier cohorts.
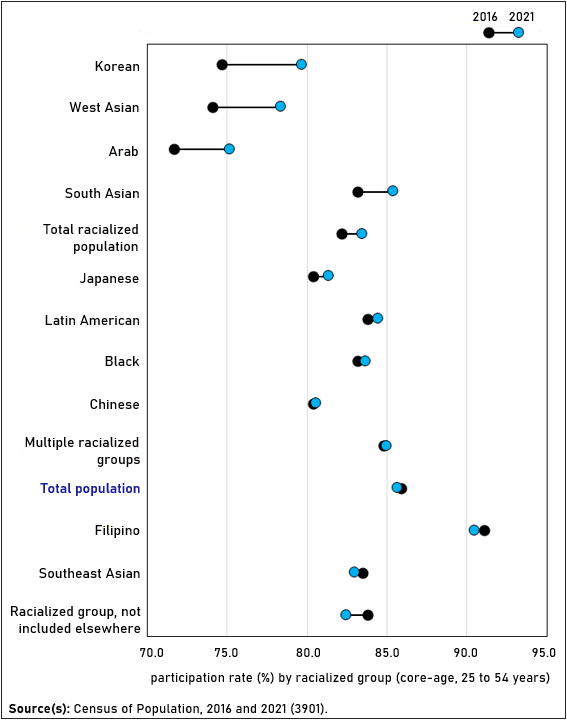
Participation rates increased from 2016 to 2021 for many racialized groups, with notable increases for Korean and West Asian Canadians.
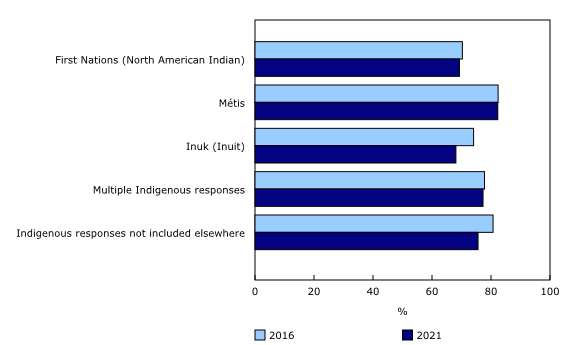
Participation rates declined for First Nations people and Inuit as their labour force growth lags behind their population increases.
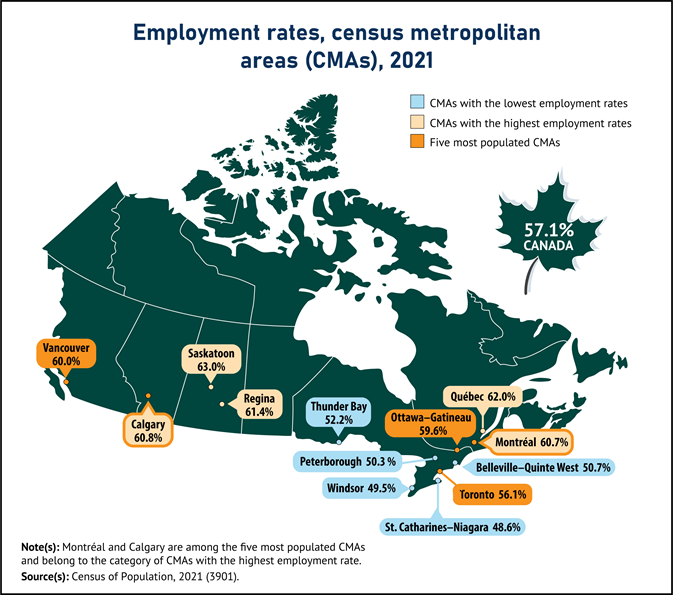
In Canada's biggest cities, employment rates in 2021 are highest among those in Quebec and the Prairies.
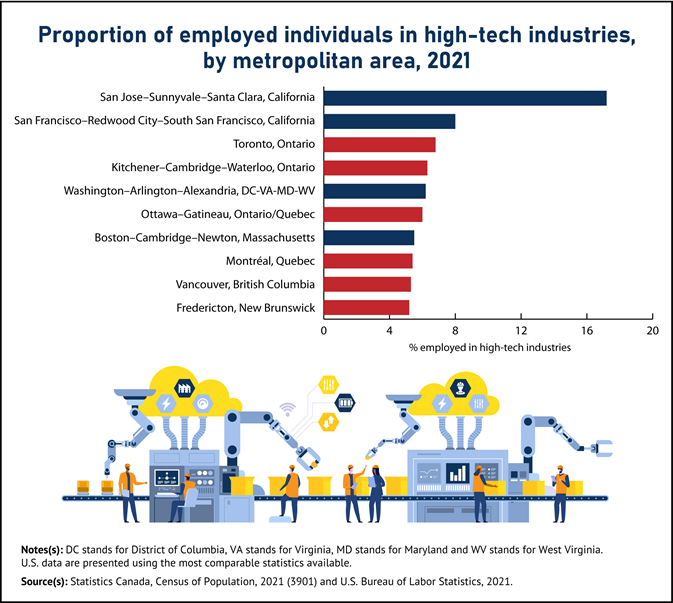
The information and communication technology sector is a key employer in six Canadian high-tech hubs, and employed more than 600,000 workers nationally in 2021.
In May 2021, there were 4.2 million people working at home, up from 1.3 million in 2016.
Working at home is most prominent in big cities and among people in professional occupations—with over 5% of teleworkers relocating from where they lived 12 months earlier.
Despite a record-high number and share of Canadians speaking a non-official language at home, English and French remained the languages of convergence in workplaces across the country as 98.7% of workers used one of these two languages most often at work. Overall, 77.1% of workers mainly used English at work, 19.9% mainly used French, and 1.7% used English and French equally.
Canada's labour market has tightened since May 2021
Since Census Day, the Canadian labour market has continued to evolve, with employment recovering to pre-pandemic levels by fall 2021. Labour market conditions continued to tighten into 2022, with an unprecedented number of job vacancies, peaking at 1.0 million in May 2022.
In addition, the summer of 2022 saw a record-low unemployment rate of 4.9%. At the same time, average wages have shown strong growth, rising by more than 5% on a year-over-year basis since summer 2022. However, this growth in average wages has not kept pace with inflation, which reached levels not seen since 1991.
Current and future job opportunities shaped by emerging industries and occupations
Strong employment growth in health care, professional and technical services, and construction
Since the turn of the 21st century, Canadian employment has been bolstered by sustained growth in three industries: healthcare and social assistance; construction; and professional, scientific and technical services. From 2001 to 2021, these sectors were collectively responsible for more than half of net employment growth and, as of September 2022, accounted for nearly one-third (30.4%) of all employment.
Other relatively large industries that each contributed more than 10% of net employment gains in Canada from 2001 to 2021 include educational services, retail trade, and public administration. In contrast, employment in both agriculture and manufacturing declined from 2001 to 2021.
Growth in these sectors is reflected in the jobs that Canadians were doing during the census reference week (between May 2 and May 8, 2021). Nearly 48,000 home support workers and caregivers were employed to care for Canadians in private homes in communities big and small. As well, 191,000 technical trades contractors and supervisors were working alongside 948,000 technical tradespeople to add to the country's infrastructure and housing stock. At the same time, more than 614,000 computer and information technology (IT) professionals, designers, programmers and technicians, 68,000 of whom were recent immigrants, were helping to support Canada's digital economy.
In the face of population aging and the pandemic, the number of health care workers increases by over 200,000 from 2016 to 2021
Driven by the health care needs of an aging population and the need to respond to the health impacts of the pandemic, the number of people working in non-management health occupations grew by 204,000 (+16.8%) from 2016 to 2021. In 2021, 80.1% of the nearly 1.5 million people working in health occupations were women, the same proportion as in 2016.
Despite high employment growth in these occupations, as of the summer of 2022, job vacancies for health occupations were at record highs and have increased steadily since Statistics Canada began collecting job vacancy data in 2015. One of the challenges involved in filling these vacancies is the extensive and specialized education required for many health occupations. In 2021, nearly half (45.6%) of non-management health care workers were in occupations requiring a bachelor's degree or higher, mainly in professional occupations, such as doctors and registered nurses. Another 22.8% of occupations required two or more years of college or some extended training (including technical occupations such as practical nurses, massage therapists and dental hygienists) and the remaining 31.6% of occupations usually required less than two years of college or some combination of short-term training programs for assisting occupations, such as nurse aides and orderlies.
As noted in the census release on education, the number of working-age people with a degree in health care rose by almost one-quarter (+24.1%) to 691,000 from 2016 to 2021, faster than the overall rise in the number of working-age people with a degree (+19.1%).
Nearly one-third (31.1%) of Canadians working in health occupations in May 2021 were members of a racialized population, compared with 26.5% of Canadians overall. Illustrating the important contribution of diverse groups to health care, nearly one in four (24.8%) general practitioners and family physicians were held by Chinese, Arab or South Asian Canadians. Meanwhile, Black Canadians accounted for 15.6% of those working as nurse aides, orderlies or patient service associates, and Filipino Canadians accounted for 14.6% of people working in these occupations.
The construction industry continues to be an important employer for men working as labourers and in skilled trades
Construction accounts for roughly 7.5% of Canada's gross domestic product, and the industry is vital to the creation and maintenance of Canada's built infrastructure, including housing, roads and bridges, and community centres. In 2021, there were just over 1.3 million people working in this industry, up from 1.2 million (+9.2%) in 2016.
The construction industry is an important source of employment for Canadians with varying levels of education. More than half (51.8% or 601,000) of the 1.1 million non-management occupations in construction were in occupations that required at least two years of apprenticeship or at least two years of college education. A further 22.3% were in positions that required some college education or specialized training or apprenticeship training of less than two years, while over one-fifth (22.1%) were in occupations that required either a high school diploma or no formal educational requirements.
Despite the construction sector having one of the highest job vacancy rates in 2022, today's census release on education has noted that the number of working-age apprenticeship holders has stagnated or fallen in three major trades fields—construction trades, mechanic and repair technologies, and precision production—in part because fewer young workers are replacing retiring baby boomers.
In 2021, the vast majority (86.3%) of people working in the construction industry were men, virtually the same as in 2016 (87.4%). Most men in construction worked in trades, transport and equipment operators and related occupations, notably as construction trades helpers and labourers (143,000), carpenters (128,000), technical trades contractors and supervisors (106,000), and electricians (74,000).
Of the 182,000 women working in the construction industry in 2021, one in four (25.0% or 46,000) were working in occupations related to trades, transport and equipment operators and related occupations, while more than half (53.9%) were working in business, finance and administration occupations—mostly as administrative officers, administrative assistants, accounting clerks and general office support workers.
Wide range of occupations contribute to employment growth in professional, scientific and technical services industry
From 2016 to 2021, the number of people working in professional, scientific and technical services grew to nearly 1.5 million (+219,000 or +17.3%), outpacing the rate of growth in all other industries. Men comprised 56.1% of employees in this industry, similar to what was seen in 2016 (55.4%).
Professional, scientific and technical services employed people in an array of occupations in 2021, including computer, software and web designers and developers (153,000); human resources and business service professionals (104,000); auditors, accountants and investment professionals (95,000); and lawyers and Quebec notaries (73,000). Emerging occupations in this industry included data scientists (5,000) and cybersecurity specialists (4,900).
In 2021, more than half (57.1%) of people employed in non-management jobs in professional, scientific and technical services were in an occupation requiring a bachelor's degree or higher, and nearly one-third (32.6%) required some level of college education or specialized training or apprenticeship training. At the same time, vacancies in the industry reached record highs by the end of 2021, indicating that there remains a strong demand for more of these educated professionals.
Four million Canadians working in sales and service occupations in 2021
During the third wave of the pandemic in the spring of 2021, employment in sales and service occupations were particularly affected by closures or reductions to customer capacity, and employees' ability to work at home was limited by the nature of the work. Still, 4 million Canadians were employed in sales and services occupations in May 2021, including 1.4 million in the retail trade industry and 783,000 in the accommodation and food services industry.
Sales and services occupations accounted for nearly one-quarter (23.1%) of employment in May 2021, the largest share of total employment among all industries. This proportion was higher for all racialized groups than for the population as a whole, with the highest proportion being among Korean (35.8%), Southeast Asian (32.2%) and Filipino (30.7%) Canadians.
Of the nearly 3.4 million Canadians working in non-management sales and service occupations in May 2021, 42.1% or just over 1.4 million were in occupations that did not have any formal educational requirements, including sales support occupations (557,000), food support occupations (409,000) and cleaners (370,000).
For many young people, sales and services occupations are an important source of opportunities to enter the labour force and gain work experience. Among youth aged 15 to 24 who were employed in May 2021, just under half worked in sales and services jobs (48.1% or 977,000). Most commonly, these were cashier and other sales support occupations (284,000) or food support occupations (211,000). More than half (54.3%) of young women worked in sales and services, compared with just over 4 in 10 (42.3%) young men.
Occupations requiring a high school education or no formal training hit hardest by the pandemic
In any given year, some workers may be employed for the entire year, while others work part of the year, either because they spend some weeks studying, taking care of family members or pursuing other activities, or because they experience periods of unemployment. In 2020, during the initial phases of the pandemic, vulnerability to periods of job loss varied across occupations, with some jobs being more protected than others, based on factors including whether the job contributed to an essential service and whether it could be done at home.
Many Canadians aged 25 to 54 working in occupations that usually require no formal education—such as those in sales support; food, accommodation and tourism support; and cleaning and related services—were particularly hard hit by temporary business closures during the pandemic. This is reflected in the proportion of these 562,000 workers (54.7%) that worked for at least 49 weeks in 2020.
In comparison, 64.9% of the 904,000 Canadians in jobs requiring a high school diploma in May 2021, and 78.6% of the 2.08 million in professional jobs typically requiring a university degree, worked the full year in 2020.
Population aging continues to put pressure on current and future labour supply
Long-term decline in labour force participation continues as more baby boomers near or enter retirement
While the size of the labour force grew from 2016 to 2021 (+638,000 or +3.4%), the labour force participation rate—or the proportion of people aged 15 and older who are employed or unemployed—dropped from 65.2% to 63.7%.
The overall labour force participation rate has fallen at each census since 2006, driven by the aging of the baby boom generation. This trend continued from 2016 to 2021, with the entry of more than 1.4 million (+13.7%) Canadians into the ranks of those aged 55 and older. Although the participation rates of each five-year age group from 55 to 74 increased from 2016 to 2021, they remained substantially lower than the rates of those aged 25 to 54 and were not sufficient to offset the downward pressure on labour supply resulting from population aging.
As reported in the April 27, 2022, census release on Canada's shifting demographic profile, a record number of working-age Canadians (21.8%) are close to retirement, that is, they are aged 55 to 64. This means proportionally fewer people working, and this can have broader implications for Canadian living standards.
Given the importance of demographic changes to economic growth, there will be continued focus on the extent to which immigration can mitigate the effects of population aging. To help inform this question, Statistics Canada produces population projections, including projections of future labour force participation, using a range of assumptions and scenarios about future birth rates, immigration levels and participation rates, among other things. For all sets of assumptions about future immigration levels—including assumptions close to recently observed levels—the overall participation rate is projected to continue to decrease until at least 2036, largely the result of the aging of the baby boom cohort.
Record number of new immigrants come to Canada to seek opportunities, boosting labour market growth from 2016 to 2021
While immigration cannot fully offset the effects of population aging, it is an important source of talent for Canada's labour force.
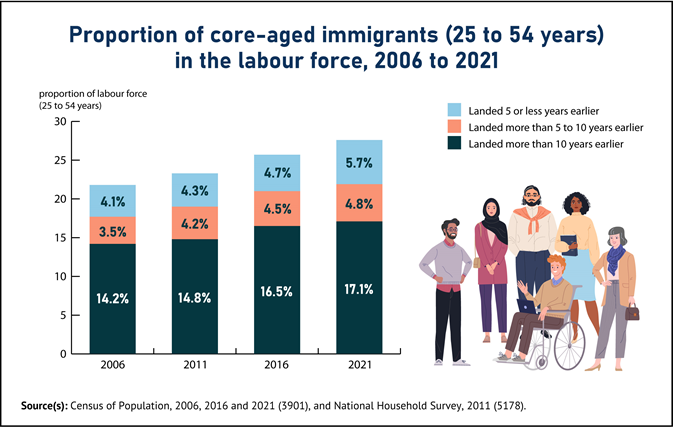
Over 1.3 million new immigrants were admitted to Canada from 2016 to 2021, more than during any previous five-year period. Just over 1.1 million new immigrants were aged 15 and older. These new arrivals, along with previous immigrant cohorts, accounted for more than one-quarter (27.7%) of the core-age labour force in 2021, up from 25.7% in 2016. Immigrants in this age group who landed five years earlier or less comprised 5.7% of the labour force in 2021, up from 4.7% in 2016.
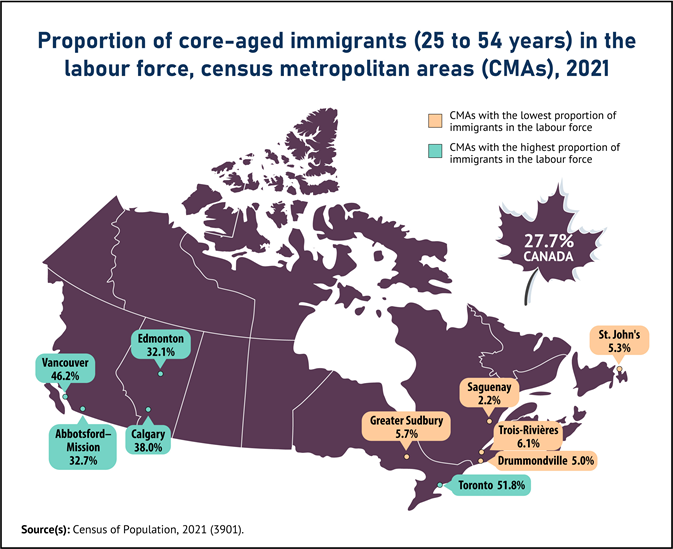
Immigrants play a large role in the labour market across the country. In Ontario, 34.2% of the core-age labour force are immigrants, the highest proportion of all provinces and territories, followed by British Columbia at 33.1%. Among census metropolitan areas (CMAs, defined as urban centres of 100,000 or more people) more than half (51.9%) of Toronto's core-age labour force are immigrants, and 46.2% of Vancouver's labour force aged 25 to 54 are also immigrants. Illustrating their importance to labour markets across the country, including outside the largest cities, immigrants aged 25 to 54 made up 48.7% of the core-aged labour force in Brooks, Alberta, and 13.3% in Charlottetown, Prince Edward Island.
In May 2021, immigrants were making an important contribution to employment in all industries and sectors. For example, immigrants aged 25 to 54 accounted for 36.3% of all core-aged employment in accommodation and food services; 37.8% of those in transportation and warehousing; 34.1% of those working in professional, scientific and technical services; and 20.1% of those aged 25 to 54 employed in construction.
Recent immigrants have lower unemployment rates than earlier cohorts
While immigration represents an important source of labour supply, especially in the context of population aging, workers arriving in Canada often face a period of adjustment, and employers may face challenges in fully using the talents and skills that immigrants offer. Due in part to these challenges, recent immigrants—those who landed in the five years before the census—typically have higher unemployment rates than those who have been in Canada longer or people who were born in Canada.
While new immigrants continue to face these challenges, the gap between the unemployment rate of recent immigrants and other workers was smaller in 2021 than in 2016. For example, among those aged 25 to 54, recent immigrants had an unemployment rate of 10.9% in May 2021, while the rate for non-immigrants was 7.7%, a gap of 3.2 percentage points. In comparison, the equivalent gap in 2016 was 5.0 percentage points (unemployment rate of 11.0% for recent immigrants and 6.0% for non-immigrants).
Besides experiencing unemployment rates that were more like those of non-immigrants in 2021 than of non-immigrants in 2016, core-age immigrants who landed from 2016 to 2021 were more likely than the previous five-year cohort to be employed in industries with above-average hourly wages. These industries included professional, scientific and technical services (15.3% of 2016-to-2021 immigrants, compared with 10.3% of 2011-to-2016 immigrants); finance and insurance (7.4%, compared with 5.1%); and transportation and warehousing (7.3% vs. 5.0%).
Many factors can contribute to changes in the labour market integration of immigrants. For example, as noted in the census release on education, those who gained permanent residency from 2016 to 2021 were more highly educated than any previous cohort, with nearly 6 in 10 holding a bachelor's degree or higher. In addition, analysis from the census release on immigration shows that more than one-third of recent immigrants first came to Canada temporarily before seeking permanent residence, compared with 17.9% among longer-term immigrants. The vast majority (77.3%) of recent immigrants with this pre-admission experience had a temporary work permit. Working in Canada before becoming a permanent resident has been shown to be a factor in improving labour market outcomes.
Labour force participation bolstered by increases among some racialized groups
Members of racialized groups face many barriers to achieving equity in the labour market, and the labour force participation rate of all racialized groups has traditionally been lower than the overall rate. In the context of population aging and the associated downward pressure on the overall labour force participation rate, census data, combined with monthly data from the LFS, provide insights into differences in participation rates within and between diverse groups of Canadians.
From 2016 to 2021, among Canadians who are aged 25 to 54 and who are members of a racialized group, the labour force participation rate increased by 1.2 percentage points (from 82.2% to 83.4%), compared with a 0.3 percentage point decline (to 85.6%) for the total population aged 25 to 54. The largest increase was among core-aged Korean Canadians (+4.9 percentage points to 79.6%), followed by West Asian Canadians (+4.2 percentage points to 78.3%). The participation rate increased for both South Asian (+2.1 percentage points to 85.3%) and Latin American (+0.6 percentage points to 84.4%) Canadians, bringing the rate of both groups to a level similar to the overall rate (85.6%).
In Canada, more than one-quarter (26.5%) of those who were employed in May 2021 were members of a racialized group, with the proportion being more than one-half (55.5% or 1.6 million) in the CMA of Toronto. Of all racialized groups, South Asian Canadians accounted for the largest share of Toronto's employment (19.6% or 569,000). In the CMA of Vancouver, 52.7% (707,000) of the employed were members of a racialized group, with Chinese Canadians (16.7% or 224,000) being the largest group.
Participation rates decline for First Nations people and Inuit as their labour force growth lags behind their population increases
As mentioned in the census release on education, the proportion of Indigenous people completing high school and earning a bachelor's degree is increasing, even if the pace of growth in earning a bachelor's degree is slower for First Nations people, Métis and Inuit than for the non-Indigenous population. As population aging puts downward pressure on labour supply, maximizing the skills and talent of Indigenous people has been identified by governments and employers as an important component of ensuring future prosperity and a more equitable labour market.
Employment among First Nations people aged 25 to 54 grew by over 13,000 from 2016 to 2021, mostly in health care and social assistance and public administration. Despite this growth, the labour force participation rate for this group dropped 1.0 percentage point (from 70.3% to 69.3%) over the same five-year period. This was because of, in part, employment not keeping pace with population growth as the number of core-aged First Nations people increased 6.0% from 2016 to 2021, faster than their 4.5% employment growth.
For Inuit aged 25 to 54, the participation rate fell from 74.1% in 2016 to 68.0% in 2021, as a decline in the number of Inuit working or looking for work in this age group (-250 or -1.4%) was countered by their strong population growth (+1,800 or +7.4%).
Among Métis aged 25 to 54, the participation rate was 82.3% in 2021, unchanged from 2016 (82.4%), as the number of core-aged Métis working or looking for work increased (+4,100 or +2.1%) at much the same pace as the population of this group (+5,000 or +2.2%).
Canada's regions and communities face diverse labour market opportunities and challenges
Local labour market conditions are shaped by factors including demographics, immigration, diversity and industry growth
Across CMAs, employment rates in May 2021 varied from as high as 63.0% in Saskatoon and 62.0% in Québec to as low as 48.6% in St. Catharines–Niagara and 49.5% in Windsor. Similarly, among census agglomerations (urban centres with at least 10,000 people but fewer than 100,000 people), the employment rate in May 2021 varied from as high as 74.5% in Yellowknife to as low as 29.4% in Elliott Lake, one of the most popular retirement communities in Ontario.
The extent to which labour market indicators vary from one local community to another reflects the complex ways in which local circumstances, opportunities and challenges combine with the same factors that shape the national labour market, including population aging, immigration, increasing diversity and inclusion, and differences in employment growth across sectors.
Information and communications technology is a key employer in six Canadian high-tech hubs, employing a total of more than 600,000 workers
In recent years, advancements in the digital economy have fundamentally changed how people and businesses interact, resulting in rapid transformations in the way we communicate and expanding the ways in which goods and services are produced and distributed. The information and communications technology (ICT) sector is a grouping of industries that are central to the growth of the digital economy, including computer systems design and related services, software publishers, and semiconductor and other electronic component manufacturing. ICT employment includes Canadians working as software engineers and developers, information system professionals, and graphic designers.
Across Canada, employment in the ICT sector grew by more than one-fifth (+20.2% or +113,000) from 2016 to 2021, and, as of May 2021, 673,000 Canadians were working in the sector, representing 3.9% of total employment, up from 3.3% in 2016. Illustrating the importance of this growing sector, ICT accounted for a larger proportion of total employment in May 2021 than agriculture (2.3%) and natural resources (1.3%) combined.
While immigrants play a key role in many industries, the global market for skills and talent is particularly notable for the ICT sector. More than one-third (38.9%) of those employed in ICT in May 2021 were immigrants, compared with an average of over one-quarter (25.5%) for all industries. Over half (54.8% or 62,000) of the growth in this sector from 2016 to 2021 was among immigrants.
The ICT sector plays a particularly important role in many local labour markets across Canada. Among the 10 North American tech hubs—areas where the ICT sector accounted for the highest proportion of employment in 2021—6 were in Canada, including the CMAs of Toronto (6.8%), Kitchener–Cambridge–Waterloo (6.3%), Ottawa–Gatineau (6.0%), Montréal (5.4%), Vancouver (5.3%) and Fredericton (5.2%).
For some, working at home creates new opportunities to work outside big cities
One of the most notable labour market impacts of the pandemic has been a shift to working at home, and this has highlighted a range of issues, including the ability to quickly transform offices and workplaces using technology. In addition, working at home has helped to highlight differences in aspects of the quality of employment—including the ability to balance work-life responsibilities—across occupations and diverse groups.
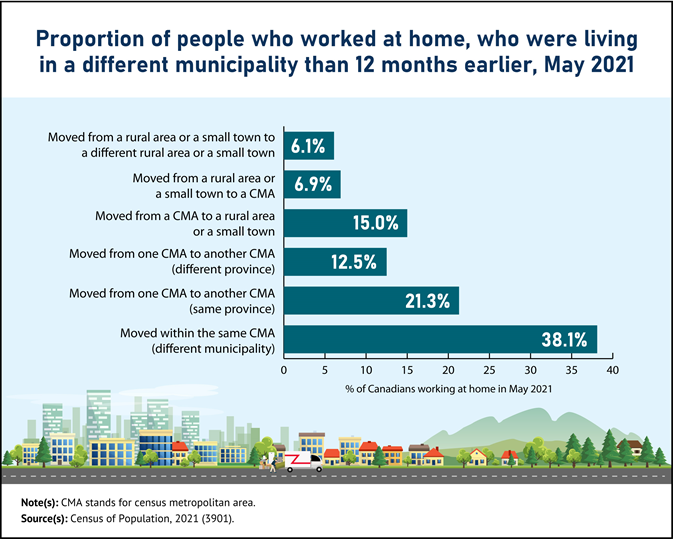
In May 2021, 4.2 million people were working from home, up from 1.3 million in 2016. Among those, about 1 in 20 (5.3% or 221,000) were living in a different municipality than 12 months earlier. More than one-third (38.1%, or 85,000) of those who moved were living in a different municipality within the same CMA, while 15.0% or 33,000 had moved from a CMA to a small town or a rural area. While Canadians move from one municipality to another for many reasons—and previously released data from May 2021 show that 12.2% of all Canadians had moved from their residence of 12 months earlier—some of those who moved may have seen working at home as an opportunity to relocate.
As of May 2021, there were nearly 16,000 at-home workers who had been living in the CMA of Toronto 12 months earlier and at the time of the census were living in Hamilton, Oshawa, Kitchener–Waterloo–Cambridge, Barrie, or Ottawa–Gatineau. In addition, some former Torontonians were working at home and living in the CMAs of Vancouver (2,000), Montréal (1,500), Calgary (700) and Halifax (700).
Two provinces—British Columbia (+5,200) and Nova Scotia (+2,100)—had a net gain in the number of people working at home in May 2021 who lived in a different province 12 months earlier. Meanwhile, Ontario (-6,300) and Alberta (-2,200) had net declines.
Despite increasing linguistic diversity in households, English and French remain the languages used at work by the overwhelming majority of workers
More detailed results related to language of work—including analyses of trends over time and of differences between various groups of workers and types of jobs, for selected regions—can be found in the article "Speaking of work: Languages of work across Canada" in the Census in Brief series.
While the number and proportion of Canadians using a non-official language at home reached a new high in 2021, English and French remained the languages of convergence in workplaces across Canada, as one or both languages were used by most workers.
Among workers who were employed between May 2 and May 8, 2021 (census reference week), the vast majority (98.7%) used English or French most often at work. In contrast, 87.7% of these workers used English or French most often at home.
The use of these two languages at work varied greatly across the country.
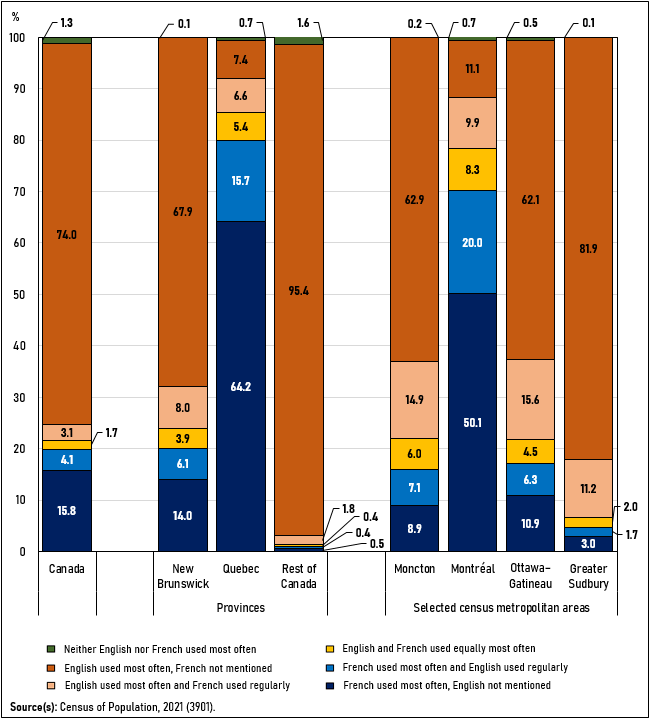
Four in five (79.9%) workers residing in Quebec mainly used French at work and 14.0% mainly used English. Additionally, 5.4% of workers declared that they used both English and French equally; the rest (0.7%) used neither French nor English most often. English–French bilingualism at work was frequent in Quebec, as 27.8% of workers said they used both languages on a regular basis at work. In total, 92.1% of workers used French on a regular basis, and 35.4% used English on a regular basis.
In the Montréal CMA, which in 2021 accounted for about half (51.6%) of Quebec's workforce, 70.0% of workers mainly used French, 21.0% mainly used English, and an additional 8.3% said they used French and English equally. There were 38.3% of workers who used both French and English on a regular basis.
In New Brunswick, 20.1% of workers used mainly French at work, 75.9% mainly used English, and 3.9% used French and English equally. There were 18.0% of workers who used both English and French at work on a regular basis. In Moncton, New Brunswick's largest metropolitan area and an important area of contact between French- and English-speaking populations in the province, 28.0% of workers used both languages on a regular basis.
Outside of Quebec and New Brunswick, English was generally the predominant language of work, as 92.6% of workers only used English at work and 98.7% used it at least on a regular basis. The use of multiple languages at work was also less frequent: 6.1% of workers used more than one language at work on a regular basis (mostly English and a non-official language) compared with 18.6% in New Brunswick and 28.7% in Quebec (mostly French and English).
However, some areas outside Quebec and New Brunswick stand out for the wider presence of French in their workplaces. For instance, the areas where the proportion of workers using French at least regularly at work was highest in the counties of Digby (29.3% of workers) and Yarmouth (14.0%) in southern Nova Scotia; in the counties of Prescott and Russell (63.1%) and Stormont, Dundas and Glengarry (23.4%) and in the city of Ottawa (23.4%) in eastern Ontario; and in the districts of Cochrane (37.5%) and Timiskaming (20.9%) and in the city of Greater Sudbury (17.8%) in Northern Ontario.
Beyond English and French, the languages used at least regularly at work by the largest number of workers in Canada were Mandarin (about 130,000 people), Punjabi (102,000), Yue (Cantonese) (83,000) and Spanish (81,000).
Across Canada, 39,600 workers used an Indigenous language at work on a regular basis. Cree languages were the most prevalent of those languages, used regularly by 12,900 workers, mostly in Quebec and the Prairie provinces. Inuktitut and other Inuit languages followed, used by 9,900 workers, mostly in Nunavut and in Nunavik, in northern Quebec. In Nunavut, 42.8% of workers used an Inuit language at work regularly; in Nunavik, 77.2% of workers did.
A better portrait of languages used at work, but an effect on comparability with previous census cycles
In 2021, the language of work question in the census was modified, which reduced respondents' burden and increased the quality of the data. However, this affects the comparability of data with previous cycles. Comparisons of data regarding the language used most often at work should be made with some caution, whereas data regarding the other languages used regularly at work should not be compared with previous cycles.
Readers interested in trends regarding language of work in different regions are invited to consult the "Speaking of work: Languages of work across Canada" article in the Census in Brief series.
Looking ahead
In the coming months and years, Statistics Canada will continue to provide Canadians with the insights needed to understand labour market and economic conditions, using the richness of 2021 Census data—which is unique in its geographic and sociodemographic detail—and a suite of ongoing labour surveys, including the LFS; the Survey of Employment, Payrolls and Hours; and the Job Vacancy and Wage Survey.
Note to readers
We encourage you to download the StatsCAN app to consult the census results.
Definitions, concepts and geography
All the results presented in this release are based on 2021 geographic boundaries.
In this release, a census metropolitan area is an urban centre with 100,000 or more people. A census agglomeration is an urban centre with at least 10,000 people but fewer than 100,000 people.
In this release, the term "municipality" refers to a census subdivision.
The term "Canadians" refers to residents of Canada, regardless of citizenship status.
The term "Recent immigrant" refers to an immigrant who first obtained his or her landed immigrant or permanent resident status in the five years prior to a given census.
In this report, persons who "mainly" used English or French at work are those who used only one of these two languages most often at work. It excludes people who said that they used English and French equally but includes those who used English or French equally with a non-official language.
Comparability between the National Occupational Classification 2021 V1.0 and the National Occupational Classification 2016 V1.3
The publication of the National Occupational Classification (NOC) 2021 Version 1.0 introduces a major structural change. The NOC 2021 Version 1.0 overhauls the "Skill Level" structure by introducing a new categorization representing the degree of Training, Education, Experience and Responsibilities (TEER) required for an occupation. The NOC 2021 Version 1.0 also introduces a new 5-digit hierarchical structure, compared with a 4-digit hierarchical structure in the previous versions of the classification. For more information on TEER, please consult Variant of the National Occupational Classification (NOC) 2021 Version 1.0 for Analysis by TEER (Training, Education, Experience and Responsibility) categories.
Changes between the publications of the NOC 2016 Version 1.3 and NOC 2021 Version 1.0 occurred at all levels of the NOC structure. Some items were revised while others were added, split, transferred or merged. For a complete list of all changes detailed at the unit group level (the most detailed level of the NOC structure) please consult the Correspondence Table: National Occupational Classification (NOC) 2016 V1.3 to National Occupational Classification (NOC) 2021 V1.0 based on GSIM.
For a detailed definition of the concepts related to labour, language of work or to census geography, please consult the Census Dictionary or see the conceptual videos.
2021 Census of Population products and releases
Today, Statistics Canada is releasing a seventh set of results from the 2021 Census of Population.
Several 2021 Census products are now available on the 2021 Census Program web module. This web module has been designed to provide easy access to census data, free of charge.
The analytical products include an article in The Daily and an article in the Census in Brief series.
Additional Census in Brief articles will be released in the coming months.
The data products include results on labour and language of work, for many standardized geographic regions, and are available through the Census Profile, Highlight tables and data tables.
The Focus on Geography series provides data and highlights on key topics in this Daily release at various levels of geography.
The reference materials are designed to help users make the most of census data. They include the Guide to the Census of Population, 2021, the Dictionary, Census of Population, 2021, the 2021 Census of Population questionnaires and the 2021 Census Data Quality Guidelines. The dictionary, reference guides and data quality guidelines are updated based on new information throughout the release cycle. The Labour Reference Guide, Census of Population, 2021 and Languages Reference Guide, Census of Population, 2021 are also available.
Geographic products and services related to the 2021 Census Program can be found under Census geography. This includes GeoSearch, an interactive mapping tool, and thematic maps, which show data for various standard geographic areas, along with the Focus on Geography Series and the Census Program Data Viewer, which are data visualization tools.
The following article in the Census in Brief series, Speaking of work: Languages of work across Canada, is also available.
Videos on census concepts can be viewed in the Census learning centre.
November 30, 2022, marks the final major release from the 2021 Census of Population. Please see the 2021 Census release schedule for a full list of the topics that have already been released.
Contact information
For more information, or to enquire about the concepts, methods or data quality of this release, contact us (toll-free 1-800-263-1136; 514-283-8300; infostats@statcan.gc.ca) or Media Relations (statcan.mediahotline-ligneinfomedias.statcan@statcan.gc.ca).
- Date modified:

