
Infographic 2
Participation rates increase across all older age groups
Infographic description
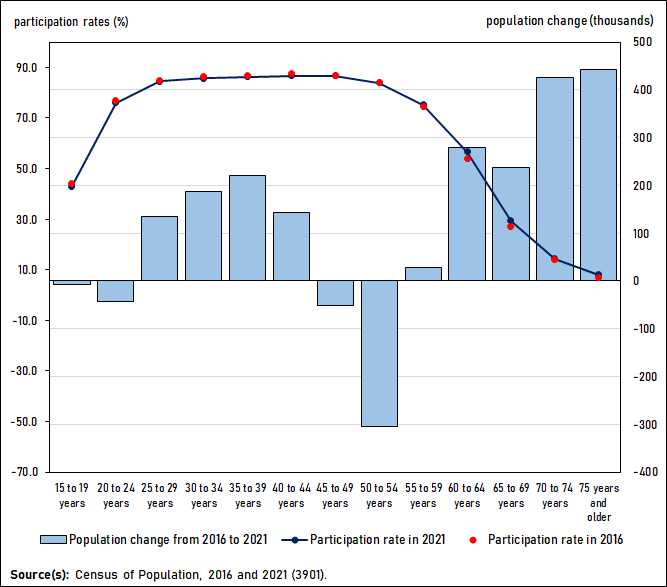
The title of the infographic is "Participation rates increase across all older age groups"
This is a combination bar, line and dot plot chart showing the population change from 2016 to 2021 and the labour force participation rate in 2016 and 2021, by five-year age groups.
The vertical axis on the left shows the participation rate, from -70.0% to 90.0%, by increments of 20.0%.
The vertical axis on the right shows the population change, in thousands, from -400 to 500, by increments of 100.
The horizontal axis shows the following age groups: 15 to 19 years, 20 to 24 years, 25 to 29 years, 30 to 34 years, 35 to 39 years, 40 to 44 years, 45 to 49 years, 50 to 54 years, 55 to 59 years, 60 to 64 years, 65 to 69 years, 70 to 74 years and 75 years and older.
The set of bars show the following population changes from 2016 to 2021: a decrease of 7,000 in 15- to 19-year-olds, a decrease of 44,000 in 20- to 24-year-olds, an increase of 134,000 in 25- to 29-year-olds, an increase of 188,000 in 30- to 34-year-olds, an increase of 221,000 in 35- to 39-year-olds, an increase of 144,000 in 40- to 44-year-olds, a decrease of 52,000 in 45- to 49-year-olds, a decrease of 305,000 in 50- to 54-year-olds, an increase of 28,000 in 55- to 59-year-olds, an increase of 279,000 in 60- to 64-year-olds, an increase of 237,000 in 65- to 69-year-olds, an increase of 427,000 in 70- to 74-year-olds, and an increase of 443,000 in those aged 75 years and older.
The line shows the following participation rates in 2016: 44.2% for the 15- to 19-year-olds, 77.0% for the 20- to 24-year-olds, 84.9% for the 25- to 29-year-olds, 86.2% for the 30- to 34-year-olds, 86.6% for the 35- to 39-year-olds, 87.4% for the 40- to 44-year-olds, 86.7% for the 45- to 49-year-olds, 84.1% for the 50- to 54-year-olds, 74.6% for the 55- to 59-year-olds, 54.1% for the 60- to 64-year-olds, 27.1% for the 65- to 69-year-olds, 13.9% for the 70- to 74-year-olds and 7.0% for those aged 75 years and older.
The dots show the following participation rates in 2021: 43.1% for the 15- to 19-year-olds, 76.1% for the 20- to 24-year-olds, 84.5% for the 25- to 29-year-olds, 85.7% for the 30- to 34-year-olds, 86.2% for the 35- to 39-year-olds, 86.7% for the 40- to 44-year-olds, 86.6% for the 45- to 49-year-olds, 84.0% for the 50- to 54-year-olds, 75.3% for the 55- to 59-year-olds, 56.6% for the 60- to 64-year-olds, 29.3% for the 65- to 69-year-olds, 14.4% for the 70- to 74-year-olds and 8.0% for those aged 75 years and older.
Source(s): Census of Population, 2016 and 2021 (3901).
- Date modified: