
Economic and Social Reports
Job security in the age of artificial intelligence and potential pandemics

Archived Content
Information identified as archived is provided for reference, research or recordkeeping purposes. It is not subject to the Government of Canada Web Standards and has not been altered or updated since it was archived. Please "contact us" to request a format other than those available.
by Marc Frenette and René Morissette
Skip to text
DOI: https://doi.org/10.25318/36280001202100600004-eng
Text begins
Abstract
Recent advances in artificial intelligence and robotics have led to a higher risk of job loss or job transformation among certain groups of workers. Moreover, the COVID-19 pandemic has shown that workers whose job can be done from home, involves sufficient physical distancing, or is deemed essential by authorities enjoy greater job security than other workers during a lockdown. In light of these two developments, it is important to identify which groups of Canadian workers might enjoy the highest or lowest level of job security in upcoming years.
To do so, this study develops a forward-looking measure of job security. Specifically, it estimates the proportion of Canadian employees who hold ‘triple-protected’ jobs, or jobs that (a) have no predetermined end date; (b) have a low risk of being lost or transformed due to automation; and (c) are resilient to pandemics. This measure uses Statistics Canada’s 2019 Labour Force Survey (LFS) as the baseline sample, which is augmented with data from Statistics Canada’s 2016 Longitudinal and International Study of Adults (LISA) and the Occupational Information Network (O*NET, version 17.0) from the U.S. Bureau of Labor Statistics. This study shows that two in five employees held a triple-protected job in Canada in 2019, prior to the COVID-19 pandemic. However, such jobs were unequally distributed across workers, families, and regions. Highly educated and high-wage workers were most likely to hold triple-protected jobs. Likewise, highly educated dual-earner couples and dual-earner couples in the top decile of the earnings distribution were far more likely to have triple-protected jobs for both spouses than other dual-earner couples. In fact, the disparities in triple-protected jobs by education and earnings were larger among dual-earner couples than among individuals. Finally, couples living in economic regions with large cities were far more likely to enjoy relatively high levels of job security than those living in small towns and rural areas. Taken together, these findings suggest that further developments in artificial intelligence and potential pandemics in the future may exacerbate family income inequality.
Authors
Marc Frenette and René Morissette are with the Social Analysis and Modelling Division, Analytical Studies Branch, at Statistics Canada.
Introduction
Job security is a key component of workers’ well-being. One approach to measuring job security distinguishes permanent jobs—jobs with no predetermined end date—from temporary jobs (e.g., work that is seasonal, term or contract, casual, through a temporary employment agency, or otherwise has a predetermined end date) (Galarneau 2005) or from gig employment (Jeon et al. 2019).
An alternative approach acknowledges the fact that all types of jobs—permanent, temporary, gig employment—can potentially be terminated through layoffs or the termination of contracts/work arrangements. This approach focuses on the following three components: (a) the likelihood of losing one’s job; (b) the loss in earnings experienced following job loss; (c) the likelihood of experiencing substantial wage cuts while remaining employed in a given firm (Nickell, Jones and Quintini 2002).
Previous research has shown that neither the likelihood of job loss nor the short-term loss in earnings experienced after layoffs have increased in Canada since the late 1970s (Morissette, Qiu and Chan 2013; Morissette and Qiu 2020). Furthermore, the share of the paid workforce employed in a temporary job remained relatively stable during the 2000s and 2010s, achieving a high of 13.7% in 2017 and a low of 12.3% in 2008 (Statistics Canada n.d.). However, two recent developments could raise concerns about the evolution of job security in forthcoming years: significant advances in artificial intelligence and the COVID-19 pandemic.
Recent developments in artificial intelligence and robotics have raised concerns about job security in the future (Brynjolfsson and McAfee 2014). The technology that enables robots or computer algorithms to perform tasks traditionally accomplished by humans has existed for quite some time, but was often expensive. However, advances in computing power and the development of new computer applications are likely to make such technology less costly in the long run. While automation has been increasingly embraced by the manufacturing sector,Note the tasks performed by workers in the economy as a whole have been gradually changing over the last three decades, in a manner consistent with increased adoption of automation technology—away from routine, manual tasks and toward non-routine, cognitive tasks (Frank, Yang and Frenette 2021). However, the COVID-19 pandemic and subsequent lockdown and reorganization of many businesses have provided firms with another incentive to invest in automation: making the production and delivery of goods and services more resilient in the event of future pandemics or other natural or unnatural disasters that call for a lockdown. As a result, employees with jobs that lend themselves less to automation may face a lower risk of job loss or transformation than other workers in forthcoming years
Of course, the COVID-19 pandemic has had far more direct and immediate consequences on job security. The pandemic has taught the world a lot about the risk of job loss during a lockdown. Workers who had the highest level of job security during the pandemic included those whose job could be done from home,Note involved sufficient physical distancing, or was deemed essential by authorities. Jobs with one or more of these characteristics may therefore be resilient to potential future pandemics and associated lockdowns.Note
Previous research has shown that several of these aspects of job security are unequally distributed. For example, highly educated and high-wage workers are more likely than other workers to hold jobs that can be done from home (Messacar, Morissette and Deng 2020) and that are less vulnerable to automation (Frenette and Frank 2020). Highly educated workers are also generally less likely to lose their job than their less-educated counterparts (Morissette and Qiu 2020). However, the evidence surrounding temporary jobs is less clear. While workers in temporary jobs earn less per hour than those in permanent jobs (Statistics Canada 2018), earlier research has revealed that the relationship between educational attainment and the likelihood that a job is temporary follows a U-shaped pattern, and is highest among workers with no high school diploma or university degree (Galarneau 2005).
Given the recent advances in artificial intelligence and the possibility of future pandemics,Note it is important to assess the groups of Canadian workers for which job security might be the highest (or the lowest) in forthcoming years. The goal of this study is to inform this issue by developing a forward-looking measure of job security. Specifically, it will estimate the proportion of Canadian employeesNote who hold ‘triple-protected’ jobs, i.e., jobs that (a) have no predetermined end date; (b) have a low risk of being lost or transformed due to automation; and (c) are resilient to pandemics.Note It also quantifies the proportion of employees who hold ‘single-protected’ and ‘double-protected’ jobs, i.e., jobs that have one or two of the three aforementioned layers of job protection, respectively. Results are shown for individuals as well as dual-earner couples.Note
It should be emphasized that the study attaches no weight, either in likelihood (probability of job loss) or in importance (loss of earnings conditional on job loss), to any of the three components of job security listed above. The goal is to simply highlight three important dimensions of job security and to estimate the proportion of workers employed in a job with none, one, two, or three of these dimensions.Note
Detailed information on job security is perhaps more important now than ever as the economy recovers from the COVID-19 pandemic. Although it is not clear what recovery will look like in the long run, one possibility that has received a lot of attention is a K-shaped pattern, where different sectors or groups of workers recover at different rates or extents. The degree of disparity in job security could be an important factor in determining how well workers fare in the coming months or years. In turn, this could have important implications for the evolution of income inequality in Canada.
Two in five employees held a triple-protected job before the COVID-19 pandemic
Overall, two in five (40.7%) employees between the ages of 18 and 64 held a triple-protected job in 2019, prior to the COVID-19 pandemic (Chart 1). Another 44.7% held a double-protected job, the majority of which had no predetermined end date and were resilient to pandemics. As a result, 85.4% of employees held a job with at least two layers of job protection. Most of the remaining employees (13.3%) held a single-protected job, consisting almost entirely of jobs with no predetermined end date or jobs that were resilient to pandemics. Only a very small percentage of workers held unprotected jobs, as defined in this study (1.3%).Note
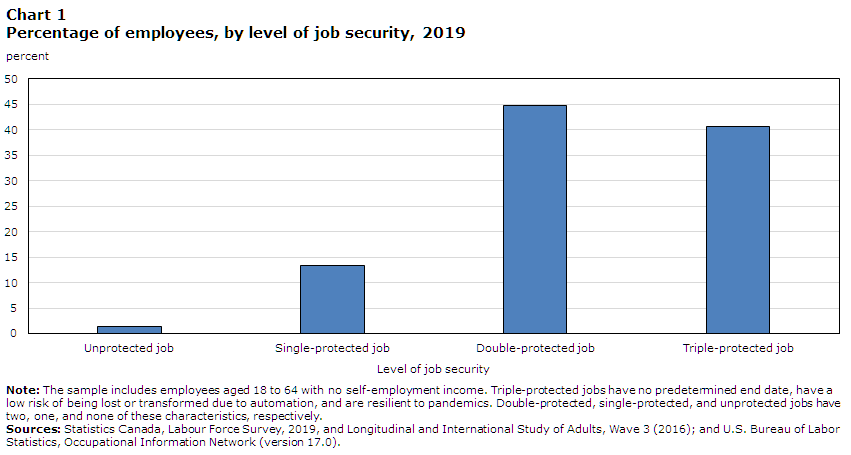
Data table for Chart 1
| Level of job security | Employees |
|---|---|
| percent | |
| Unprotected job | 1.302 |
| Single-protected job | 13.299 |
| Double-protected job | 44.740 |
| Triple-protected job | 40.660 |
|
Note: The sample includes employees aged 18 to 64 with no self-employment income. Triple-protected jobs have no predetermined end date, have a low risk of being lost or transformed due to automation, and are resilient to pandemics. Double-protected, single-protected, and unprotected jobs have two, one, and none of these characteristics, respectively. Sources: Statistics Canada, Labour Force Survey, 2019, and Longitudinal and International Study of Adults, Wave 3 (2016); and U.S. Bureau of Labor Statistics, Occupational Information Network (version 17.0). |
|
Highly educated and high-wage workers were far more likely to hold a triple-protected job
Different groups of workers had different levels of job security (Table 1).Note Men were somewhat more likely to hold a triple-protected job (42.4%) than women (38.8%).Note Similarly, Canadian-born individuals and long-term immigrants were somewhat more likely to hold a triple-protected job than recent immigrants.
| Unprotected job | Single-protected job | Double-protected job | Triple-protected job | |
|---|---|---|---|---|
| percent | ||||
| Overall | 1.3 | 13.3 | 44.7 | 40.7 |
| Sex | ||||
| Men | 0.9 | 10.5 | 46.1 | 42.4 |
| Women | 1.7 | 16.2 | 43.3 | 38.8 |
| Age groups | ||||
| 18 to 24 years | 5.8 | 32.1 | 48.5 | 13.6 |
| Student | 10.5 | 43.2 | 40.1 | 6.1 |
| Non-student | 2.7 | 24.8 | 54.1 | 18.5 |
| 25 to 34 years | 1.0 | 12.3 | 43.8 | 42.9 |
| 35 to 54 years | 0.4 | 9.1 | 42.1 | 48.4 |
| 55 to 64 years | 0.6 | 11.3 | 50.2 | 37.9 |
| Immigration status | ||||
| Born in Canada | 1.2 | 13.3 | 44.4 | 41.1 |
| Long-term immigrant (at least 10 years in Canada) | 1.2 | 11.2 | 45.8 | 41.8 |
| Recent immigrant (fewer than 10 years in Canada) | 2.0 | 16.4 | 46.1 | 35.4 |
| Other | 3.0 | 19.5 | 43.2 | 34.2 |
| Highest level of educational attainment | ||||
| Less than a high school diploma | 1.9 | 17.4 | 64.5 | 16.2 |
| High school diploma | 2.6 | 20.5 | 54.7 | 22.2 |
| Postsecondary certificate or diploma | 0.9 | 13.0 | 49.9 | 36.2 |
| Bachelor's degree | 0.7 | 8.2 | 28.7 | 62.4 |
| Above bachelor's degree | 0.5 | 4.6 | 21.6 | 73.3 |
| Hourly wage decile | ||||
| Bottom 10% | 6.1 | 35.9 | 48.8 | 9.2 |
| 2nd decile | 3.5 | 27.6 | 56.4 | 12.5 |
| 3rd decile | 0.9 | 17.4 | 61.4 | 20.3 |
| 4th decile | 0.8 | 15.3 | 57.5 | 26.4 |
| 5th decile | 0.4 | 11.2 | 56.3 | 32.1 |
| 6th decile | 0.2 | 7.8 | 49.9 | 42.2 |
| 7th decile | 0.4 | 5.9 | 43.4 | 50.3 |
| 8th decile | 0.2 | 3.8 | 31.7 | 64.3 |
| 9th decile | 0.1 | 2.8 | 23.3 | 73.9 |
| Top 10% | 0.0 | 1.3 | 11.5 | 87.2 |
|
Notes: The sample includes employees aged 18 to 64 with no self-employment income. Individuals in the "other" category of immigration status include those who are neither landed immigrants nor Canadian-born. Triple-protected jobs have no predetermined end date, have a low risk of being lost or transformed due to automation, and are resilient to pandemics. Double-protected, single-protected, and unprotected jobs have two, one, and none of these characteristics, respectively. Sources: Statistics Canada, Labour Force Survey, 2019, and Longitudinal and International Study of Adults, Wave 3 (2016); and U.S. Bureau of Labor Statistics, Occupational Information Network (version 17.0). |
||||
Differences in job security were larger across age groups, education levels and pay rates. Only 13.6% of young employees (aged 18 to 24) held a triple-protected job, compared with at least 37.9% of employees aged 25 and over. Conversely, young workers were far more likely to hold a single-protected job (32.1%) than their older counterparts (between 9.1% and 12.3%). Among 18- to 24-year-olds, students were much less likely to hold a triple-protected job (6.1%) than non-students (18.5%).
Job security varied even more across education levels. While fewer than 1 in 4 high school graduates held a triple-protected job, at least 6 in 10 postsecondary degree holders did. In fact, there is a clear, positive and monotonic relationship between a worker’s highest education level and their probability of holding a triple-protected job. Conversely, individuals with lower levels of education were much more likely to hold a single-protected or double-protected job.
The largest differences in job security were observed in the distribution of hourly wages. While only 9.2% of employees in the bottom decile of the wage distribution held a triple-protected job, 87.2% of those in the top decile did. Consequently, highly educated and high-wage workers were far more likely than other workers to hold a triple-protected job.
Spouses who both had a degree were seven times more likely to both have a triple-protected job than couples with no postsecondary credential
Individual job security is a very important measure of potential well-being. However, the economic well-being of families not only depends on the level of job security of one individual, but often on the job security of both spouses. This is especially true in turbulent economic times, as job loss is a real possibility, and affected couples may need to rely on the spouse who kept their job. Chart 2 shows the proportion of dual-earner couples where both spouses held a triple-protected job, by the highest level of educational attainment of both spouses.Note

Data table for Chart 2
| Highest level of educational attainment | Triple-protected jobs |
|---|---|
| percent | |
| Both spouses have a high school diploma or less | 8.171 |
| Husband has a postsecondary certificate or diploma, wife has high school or less | 11.464 |
| Wife has a postsecondary certificate or diploma, husband has high school or less | 11.693 |
| Both spouses have a postsecondary certificate or diploma | 18.434 |
| Husband has a bachelor's degree or above, wife does not have a degree | 29.508 |
| Wife has a bachelor's degree or above, husband does not have a degree | 35.485 |
| Both spouses have a bachelor's degree or above | 55.669 |
|
Note: The sample includes married or common-law couples where both spouses are employees, are aged 18 to 64, and have no self-employment income. Triple-protected jobs have no predetermined end date, have a low risk of being lost or transformed due to automation, and are resilient to pandemics. Sources: Statistics Canada, Labour Force Survey, 2019, and Longitudinal and International Study of Adults, Wave 3 (2016); and U.S. Bureau of Labor Statistics, Occupational Information Network (version 17.0). |
|
The results indicate that highly educated couples are far more likely to have both spouses hold a triple-protected job than their less educated counterparts. Of all dual-earner couples where both spouses have at least a bachelor’s degree, 55.7% have triple-protected jobs for both spouses. This percentage is seven times higher than the percentage for couples in which both spouses have a high school diploma or less (8.2%). Even in couples where both members have a postsecondary certificate or diploma, only 18.4% have triple-protected jobs for both spouses. This gradient is substantially larger than what Table 1 suggests for individuals. For example, individuals with a bachelor’s degree or above were only about three times as likely to hold a triple-protected job as those with a high school diploma or less.Note
Chart 2 also highlights the importance of both spouses having achieved a certain level of education rather than only one of them. For example, couples where both spouses had a degree were far more likely to have both spouses hold a triple-protected job (55.7%) than couples where only one spouse had a degree (29.5% when the husband held a degree and 35.5% when the wife held a degree). Similarly, 18.4% of couples where both spouses had a postsecondary certificate or diploma enjoyed triple protection for both spouses, considerably higher than the rate observed among couples where only one spouse held a postsecondary certificate or diploma (11.5% among couples where the husband held the credential, and 11.7% among couples where the wife held the credential).
Spouses in the top earnings decile were about 20 times more likely to both have a triple-protected job than couples in the bottom decile
Whether COVID-19 will have long-term implications for income inequality is unknown at this point. However, if automation and telework become more common as a result of technology and the pandemic, dual-earner couples at the top of the earnings distribution are likely to be in a better position to deal with economic uncertainties than those at the bottom. More than three-quarters (77.0%) of couples in the top decile of the earnings distribution have both spouses in a triple-protected job, about 20 times higher than their counterparts in the bottom decile (3.5%) (Chart 3). Couples in the top decile are also roughly four times more likely to have both spouses employed in a triple-protected job than couples in the fifth decile (18.3%).
Once again, the disparities among dual-earner couples are larger than those reported among individuals in Table 1. For example, individuals in the top decile of the hourly wage distribution were only 9.5 times more likely to hold a triple-protected job than those in the bottom decile.
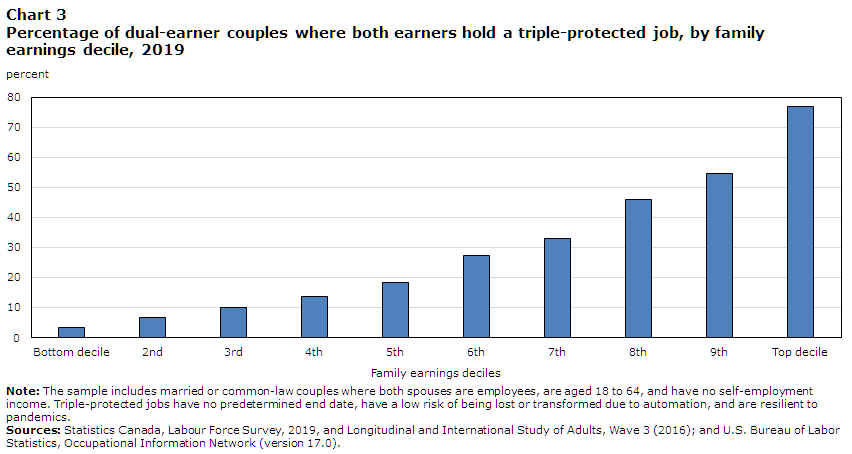
Data table for Chart 3
| Family earnings deciles | Triple-protected jobs |
|---|---|
| percent | |
| Bottom decile | 3.479 |
| 2nd | 6.809 |
| 3rd | 9.859 |
| 4th | 13.664 |
| 5th | 18.333 |
| 6th | 27.220 |
| 7th | 33.016 |
| 8th | 46.117 |
| 9th | 54.595 |
| Top decile | 77.030 |
|
Note: The sample includes married or common-law couples where both spouses are employees, are aged 18 to 64, and have no self-employment income. Triple-protected jobs have no predetermined end date, have a low risk of being lost or transformed due to automation, and are resilient to pandemics. Sources: Statistics Canada, Labour Force Survey, 2019, and Longitudinal and International Study of Adults, Wave 3 (2016); and U.S. Bureau of Labor Statistics, Occupational Information Network (version 17.0). |
|
Couples living in Ottawa, Toronto, Outaouais, and Montréal were the most likely to have triple-protected jobs for both spouses
The degree of job security enjoyed by workers depends largely on the nature of work involved, which in turn varies considerably by economic region. Couples working in economic regions with large cities are generally more likely to have both spouses employed in a triple-protected job (Chart 4). At the very top is Ottawa, home to many government departments and high-tech companies. In general, many jobs in the government and high-tech sectors require a relatively high level of educational attainment and are often in office settings. These two factors may, to some extent, explain why 43.4% of all dual-earner couples in Ottawa have both spouses employed in a triple-protected job. Outaouais, which is next to Ottawa on the Quebec side, also ranks high, with 33.6% (third place). Toronto (37.6%) and Montréal (33.1%) rank second and fourth place, respectively. Other regions with large cities occupy most of the other top spots in the ranking.
At the opposite end of the spectrum are small communities with no large cities. South Coast–Burin Peninsula and Notre Dame–Central Bonavista Bay (Newfoundland and Labrador) ranks last (7.8%), followed by Yorkton–Melville in Saskatchewan (12.6%), and West Coast–Northern Peninsula–Labrador, also in Newfoundland and Labrador (12.7%).
Taken together, these numbers highlight a rural–urban divide in job security.

Data table for Chart 4
| Economic region | Triple-protected jobs |
|---|---|
| percent | |
| South Coast–Burin Peninsula and Notre Dame–Central Bonavista Bay (NL) | 7.838 |
| Yorkton–Melville (SK) | 12.565 |
| West Coast–Northern Peninsula–Labrador (NL) | 12.677 |
| Camrose–Drumheller (AB) | 13.230 |
| Kootenay (BC) | 13.599 |
| Swift Current–Moose Jaw (SK) | 14.138 |
| Gaspésie–Îles-de-la-Madeleine (QC) | 14.290 |
| Annapolis Valley (NS) | 14.484 |
| Banff–Jasper–Rocky Mountain House and Athabasca–Grande Prairie–Peace River (AB) | 15.400 |
| Campbellton–Miramichi (NB) | 15.523 |
| Southern (NS) | 15.917 |
| North Shore (NS) | 16.217 |
| Edmundston–Woodstock (NB) | 16.281 |
| Cape Breton (NS) | 16.924 |
| Saguenay–Lac-Saint-Jean (QC) | 17.120 |
| Bas-Saint-Laurent (QC) | 17.203 |
| Centre-du-Québec (QC) | 18.268 |
| Northwest (ON) | 18.309 |
| Mauricie (QC) | 18.582 |
| Lanaudière (QC) | 19.062 |
| Prince Edward Island (PE) | 19.104 |
| Windsor–Sarnia (ON) | 19.364 |
| Northeast (BC) | 19.406 |
| Cariboo (BC) | 19.910 |
| Chaudière-Appalaches (QC) | 19.917 |
| Parklands and North (MB) | 20.415 |
| Thompson–Okanagan (BC) | 20.984 |
| Estrie (QC) | 21.785 |
| Northeast (ON) | 22.060 |
| London (ON) | 22.320 |
| Lethbridge–Medicine Hat (AB) | 22.436 |
| Southeast (MB) | 22.721 |
| Prince Albert and Northern (SK) | 22.905 |
| Montérégie (QC) | 23.043 |
| Interlake (MB) | 23.053 |
| Kingston–Pembroke (ON) | 23.824 |
| Abitibi-Témiscamingue (QC) | 23.985 |
| South Central and North Central (MB) | 24.018 |
| Stratford–Bruce Peninsula (ON) | 24.072 |
| Vancouver Island and Coast (BC) | 24.319 |
| Laurentides (QC) | 24.607 |
| Laval (QC) | 24.638 |
| Wood Buffalo–Cold Lake (AB) | 24.688 |
| North Coast and Nechako (BC) | 24.823 |
| Muskoka–Kawarthas (ON) | 24.960 |
| Avalon Peninsula (NL) | 25.141 |
| Red Deer (AB) | 25.547 |
| Saskatoon–Biggar (SK) | 25.716 |
| Côte-Nord et Nord-du-Québec (QC) | 25.782 |
| Kitchener–Waterloo–Barrie (ON) | 25.833 |
| Fredericton–Oromocto (NB) | 26.284 |
| Hamilton–Niagara Peninsula (ON) | 26.332 |
| Winnipeg (MB) | 26.685 |
| Saint John–St. Stephen (NB) | 27.015 |
| Capitale-Nationale (QC) | 27.776 |
| Moncton–Richibucto (NB) | 28.987 |
| Southwest (MB) | 29.011 |
| Regina–Moose Mountain (SK) | 29.551 |
| Calgary (AB) | 29.958 |
| Edmonton (AB) | 29.978 |
| Lower Mainland–Southwest (BC) | 30.500 |
| Halifax (NS) | 30.662 |
| Montréal (QC) | 33.087 |
| Outaouais (QC) | 33.641 |
| Toronto (ON) | 37.601 |
| Ottawa (ON) | 43.374 |
|
Note: The sample includes married or common-law couples where both spouses are employees, are aged 18 to 64, and have no self-employment income. Triple-protected jobs have no predetermined end date, have a low risk of being lost or transformed due to automation, and are resilient to pandemics. NL: Newfoundland and Labrador; PE: Prince Edward Island; NS: Nova Scotia; NB: New Brunswick; ON: Ontario; QC: Quebec; MB: Manitoba; SK: Saskatchewan; AB: Alberta; BC: British Columbia. Sources: Statistics Canada, Labour Force Survey, 2019, and Longitudinal and International Study of Adults, Wave 3 (2016); and U.S. Bureau of Labor Statistics, Occupational Information Network (version 17.0). |
|
Conclusion
Job security is sometimes measured by the extent to which a job is temporary or permanent (i.e., whether or not it has a predetermined end date). However, recent developments in artificial intelligence and the COVID-19 pandemic have created two new potential sources of job insecurity. To address these new realities, this study developed a new measure of job security that incorporates three layers of employment protection. More precisely, the study re-examines Canadians’ job security by defining a triple-protected job as one that has no predetermined end date, has a low risk being lost of transformed due to automation, and is resilient to pandemics.
The study shows that two in five employees held triple-protected jobs in Canada in 2019, prior to the COVID-19 pandemic. However, such jobs were unequally distributed across workers, families, and regions. Highly educated and high-wage workers were the most likely to hold such jobs. Likewise, highly educated dual-earner couples and dual-earner couples in the top decile of the earnings distribution were much more likely to have triple-protected jobs for both spouses than other dual-earner couples. In fact, the disparities in triple job protection by education and earnings were larger among dual-earner couples than among individuals. Finally, couples living in economic regions with large cities were far more likely to enjoy relatively high levels of job security than those living in small towns and rural areas. Note that these results attach no weight, either in likelihood (probability of job loss) or in importance (loss of earnings conditional on job loss), to any of the three conditions of job security examined in this study.
The findings of this study suggest that further developments in artificial intelligence and potential pandemics may exacerbate family income inequality in the years to come. As such, they inform discussions on important issues such as inclusive growth and economic resilience. Whether increases in family income inequality will materialize as a result of these new realities is an important question for future research as well as for statistical agencies in industrialized countries.
Appendix 1: Data and methods
Three data sets are used in this study: Statistics Canada’s 2019 Labour Force Survey (LFS), the 2016 (Wave 3) Longitudinal and International Study of Adults (LISA), and the Occupational Information Network (O*NET), version 17.0 from the U.S. Bureau of Labor Statistics.
The sample of workers in the LFS consists of employeesNote aged 18 to 64 and for which information about the risk of automation is available in LISA based on their occupation. Because LISA has information on the risk of automation for 454 occupations (out of 500), this working sample captures 94% of the population of employees aged 18 to 64. The sample of couples includes married or common-law couples in the LFS in which both spouses are employees, are aged 18 to 64, and have no self-employment income. This sample excludes single-earner couples, dual-earner couples with self-employment income, and dual-earner couples for which information on the risk of automation cannot be derived from LISA. It captures 46.9% of the population of working couples.
Triple-protected jobs satisfy the three following conditions: (a) they have no predetermined end date, (b) they have a low risk of being lost or transformed due to automation, and (c) they are resilient to pandemics.
Information on jobs with no predetermined end date is taken from the LFS, using the distinction between permanent jobs and temporary jobs.
Information on the risk of automation is obtained from LISA, using a methodology developed by Arntz, Gregory and Zierahn (2016) and applied to the Canadian context by Frenette and Frank (2020). Individual-level estimates of the likelihood of holding a job that can be automated are aggregated at the occupation level, using 4-digit occupations from the 2011 National Occupation Classification (NOC 2011). Individuals are deemed to hold a job with a low risk of automation if the average likelihood of holding such a job, measured at the 4-digit occupation level, is less than 50%.
Jobs that are resilient to pandemics satisfy at least one of the three following conditions: (a) they can be done from home, (b) they involve enough physical distancing (among workers and the public) to meet safety protocols, or (c) they are deemed essential by authorities.
Jobs that can be done from home are identified using the telework feasibility indicator developed by Dingel and Neiman (2020) and applied to the Canadian context by Messacar, Morissette and Deng (2020). This measure uses a crosswalk between the U.S. Standard Occupational Classification (SOC) of 2010 and the National Occupational Classification (NOC) of 2011 introduced in Frenette and Frank (2017), as well as information from O*NET.
Two metrics are used to determine whether jobs involve enough physical distancing to meet safety protocols: (a) they are in industries where there are no large crowds and physical distancing is sufficient among employees and the public (determined in this study), and (b) they are in occupations that do not require close physical proximity among workers (as measured by O*NET); i.e., working at arm’s length or very close to (nearly touching) other colleagues.
Similarly, two metrics are used to determine whether jobs are deemed essential by authorities: (a) the proportion of jobs in industries that provide critical goods and services; and (b) the proportion of jobs in occupations related to critical infrastructure, as determined by the Labor Market Information Institute and the Council for Community and Economic Research in the United States (and augmented with manual edits in this study).Note
The first metric is intentionally designed to provide a narrow definition of essential services. For example, it excludes industrial gas manufacturing (North American Industry Classification System [NAICS] code 315120), an industry that produces oxygen, among other things. In addition, potash mining (NAICS code 212396) is excluded even though potash serves as an input to fertilizer manufacturing, which is included in the first metric. The first metric covers 36.7% of the jobs held by employees aged 18 to 64 (Appendix Table 1). The second metric is a more inclusive measure and covers 62.5% of the jobs held by employees in this age group. Use of two measures that cover markedly different proportions of the workforce is deliberate: it is intended to test the robustness of the results against very different concepts of essential jobs. If the main findings of the study are the same regardless of the metrics—as they turn out to be—this gives greater confidence that the results are not sensitive to the definition of essential services.
| Characteristics of jobs held by employees | Jobs included in metric |
|---|---|
| percent | |
| Triple-protection characteristiscs | |
| Jobs with no predetermined end date | 89.2 |
| Jobs with a low risk of automation | 48.0 |
| Jobs that can be done from home | 41.4 |
| Essential services | |
| Jobs in essential industries | 36.7 |
| Jobs in essential occupations | 62.5 |
| Physical distancing | |
| Jobs in industries with enough physical distancing | 63.5 |
| Jobs in occupations with enough physical distancing | 76.3 |
| Work from home and physical distancing | |
| Jobs that can be done from home or are in industries with enough physical distancing | 76.5 |
| Jobs that can be done from home or are in occupations with enough physical distancing | 82.9 |
| Resiliency to pandemics | |
| Jobs resilient to pandemics, version 1 | 87.6 |
| Jobs resilient to pandemics, version 2 | 83.3 |
| Jobs resilient to pandemics, version 3 | 91.3 |
| Jobs resilient to pandemics, version 4 | 87.9 |
| Triple protection | |
| Triple-protected jobs, version 1 | 40.7 |
| Triple-protected jobs, version 2 | 40.0 |
| Triple-protected jobs, version 3 | 41.1 |
| Triple-protected jobs, version 4 | 41.3 |
|
Notes: The sample includes employees aged 18 to 64 with no self-employment income. Triple-protected jobs have no predetermined end date, have a low risk of being lost or transformed due to automation, and are resilient to pandemics. Version 1 (2) of whether jobs are resilient to pandemics combines estimates of the proportion of jobs in industries involving enough physical distancing with estimates of the proportion of jobs in essential occupations (industries). Version 3 (4) of whether jobs are resilient to pandemics combines estimates of the proportion of occupations involving enough physical distancing with estimates of the proportion of jobs in essential occupations (industries). Sources: Statistics Canada, Labour Force Survey, 2019, and Longitudinal and International Study of Adults, Wave 3 (2016); and U.S. Bureau of Labor Statistics, Occupational Information Network (version 17.0). |
|
By combining the two measures of jobs with enough physical distancing with the two measures of jobs that provide essential services, four measures of resilience to pandemics are constructed.Note
Appendix Table 1 shows that between 76.5% and 82.9% of jobs can be done from home or are in industries/occupations that involve enough physical distancing. This finding is important, as it implies that even before considering essential services, the vast majority of jobs are resilient to pandemics. This helps to understand why adding essential services only slightly increases the percentage of pandemic-resilient jobs; depending on the resilience measure considered, the percentage of jobs that are resilient to pandemics varies between 83.3% and 91.3%. As a result, even though the two measures of essential services differ by roughly 25 percentage points (36.7% versus 62.5%), the various resilience measures end up differing by at most 8 percentage points. Most importantly, the share of workers employed in a triple-protected job hardly varies across the four versions (from 40.0% to 41.3%).
Appendix Table 2 reveals the degree to which estimates of the percentage of workers in triple-protected jobs are sensitive to the choice of the measure used to define jobs that are resilient to pandemics. Version 1 (2) of this measure combines estimates of the proportion of jobs in industries involving enough physical distancing with estimates of the proportion of jobs in essential occupations (industries). Version 3 (4) combines estimates of the proportion of jobs in occupations involving enough physical distancing with estimates of the proportion of jobs in essential occupations (industries). From these four versions of pandemic-resilient jobs, four estimates of the percentage of workers in triple-protected jobs are derived.
| Job has no predetermined end date | Job has a low risk of automation | Job is resilient to pandemics | Job is triple-protected | |||||||
|---|---|---|---|---|---|---|---|---|---|---|
| Version 1 | Version 2 | Version 3 | Version 4 | Version 1 | Version 2 | Version 3 | Version 4 | |||
| percent | ||||||||||
| Overall | 89.2 | 48.0 | 87.6 | 83.3 | 91.3 | 87.9 | 40.7 | 40.0 | 41.1 | 41.3 |
| Sex | ||||||||||
| Men | 90.3 | 48.1 | 91.7 | 85.5 | 94.2 | 92.3 | 42.4 | 41.9 | 42.9 | 43.2 |
| Women | 88.2 | 47.8 | 83.2 | 81.0 | 88.3 | 83.3 | 38.8 | 38.1 | 39.1 | 39.3 |
| Age | ||||||||||
| 18 to 24 years | 75.0 | 24.3 | 70.5 | 61.3 | 82.3 | 77.3 | 13.6 | 13.3 | 14.6 | 15.2 |
| Student | 65.2 | 19.0 | 57.7 | 47.8 | 76.6 | 70.5 | 6.1 | 5.9 | 7.9 | 8.3 |
| Non-student | 81.5 | 27.8 | 79.1 | 70.2 | 86.1 | 81.8 | 18.5 | 18.2 | 19.0 | 19.7 |
| 25 to 34 years | 88.6 | 52.4 | 87.5 | 83.5 | 90.8 | 87.7 | 42.9 | 42.0 | 43.3 | 43.5 |
| 35 to 54 years | 92.7 | 54.2 | 91.5 | 88.3 | 93.6 | 90.2 | 48.4 | 47.6 | 48.7 | 48.8 |
| 55 to 64 years | 91.9 | 43.3 | 90.3 | 87.1 | 93.2 | 90.6 | 37.9 | 37.6 | 38.1 | 38.6 |
| Immigration status | ||||||||||
| Born in Canada | 89.5 | 48.5 | 87.4 | 83.7 | 91.1 | 88.4 | 41.1 | 40.5 | 41.5 | 41.7 |
| Long-term immigrant (at least 10 years in Canada) | 90.9 | 48.6 | 88.8 | 84.4 | 92.7 | 88.1 | 41.8 | 41.2 | 42.3 | 42.6 |
| Recent immigrant (fewer than 10 years in Canada) | 85.4 | 42.7 | 86.9 | 79.4 | 90.9 | 84.3 | 35.4 | 34.1 | 35.7 | 35.9 |
| Other | 80.5 | 43.7 | 84.5 | 75.2 | 88.6 | 82.2 | 34.2 | 33.7 | 34.1 | 34.7 |
| Highest level of educational attainment | ||||||||||
| Less than a high school diploma | 87.7 | 21.4 | 86.0 | 74.9 | 89.1 | 84.3 | 16.2 | 16.2 | 16.4 | 17.2 |
| High school diploma | 87.3 | 29.2 | 80.1 | 73.5 | 87.4 | 84.5 | 22.2 | 22.3 | 22.7 | 23.7 |
| Postsecondary certificate or diploma | 90.8 | 42.5 | 88.2 | 85.2 | 91.0 | 86.5 | 36.2 | 35.4 | 36.6 | 36.7 |
| Bachelor's degree | 89.4 | 71.6 | 91.8 | 89.2 | 94.5 | 92.7 | 62.4 | 61.1 | 62.9 | 62.8 |
| Above bachelor's degree | 89.1 | 82.7 | 96.0 | 93.9 | 97.2 | 94.5 | 73.3 | 72.3 | 73.2 | 72.2 |
| Hourly wage decile | ||||||||||
| Bottom 10% | 80.3 | 15.7 | 65.1 | 53.1 | 78.1 | 73.0 | 9.2 | 9.1 | 9.4 | 10.2 |
| 2nd decile | 83.3 | 21.6 | 73.0 | 61.9 | 84.1 | 79.3 | 12.5 | 12.4 | 13.1 | 14.3 |
| 3rd decile | 87.1 | 29.6 | 84.3 | 77.9 | 89.2 | 85.3 | 20.3 | 19.5 | 20.9 | 22.0 |
| 4th decile | 87.1 | 35.1 | 87.3 | 84.5 | 90.6 | 84.0 | 26.4 | 25.8 | 26.8 | 27.6 |
| 5th decile | 89.4 | 40.3 | 90.5 | 88.1 | 93.3 | 88.6 | 32.1 | 31.5 | 32.6 | 33.4 |
| 6th decile | 91.0 | 49.9 | 93.1 | 91.6 | 94.8 | 92.2 | 42.2 | 41.4 | 42.5 | 42.9 |
| 7th decile | 91.4 | 58.2 | 94.1 | 92.3 | 94.5 | 92.7 | 50.3 | 49.6 | 50.9 | 50.8 |
| 8th decile | 93.7 | 70.4 | 96.0 | 94.4 | 95.5 | 94.5 | 64.3 | 62.9 | 64.5 | 63.5 |
| 9th decile | 94.4 | 79.2 | 97.5 | 96.6 | 97.2 | 95.5 | 73.9 | 72.8 | 74.3 | 72.8 |
| Top 10% | 96.7 | 90.9 | 98.3 | 97.9 | 98.0 | 97.6 | 87.2 | 86.8 | 87.4 | 86.9 |
|
Notes: The sample includes employees aged 18 to 64 with no self-employment income. Individuals in the "other" category of immigration status include those who are neither landed immigrants nor Canadian-born. Triple-protected jobs have no predetermined end date, have a low risk of being lost or transformed due to automation, and are resilient to pandemics. Double-protected, single-protected, and unprotected jobs have two, one, and none of the characteristics of triple-protected jobs, respectively. Version 1 (2) of whether a job is resilient to pandemics combines estimates of the proportion of jobs in industries involving enough physical distancing with estimates of the proportion of jobs in essential occupations (industries). Version 3 (4) of whether a job is resilient to pandemics combines estimates of the proportion of occupations involving enough physical distancing with estimates of the proportion of jobs in essential occupations (industries). Sources: Statistics Canada, Labour Force Survey, 2019, and Longitudinal and International Study of Adults, Wave 3 (2016); and U.S. Bureau of Labor Statistics, Occupational Information Network (version 17.0). |
||||||||||
The last four columns of Appendix Table 2 show that regardless of how resilience to pandemics is measured, the estimates of the percentage of workers in triple-protected jobs across various socioeconomic characteristics are very similar. To some extent, this similarity is not surprising. It results in part from the fact that triple-protected jobs must satisfy three conditions.Note As a result, any individual whose job is temporary or has a high risk of automation will be excluded from the set of workers with a triple-protected job, regardless of whether or not the job can be done from home, involves enough physical distancing or provides essential services. This implies that regardless of the metric used to define essential services, workers who hold a temporary job or a job with a high risk of automation will be excluded from the set of workers in a triple-protected job. For example, the fact that 21.4% of employees with no high school diploma have a job with a low risk of automation implies that 21.4% at most of such employees will end up in a triple-protected job, regardless of the definition of essential services used. Similar patterns are observed for employees aged 25 to 64 and for dual-earner couples (results available upon request).
Although the results are robust to the different versions of triple-protected job indicators, the study adopts version 1 in order to be concise.
References
Arntz, M., T. Gregory, and U. Zierahn. 2016. The risk of automation for jobs in OECD countries: A comparative analysis. OECD Social, Employment and Migration Working Papers, no. 189. Paris: OECD Publishing.
Brynjolfsson, E., and A. McAfee. 2014. The Second Machine Age: Work Progress and Prosperity in a Time of Brilliant Technologies. New York: W. W. Norton & Company Publishers.
Dingel, J.L., and B. Neiman. 2020. How many jobs can be done at home? NBER Working Paper no. 26948. Cambridge: National Bureau of Economic Research.
Frank, M., and M. Frenette. 2021. Couples’ perceptions of the division of household and child care tasks: Are there differences between sociodemographic groups? Analytical Studies Branch Research Paper Series, no. 460. Statistics Canada Catalogue no. 11F0019M. Ottawa: Statistics Canada.
Frank, M., Z. Yang, and M. Frenette. 2021.“The changing nature of work in Canada amid recent advances in automation technology.” Economic and Social Reports 1 (1). Statistics Canada Catalogue no. 36-28-0001.
Frenette, M., and K. Frank. 2017. Do postsecondary graduates land high-skilled jobs? Analytical Studies Branch Research Paper Series, no. 388. Statistics Canada Catalogue no. 11F0019M. Ottawa: Statistics Canada.
Frenette, M., and K. Frank. 2020. Automation and job transformation in Canada: Who’s at risk? Analytical Studies Branch Research Paper Series, no. 448. Statistics Canada Catalogue no. 11F0019M. Ottawa: Statistics Canada.
Galarneau, D. 2005. “Earnings of temporary versus permanent employees.” Perspectives on Labour and Income. Statistics Canada Catalogue no. 75-001XIE. Ottawa: Statistics Canada.
International Federation of Robotics. 2018. “Robot density rises globally.” IFR Press Releases. February 7. Available at: https://ifr.org/ifr-press-releases/news/robot-density-rises-globally.
Intergovernmental Platform on Biodiversity and Ecosystem Services. 2020. Workshop Report from the IPBES Workshop on Biodiversity and Pandemics. October 29. Available at: https://ipbes.net/sites/default/files/2020-10/20201028%20IPBES%20Pandemics%20Workshop%20Report% 20Plain%20Text%20Final_0.pdf.
Jeon, S., H. Lu, and Y. Ostrovsky. 2019. Measuring the Gig Economy in Canada Using Administrative Data. Analytical Studies Branch Research Paper Series, no. 437. Statistics Canada Catalogue no. 11F0019M. Ottawa: Statistics Canada.
Messacar, D., R. Morissette, and Z. Deng. 2020. Inequality in the feasibility of working from home during and after COVID-19. StatCan COVID-19: Data to Insights for a Better Canada, no. 00029. Statistics Canada Catalogue no. 45280001. Ottawa: Statistics Canada.
Morissette, R., and H. Qiu. 2020. Turbulence or Steady Course? Permanent Layoffs in Canada, 1978-2016. IRPP Study 76. Montréal: Institute for Research on Public Policy.
Morissette, R., H. Qiu, and P.C.W. Chan. 2013. The risk and cost of job loss in Canada, 1978-2008. Canadian Journal of Economics. 46 (4): 1480-1509.
Nickell, S., P. Jones, and G. Quintini. 2002. “A picture of job insecurity facing British men.” Economic Journal 112, 1–27.
Public Safety Canada. 2021. Guidance on Essential Services and Functions in Canada During the COVID-19 Pandemic. Last updated January 15, 2021. Government of Canada. Available at: https://www.publicsafety.gc.ca/cnt/ntnl-scrt/crtcl-nfrstrctr/esf-sfe-en.aspx
Statistics Canada. n.d. Table 14-10-0072-01. Job permanency (permanent and temporary) by industry, annual (x 1,000). Statistics Canada Catalogue no. 11-627-M. Ottawa: Statistics Canada.
Statistics Canada. 2018. Temporary employment in Canada, 2018. Statistics Canada Catalogue no. 11-627-M. Ottawa: Statistics Canada.
- Date modified: