
Research to Insights: Immigration as a Source of Labour Supply

Archived Content
Information identified as archived is provided for reference, research or recordkeeping purposes. It is not subject to the Government of Canada Web Standards and has not been altered or updated since it was archived. Please "contact us" to request a format other than those available.
Skip to text
Text begins
About Research to Insights
The Research to Insights series of presentations features a broad range of findings on selected topics of research. Each presentation will draw from and integrate evidence from many different studies that use innovative and high-quality data and methods to better understand relevant and complex policy issues.
Based on applied research of valuable data, the series is intended to provide decision makers, and Canadians more broadly, a comprehensive and horizontal view of the current social, economic and health issues we face in a changing world.
Context: Short-term pressures on the labour supply as businesses emerge from the COVID-19 pandemic
- Canada’s labour market has tightened substantially as restrictions related to the COVID-19 pandemic ease and economic activity continues to strengthen.
- Employment rates among core-aged men and women (25 to 54 years) are well above their pre-pandemic baselines. Employment rates among youth have also fully recovered.
- The national unemployment rate fell to a record low 5.2% in April. Among core-aged workers, the rate was 4.3%.
- More recent core-aged immigrants are working now than before the pandemic.
- Almost 4 in 10 businesses anticipated worker shortages in early 2022, while a similar percentage expect challenges in recruiting skilled employees. Job vacancies in late 2021 were 80% above pre-pandemic levels.
- High levels of immigration over the near term will be critical in addressing current labour market imbalances.
Context: Structural trends point to persistent labour supply challenges over the longer term
- Canada’s working-age population (15 to 64 years) has never been older. More than one in five working-age Canadians are approaching retirement age.
- Currently, working-age Canadians make up 64.8% of the population; in three decades, it could fall below 60%.
- Immigration has been the driving force behind Canada’s labour supply for many years. During the 2010s, over four-fifths of the growth in Canada’s labour force came from immigration.
- Modest, sustained increases in immigration levels will not fully offset the longer-term impacts of an aging population, but are critical for alleviating the effects of aging on the labour market over time.
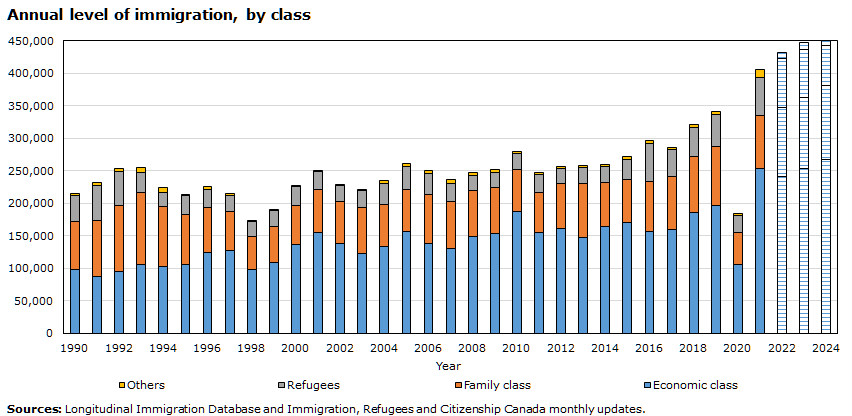
Recent years had the highest annual admission levels of the past century
- After the interruption caused by the pandemic in 2020, 405,800 immigrants were admitted in 2021, the highest level in the history.
- Since 2010, 60% of immigrants were in the economic class, 26% were in the family class and 13% were refugees.
- There has been an increased share of refugees since 2016.
Data table
| Year | Economic class | Family class | Refugees | Others | Total |
|---|---|---|---|---|---|
| 1990 | 97,717 | 73,917 | 40,204 | 3,593 | 215,431 |
| 1991 | 86,835 | 86,755 | 54,001 | 4,227 | 231,818 |
| 1992 | 95,650 | 100,437 | 52,309 | 5,538 | 253,934 |
| 1993 | 105,417 | 111,951 | 30,566 | 7,741 | 255,675 |
| 1994 | 102,176 | 93,557 | 20,437 | 7,425 | 223,595 |
| 1995 | 106,560 | 76,754 | 28,112 | 727 | 212,153 |
| 1996 | 125,066 | 67,974 | 28,857 | 3,465 | 225,362 |
| 1997 | 128,095 | 59,669 | 24,616 | 3,078 | 215,458 |
| 1998 | 97,672 | 50,631 | 23,060 | 2,320 | 173,683 |
| 1999 | 109,000 | 54,973 | 24,552 | 841 | 189,366 |
| 2000 | 135,958 | 60,252 | 30,240 | 297 | 226,747 |
| 2001 | 155,306 | 66,361 | 27,978 | 124 | 249,769 |
| 2002 | 138,052 | 64,895 | 25,173 | 89 | 228,209 |
| 2003 | 122,350 | 70,705 | 26,010 | 1,463 | 220,528 |
| 2004 | 134,093 | 63,698 | 32,721 | 4,835 | 235,347 |
| 2005 | 156,153 | 64,413 | 35,784 | 5,429 | 261,779 |
| 2006 | 138,145 | 74,827 | 32,505 | 5,631 | 251,108 |
| 2007 | 131,017 | 71,828 | 27,970 | 5,363 | 236,178 |
| 2008 | 148,806 | 71,603 | 21,857 | 4,348 | 246,614 |
| 2009 | 153,316 | 71,629 | 22,849 | 3,791 | 251,585 |
| 2010 | 186,664 | 65,229 | 24,695 | 3,483 | 280,071 |
| 2011 | 155,849 | 61,036 | 27,874 | 3,362 | 248,121 |
| 2012 | 160,643 | 69,476 | 23,094 | 4,028 | 257,241 |
| 2013 | 148,167 | 82,963 | 24,138 | 3,235 | 258,503 |
| 2014 | 164,888 | 67,210 | 24,053 | 3,356 | 259,507 |
| 2015 | 170,420 | 65,485 | 31,540 | 4,395 | 271,840 |
| 2016 | 156,030 | 78,005 | 58,490 | 3,845 | 296,370 |
| 2017 | 159,285 | 82,465 | 41,075 | 3,685 | 286,510 |
| 2018 | 186,375 | 85,165 | 45,465 | 4,050 | 321,055 |
| 2019 | 196,655 | 91,300 | 48,500 | 4,720 | 341,175 |
| 2020 | 106,395 | 49,305 | 25,490 | 3,395 | 184,585 |
| 2021 | 253,080 | 81,300 | 59,790 | 11,625 | 405,795 |
| 2022 | 241,850 | 105,000 | 76,545 | 8,250 | 431,645 |
| 2023 | 253,000 | 109,500 | 74,055 | 10,500 | 447,055 |
| 2024 | 267,750 | 113,000 | 62,500 | 7,750 | 451,000 |
| Sources: Longitudinal Immigration Database and Immigration, Refugees and Citizenship Canada monthly updates. | |||||
In the 2010s, immigrant workers accounted for 84% of the growth in the total labour force, 55% of the growth in high- and medium-skilled jobs and offset decline in low-skilled jobs among Canadian-born workers
- While employment in low-skilled jobs fell among Canadian-born workers and grew among immigrant workers in the 2010s, the share of low-skilled jobs fell for both Canadian-born and immigrant workers.
- Between 2019 and 2021, growth in high-skilled jobs offset the decline in other jobs.

Data table
| Total | Canadian-born | New immigrants | Recent immigrants | Long-term immigrants | Temporary residents | |
|---|---|---|---|---|---|---|
| change in employment in 1000s | ||||||
| Managerial | -7.1 | -94.6 | 7.4 | 14.0 | 55.4 | 10.7 |
| High-skilled | 743.6 | 323.4 | 53.6 | 57.7 | 259.8 | 49.0 |
| Medium-skilled | 1009.1 | 470.5 | 61.9 | 98.5 | 304.9 | 73.4 |
| Low-skilled | 99.8 | -399.7 | 63.4 | 106.3 | 236.7 | 93.2 |
| Source: Statistics Canada, Labour Force Survey. | ||||||

Data table
| Total | Canadian-born | New immigrants | Recent immigrants | Long-term immigrants | Temporary residents | |
|---|---|---|---|---|---|---|
| change in employment in 1000s | ||||||
| Managerial | -55.8 | -48.3 | 0.4 | -0.9 | -4.1 | -2.9 |
| High-skilled | 472.9 | 227.0 | 57.8 | 29.1 | 137.7 | 21.2 |
| Medium-skilled | -99.1 | -198.7 | 9.6 | -1.2 | 73.4 | 17.8 |
| Low-skilled | -341.8 | -298.7 | -34.0 | 1.2 | -12.1 | 1.7 |
| Source: Statistics Canada, Labour Force Survey. | ||||||
Since 2010, the share of new and recent immigrant workers grew the fastest in transportation and warehousing, professional services and accommodation and food services
- In 2021, the share of new and recent immigrant workers reached 13% in the accommodation and food services sector, 11% in the professional services sector, and 10% in the manufacturing and transportation sector.
- Between 2010 and 2021, the labour force in the manufacturing sector fell by 159,000 among Canadian-born workers and was partly replenished by new and recent immigrants (+46,000).
- Between 2019 and 2021, there was a large drop in the accommodation and food services sector among Canadian-born workers (-21%) and new immigrant workers (-31%) as well as in the agriculture sector among temporary foreign workers (TFWs) (-29%).

Data table
| 2010 | 2019 | 2021 | |
|---|---|---|---|
| percent | |||
| Agriculture, mining | 3.16 | 3.75 | 3.57 |
| Utilities and construction | 4.16 | 5.78 | 5.15 |
| Manufacturing | 7.59 | 9.45 | 10.28 |
| Wholesale and retail trade | 6.10 | 7.52 | 8.29 |
| Transportation and warehousing | 6.03 | 10.01 | 9.82 |
| Professional services | 7.29 | 9.80 | 10.58 |
| Educational services | 4.58 | 5.50 | 5.73 |
| Other services | 7.22 | 7.93 | 8.54 |
| Accommodation and food services | 9.96 | 13.02 | 12.93 |
| Public administration | 3.03 | 3.09 | 2.93 |
| Health services | 5.69 | 7.87 | 8.23 |
| Source: Statistics Canada, Labour Force Survey. | |||
Skill utilization stable among young Canadian-born workers, but decreased among recent immigrant workers
- Over the 2001 to 2016 period, the percentage of workers in jobs requiring a university degree stayed close to 60% among young Canadian-born workers with at least a bachelor’s degree.
- Over this period, the percentage of university-educated immigrants in high-skill jobs decreased from 46% to 38% among recent immigrants with a degree.
- Employment growth among young Canadian-born workers was concentrated in jobs requiring a university education, while the growth among recent immigrants with a degree was in jobs not requiring a university education.

Data table
| Year | Immigrants in Canada for 10 years or less | Canadian-born workers aged 25 to 34 |
|---|---|---|
| percent | ||
| 2001 | 45.7 | 58.6 |
| 2006 | 41.7 | 60.1 |
| 2011 | 41.1 | 60.9 |
| 2016 | 37.7 | 59.0 |
| Source: Statistics Canada, Census of Population. | ||
For more information: Hou et al. (2019). Recent trends in over-education by immigration status.
The employment gap between new immigrants and Canadian-born workers smallest in a decade
- Since the early 2010s, recent immigrants experienced faster growth in the employment rate than Canadian-born workers—an 8-percentage-point increase from 2010 to 2021, compared with a 2-percentage-point increase among Canadian-born workers.
- The employment rate gap between recent immigrant workers and Canadian-born workers decreased from 13 percentage points in 2010 to 7 percentage points in 2021.
- The COVID-19 pandemic had a similar impact on the employment rate by immigration status.

Data table
| Year | Immigrants in Canada for 10 years or less | Immigrants in Canada for more than 10 years | Canadian-born |
|---|---|---|---|
| percent | |||
| 2006 | 70.3 | 82.0 | 83.1 |
| 2007 | 70.5 | 82.2 | 83.8 |
| 2008 | 70.6 | 81.7 | 84.1 |
| 2009 | 68.1 | 79.3 | 82.1 |
| 2010 | 68.6 | 79.4 | 82.4 |
| 2011 | 68.9 | 79.8 | 82.9 |
| 2012 | 70.9 | 80.4 | 83.2 |
| 2013 | 71.6 | 80.6 | 83.3 |
| 2014 | 70.9 | 79.9 | 83.1 |
| 2015 | 70.9 | 80.9 | 83.3 |
| 2016 | 72.4 | 80.7 | 83.2 |
| 2017 | 73.6 | 82.0 | 84.0 |
| 2018 | 75.5 | 82.1 | 84.5 |
| 2019 | 75.6 | 83.1 | 85.2 |
| 2020 | 71.8 | 77.8 | 81.7 |
| 2021 | 76.6 | 80.7 | 83.9 |
| Source: Statistics Canada, Labour Force Survey. | |||
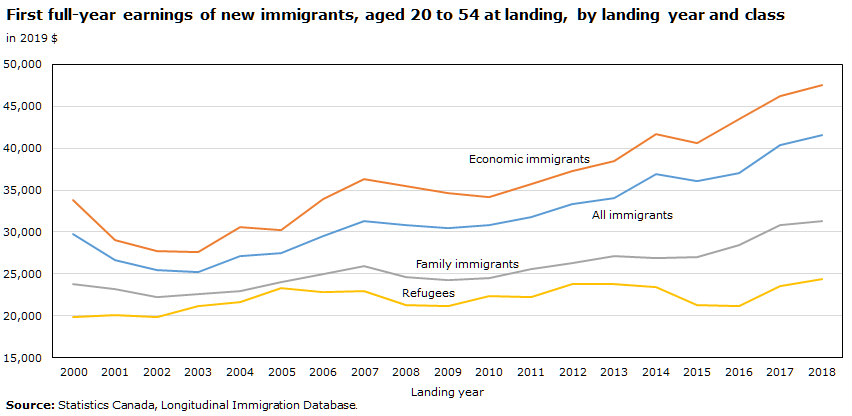
Steady increase in the initial earnings of new economic immigrants
- Earnings in the first full year rose 39% among economic immigrants between the 2010 and 2018 entry cohorts, driving the trend for all new immigrants.
- Earnings growth was also large among family class immigrants—27%.
- Growth among refugees was 9%.
Data table
| Landing year | All immigrants | Economic immigrants | Family immigrants | Refugees |
|---|---|---|---|---|
| in 2019 $ | ||||
| 2000 | 29,701 | 33,869 | 23,798 | 19,870 |
| 2001 | 26,691 | 29,041 | 23,184 | 20,065 |
| 2002 | 25,468 | 27,752 | 22,215 | 19,913 |
| 2003 | 25,207 | 27,637 | 22,579 | 21,123 |
| 2004 | 27,127 | 30,605 | 23,002 | 21,681 |
| 2005 | 27,449 | 30,240 | 24,038 | 23,305 |
| 2006 | 29,496 | 33,949 | 24,949 | 22,827 |
| 2007 | 31,251 | 36,275 | 25,942 | 22,914 |
| 2008 | 30,876 | 35,538 | 24,673 | 21,284 |
| 2009 | 30,450 | 34,643 | 24,282 | 21,197 |
| 2010 | 30,878 | 34,156 | 24,555 | 22,372 |
| 2011 | 31,806 | 35,731 | 25,636 | 22,244 |
| 2012 | 33,385 | 37,242 | 26,277 | 23,792 |
| 2013 | 34,106 | 38,430 | 27,105 | 23,761 |
| 2014 | 36,963 | 41,669 | 26,888 | 23,426 |
| 2015 | 36,047 | 40,573 | 27,014 | 21,317 |
| 2016 | 36,995 | 43,489 | 28,405 | 21,142 |
| 2017 | 40,372 | 46,266 | 30,846 | 23,584 |
| 2018 | 41,563 | 47,571 | 31,285 | 24,415 |
| Source: Statistics Canada, Longitudinal Immigration Database. | ||||
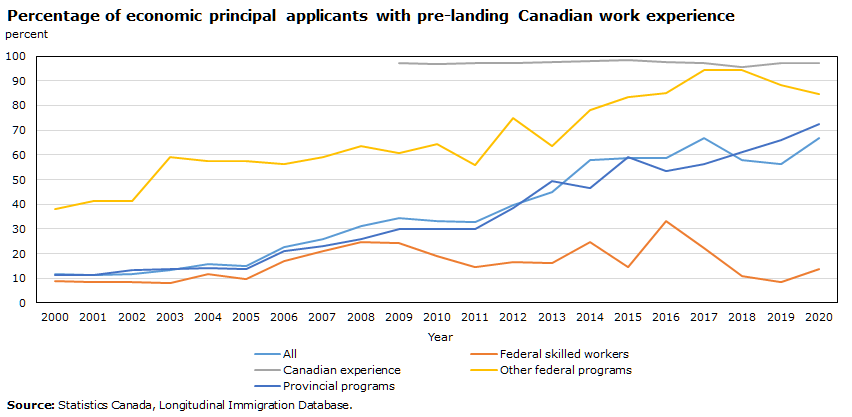
The recent improvement in labour market outcomes is partly related to the two-step selection of economic immigrants
- Among economic principal applicants who landed in 2020, about 67% worked in Canada before immigration, an increase from 12% in 2000 and 33% in 2010.
- This increase was related to the expansion of provincial programs that relied more on TFWs and the introduction of the Canadian Experience Class.
- The increased reliance on TFWs tended to improve the economic outcomes of immigrants.
Data table
| Year | All | Federal skilled workers | Canadian experience | Other federal programs | Provincial programs |
|---|---|---|---|---|---|
| percent | |||||
| 2000 | 11.62 | 8.86 | Note ...: not applicable | 38.19 | 11.29 |
| 2001 | 11.22 | 8.33 | Note ...: not applicable | 41.13 | 11.42 |
| 2002 | 11.57 | 8.41 | Note ...: not applicable | 41.45 | 13.21 |
| 2003 | 13.20 | 8.05 | Note ...: not applicable | 59.06 | 13.87 |
| 2004 | 15.90 | 11.54 | Note ...: not applicable | 57.65 | 14.23 |
| 2005 | 15.06 | 9.82 | Note ...: not applicable | 57.60 | 13.88 |
| 2006 | 22.77 | 17.07 | Note ...: not applicable | 56.11 | 20.95 |
| 2007 | 25.95 | 21.14 | Note ...: not applicable | 59.16 | 22.98 |
| 2008 | 31.18 | 24.53 | Note ...: not applicable | 63.71 | 26.09 |
| 2009 | 34.60 | 24.37 | 97.07 | 60.89 | 29.95 |
| 2010 | 33.06 | 19.01 | 97.00 | 64.49 | 29.79 |
| 2011 | 32.86 | 14.37 | 97.37 | 55.96 | 30.03 |
| 2012 | 39.70 | 16.75 | 97.22 | 74.84 | 38.51 |
| 2013 | 45.08 | 16.01 | 97.64 | 63.50 | 49.28 |
| 2014 | 57.86 | 24.59 | 98.18 | 78.32 | 46.47 |
| 2015 | 58.74 | 14.47 | 98.34 | 83.33 | 59.25 |
| 2016 | 58.57 | 33.15 | 97.74 | 85.13 | 53.46 |
| 2017 | 67.00 | 22.30 | 97.12 | 94.52 | 56.23 |
| 2018 | 58.01 | 10.86 | 95.51 | 94.40 | 60.97 |
| 2019 | 56.48 | 8.60 | 97.06 | 88.30 | 65.95 |
| 2020 | 66.72 | 13.68 | 97.19 | 84.76 | 72.41 |
|
... not applicable Source: Statistics Canada, Longitudinal Immigration Database. |
|||||
For more information: Hou et al. (2020). Two-step immigration selection: Recent trends in immigrant labour market outcomes.
Temporary foreign workers account for a rising share of the employed labour force
- In 2019, TFWs accounted for 4.1% of the total T4 earners in Canada, a large increase from 1.9% in 2010.
- The reliance on TFWs is particularly high in the agriculture (15%), the accommodation and food services (10%) and the administrative and support, waste remediation management services (10%) sectors.
- TFWs are also overrepresented in the professional, scientific, and technical services sector and in the information and cultural industries.

Data table
| Class title | 2010 | 2019 |
|---|---|---|
| percent | ||
| Agriculture, forestry, fishing and hunting | 7.8 | 14.7 |
| Mining, quarrying, and oil and gas extraction | 0.9 | 1.0 |
| Utilities | 0.5 | 0.7 |
| Construction | 1.1 | 2.0 |
| Manufacturing | 1.2 | 3.4 |
| Wholesale trade | 1.2 | 3.2 |
| Retail trade | 1.3 | 5.0 |
| Transportation and warehousing | 0.9 | 3.4 |
| Information and cultural industries | 1.4 | 4.7 |
| Finance and insurance | 0.8 | 2.2 |
| Real estate and rental and leasing | 2.2 | 3.2 |
| Professional, scientific and technical services | 2.5 | 5.5 |
| Management of companies and enterprises | 1.6 | 3.4 |
| Administrative and support, waste management and remediation services | 2.9 | 9.7 |
| Educational services | 2.4 | 3.6 |
| Health care and social assistance | 0.8 | 1.3 |
| Arts, entertainment and recreation | 3.7 | 5.0 |
| Accommodation and food services | 4.6 | 9.9 |
| Other services (except public administration) | 4.2 | 2.7 |
| Public administration | 0.1 | 0.2 |
| Overall | 1.9 | 4.1 |
| Source: Statistics Canada, 2021 Longitudinal Immigration Database, the T4 file and National Accounts Longitudinal Microdata File. | ||
For more information: Lu & Hou (2019). Temporary foreign workers in the Canadian labour force: Open versus employer-specific work permits.
Higher rate of transition to permanent residency among temporary foreign workers with lower occupational skills
- From the early 2000s to early 2010s, the share of higher-skilled TFWs decreased from 58% to 44%, while the share of lower-skilled TFWs increased from 32% to 39%.
- Higher-skilled TFWs have more pathways to apply for permanent residency but have a lower transition rate than lower-skilled TFWs.
- Opportunities and motivations jointly determine the transition rate.

Data table
| Period of obtaining the first work permit | |||
|---|---|---|---|
| 2000 to 2004 | 2005 to 2009 | 2010 to 2014 | |
| percent | |||
| Higher-skilled | 11.34 | 21.99 | 26.69 |
| Lower-skilled | 29.63 | 29.90 | 29.65 |
| Skill level undetermined | 23.11 | 17.79 | 13.40 |
| Source: Statistics Canada, Longitudinal Immigration Database and the T4 file. | |||
For more information: Picot et al. (2022). Transition to permanent residency by lower- and higher-skilled temporary foreign workers.
International students have become an important source of labour supply
- Between 2000 and 2019, the number of international students with T4 earnings increased from 22,000 to 354,000.
- This was a result of the increasing number of international students and their rising labour force participation rate (from 18% to 50%).
- The increases were particularly large at the non-university postsecondary level where the labour force participation rate rose from 7% to 58%, and the number of participants rose from 3,000 to 173,000.
- The largest increased occurred after 2015.

Data table
| Year | Non-university postsecondary | Undergraduate | Graduate | Other | Total |
|---|---|---|---|---|---|
| person | |||||
| 2000 | 2,710 | 6,340 | 8,130 | 4,650 | 21,830 |
| 2001 | 3,480 | 7,970 | 8,930 | 4,740 | 25,120 |
| 2002 | 4,040 | 9,130 | 10,030 | 5,110 | 28,310 |
| 2003 | 4,950 | 10,460 | 11,680 | 5,680 | 32,770 |
| 2004 | 5,740 | 11,780 | 12,700 | 5,120 | 35,340 |
| 2005 | 6,470 | 14,540 | 13,780 | 5,100 | 39,890 |
| 2006 | 7,890 | 18,290 | 14,810 | 5,100 | 46,090 |
| 2007 | 9,660 | 22,070 | 15,480 | 5,740 | 52,950 |
| 2008 | 10,610 | 23,260 | 16,140 | 6,800 | 56,810 |
| 2009 | 11,630 | 21,700 | 17,360 | 7,520 | 58,210 |
| 2010 | 14,250 | 21,200 | 18,990 | 7,920 | 62,360 |
| 2011 | 19,010 | 22,240 | 21,320 | 8,270 | 70,840 |
| 2012 | 24,190 | 24,040 | 24,320 | 10,020 | 82,570 |
| 2013 | 28,280 | 26,360 | 27,640 | 12,190 | 94,470 |
| 2014 | 33,420 | 31,080 | 29,460 | 12,590 | 106,550 |
| 2015 | 30,310 | 32,400 | 26,340 | 9,190 | 98,240 |
| 2016 | 50,050 | 37,800 | 28,770 | 13,090 | 129,710 |
| 2017 | 98,900 | 49,690 | 41,160 | 23,690 | 213,440 |
| 2018 | 146,120 | 61,960 | 51,630 | 36,420 | 296,130 |
| 2019 | 173,790 | 75,150 | 60,570 | 43,980 | 353,490 |
| Source: Statistics Canada, Longitudinal Immigration Database and T4 file. | |||||
For more information: Crossman et al. (2022). International students as a source of labour supply: Engagement in the labour market during the period of study.
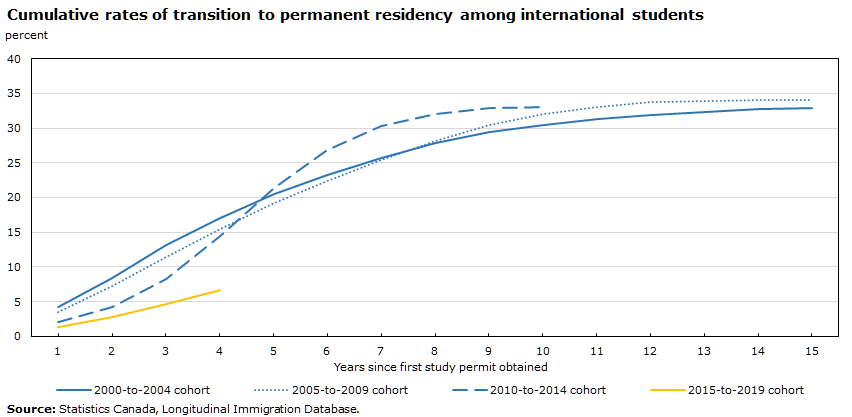
Many international students transition to permanent residency
- One-third of international students who arrived in the late 2000s and early 2010s became permanent residents within 10 years of being in Canada.
- A declining share is moving directly from study to permanent residency, and an increasing share is obtaining a postgraduate work permit before the transition.
- The transition rate reached 50% for students at the graduate level and 60% for those with Canadian work experience.
Data table
| Years since first study permit obtained | 2000-to-2004 cohort | 2005-to-2009 cohort | 2010-to-2014 cohort | 2015-to-2019 cohort |
|---|---|---|---|---|
| percent | ||||
| 1 | 4.3 | 3.5 | 2.0 | 1.4 |
| 2 | 8.4 | 7.3 | 4.2 | 2.8 |
| 3 | 13.1 | 11.4 | 8.3 | 4.7 |
| 4 | 17.1 | 15.4 | 14.5 | 6.7 |
| 5 | 20.5 | 19.2 | 21.4 | Note ...: not applicable |
| 6 | 23.3 | 22.4 | 26.8 | Note ...: not applicable |
| 7 | 25.7 | 25.4 | 30.3 | Note ...: not applicable |
| 8 | 27.8 | 28.2 | 32.1 | Note ...: not applicable |
| 9 | 29.4 | 30.5 | 32.9 | Note ...: not applicable |
| 10 | 30.5 | 32.1 | 33.1 | Note ...: not applicable |
| 11 | 31.3 | 33.1 | Note ...: not applicable | Note ...: not applicable |
| 12 | 31.9 | 33.7 | Note ...: not applicable | Note ...: not applicable |
| 13 | 32.3 | 33.9 | Note ...: not applicable | Note ...: not applicable |
| 14 | 32.7 | 34.0 | Note ...: not applicable | Note ...: not applicable |
| 15 | 32.9 | 34.0 | Note ...: not applicable | Note ...: not applicable |
|
... not applicable Source: Statistics Canada, Longitudinal Immigration Database. |
||||
For more information: Choi et al. (2021). International students as a source of labour supply: Transition to permanent residency.
Takeaways
- As businesses emerge from the COVID-19 pandemic, healthy immigration flows are essential to addressing the unmet demand for both high- and low-skilled workers in many sectors. Over the longer term, higher immigration flows will be critical for (partly) mitigating the impacts of Canada’s aging population on the labour market.
- The labour market outcomes of recent immigrants improved substantially in the years leading up to the pandemic. TFWs and international students, both of whom are transitioning to permanent residency in greater numbers, have become increasingly important sources of labour supply.
- While economic outcomes of recent immigrants have improved, substantial challenges related to their skill utilization continue to persist (including barriers related to credential recognition). Addressing these challenges will be key to improving social and economic mobility among newcomers while enhancing the skills and competitiveness of our workforce.
- Date modified: