Canadian Housing Statistics Program, 2020
Archived Content
Information identified as archived is provided for reference, research or recordkeeping purposes. It is not subject to the Government of Canada Web Standards and has not been altered or updated since it was archived. Please "contact us" to request a format other than those available.
Released: 2022-07-19
Data from Manitoba and the Northwest Territories for the 2020 reference year are now available from the Canadian Housing Statistics Program (CHSP). This is the first data release for Manitoba and an addition to the data released earlier this year for the Northwest Territories.
Compared with data for other provinces and territories, these new data show lower shares of properties owned by non-residents in Manitoba and the Northwest Territories. Sales data also indicate higher rates of buying among recent immigrants and people younger than 35 in Manitoba.
Non-resident ownership rates in Manitoba and the Northwest Territories among the lowest
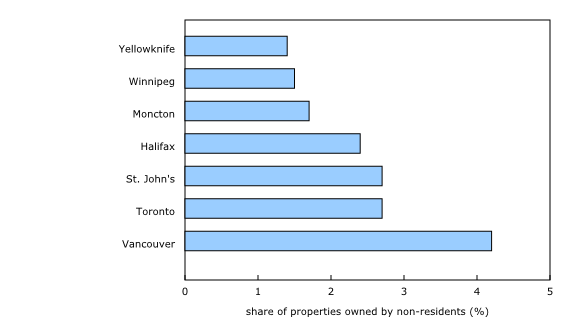
In the provinces and territories currently covered by the CHSP (see note to readers), Manitoba and the Northwest Territories had among the lowest rates of non-resident ownership in 2020, although data from the Northwest Territories are limited to the census agglomeration (CA) (see the definition in the note to readers) of Yellowknife. Only Nunavut (1.3%) had a lower proportion of properties owned by non-residents than the Northwest Territories (1.4%) or Manitoba (1.5%). The lowest rate of non-resident ownership in Manitoba was found among single-detached houses (1.2%), while it reached 3.0% among condominium apartments.
When the largest census metropolitan areas (CMAs) (see the definition in the note to readers) or CAs in each province or territory are compared, the rates of non-resident ownership were lowest in Yellowknife (1.4%) and Winnipeg (1.5%).
In Manitoba, the proportion of properties owned by non-residents was comparable across urban and rural regions, with the rate in the CMA of Winnipeg in line with the provincial average.
Manitoba: A land of (homeownership) opportunity
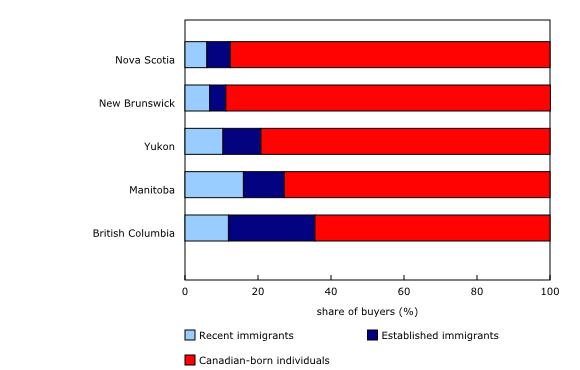
Analysis of real estate sales for the 2019 calendar year reveals that the share of recent immigrant buyers was relatively high in Manitoba, compared with other provinces and territories. Recent immigrants are defined here as those who have arrived in Canada since 2010.
In Manitoba, 16.0% of all buyers were recent immigrants, a higher proportion than in British Columbia (11.9%), Yukon (10.4%), New Brunswick (6.8%) and Nova Scotia (6.0%). By contrast, the share of established immigrant buyers—those who arrived in Canada before 2010—was lower in Manitoba (11.2%) than in British Columbia (23.7%), but higher than in the two other provinces and one territory.
These figures for immigrant buyers partially reflect the level of immigration in each province or territory. According to the 2016 Census, immigrants made up 18.3% of the population in Manitoba, compared with 28.3% in British Columbia, 12.6% in Yukon, 6.1% in Nova Scotia and 4.6% in New Brunswick. These results are also consistent with findings that show that a higher share of immigrants are settling in the Prairie provinces than in the past.
Lower prices help explain the ability of recent immigrants to purchase real estate, as the overall median sale price of properties in Manitoba was $258,000 in 2019, less than half the median price of properties sold in British Columbia in the same year ($552,000). However, the median price of properties purchased by recent immigrants in Manitoba ($292,000) was higher than the median for all buyers. In addition, the median price-to-income ratio of recent immigrants—which reflects the level of financial burden faced by buyers when purchasing residential real estate—was 3.4, higher than the median for all buyers (2.6) in the province.
Purchasing as a group may also help recent immigrants afford homeownership. CHSP data show that a majority of recent immigrants in Manitoba purchased their property either as a pair (80.4%) or in a group of three or more (6.1%), while 13.5% were single buyers. Among recent immigrants, the rates of single buyers were higher in the other provinces, including British Columbia (26.2%), where housing prices were significantly higher.
A previous CHSP release in 2021 showed that most immigrant buyers were admitted to Canada through economic entry categories, where applicants are highly skilled or have previous work experience. This holds in Manitoba, where approximately four out of five recent immigrant buyers (81.9%) were admitted through economic categories. Among all recent immigrant buyers, 73.8% entered Canada through the Provincial Nominee Program.
The share of recent immigrants among all property owners in Manitoba in 2020 was also higher than in other provinces and territories, as they represented 6.2% of all owners, the highest rate among provinces and territories currently covered by the CHSP. Manitoba was followed by British Columbia and Yukon, each at 4.4%, and Ontario, at 4.1%.
A high rate of young homebuyers in Manitoba
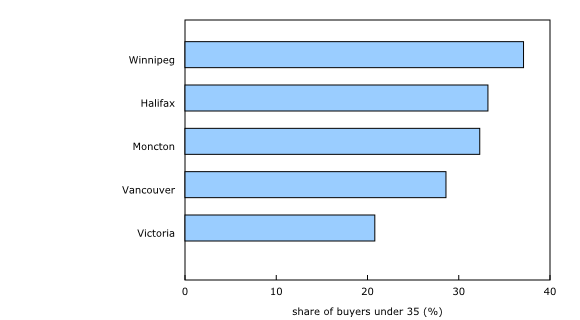
Data on sales that occurred during the 2019 calendar year show that buyers younger than 35 comprised 36.6% of all buyers in Manitoba, a higher proportion than in the other provinces or territories where data are available. Consistent with this finding, the median age of buyers in Manitoba was 39, lower than the median age observed in the other provinces or territories.
This can partly be accounted for by a higher share of the population in Manitoba in the 20 to 34 age range. According to the 2021 Census, 20.4% of the population in Manitoba was in this age range, lower than in Yukon (20.5%) but higher than in British Columbia (19.8%), Nova Scotia (18.4%) and New Brunswick (16.5%).
In Manitoba, the rate of buyers younger than 35 was highest in the CAs of Thompson (45.0%) and Winkler (42.9%) and lowest outside CMAs and CAs (34.2%). In the CMA of Winnipeg, the share of young buyers was 37.1%, which was the highest rate among the largest provincial CMAs covered by the CHSP's current sales data.
The median price of properties bought by those younger than 35 was $260,000 in Manitoba, which is half the figure in British Columbia ($520,000). This results in a median price-to-income ratio for young buyers of 2.8 in Manitoba, compared with 4.5 for buyers in this age group in British Columbia. These findings point to a better housing affordability situation in Manitoba relative to British Columbia.
Note to readers
The Canadian Housing Statistics Program (CHSP) currently covers the following provinces and territories: Newfoundland and Labrador, Nova Scotia, New Brunswick, Ontario, Manitoba, British Columbia, Yukon, the Northwest Territories, and Nunavut. Sales data are currently available for Nova Scotia, New Brunswick, Manitoba, British Columbia and Yukon.
Data for the 2020 reference year reflect the stock of properties available on the property assessment roll for each province and territory for that year. The exact stock date varies between provinces and territories. Buyers in 2019 are owners who purchased a property during the 2019 calendar year.
The universe of homebuyers is restricted to individual resident owners who filed their T1 tax return form in 2019 and purchased a property in a market sale. A market sale refers to an arm's length transaction where all parties act independently with no influence over the other.
The breakdown of property types between semi-detached and row houses is not available in Manitoba. No data are available for the period of construction or for living area for the Northwest Territories.
In Manitoba, 1.8% of properties had unknown owners. Statistics related to property counts in this article include those properties.
In Yukon, information on the residency status of residential properties is only available for the census subdivision of Whitehorse.
The property use variable is not available outside census metropolitan areas (CMAs) or census agglomerations (CAs) for all provinces and territories.
A property may have more than one owner or an owner may have more than one property; thus, the counts of owners and properties can differ.
Geographical boundaries
The CHSP disseminates data based on the geographical boundaries from the 2016 Standard Geographical Classification. The CHSP database does not contain information about residential properties on Indian reserves.
In the Northwest Territories, data are available only for the CA of Yellowknife.
Definitions
A census metropolitan area (CMA) or a census agglomeration (CA) is formed by one or more adjacent municipalities centred on a population centre (known as the core). A CMA must have a total population of at least 100,000 of which 50,000 or more must live in the core. A CA must have a core population of at least 10,000. To be included in the CMA or CA, other adjacent municipalities must have a high degree of integration with the core, as measured by commuting flows derived from previous census place of work data.
The largest CMAs and CAs refer to the most populated CMAs or CAs in each province and territory, based on the population from the 2021 Census.
The price-to-income ratio refers to the ratio between the sale price of the property and the income of its buyers, reported at the property level. That is, the income of buyers is measured as the sum of the individual income of all buyers on the title of the property purchased.
Products
The latest issue of Housing Statistics in Canada (46280001) is available. This issue contains the product "Development of a Composite Quality indicator for Statistical Products Derived from Administrative Sources."
Contact information
For more information, or to enquire about the concepts, methods or data quality of this release, contact us (toll-free 1-800-263-1136; 514-283-8300; infostats@statcan.gc.ca) or Media Relations (statcan.mediahotline-ligneinfomedias.statcan@statcan.gc.ca).
- Date modified:


