Canadian Housing Statistics Program, 2019 and 2020
Archived Content
Information identified as archived is provided for reference, research or recordkeeping purposes. It is not subject to the Government of Canada Web Standards and has not been altered or updated since it was archived. Please "contact us" to request a format other than those available.
Released: 2022-01-06
Data from Newfoundland and Labrador, Nunavut and Yukon for the 2020 reference year and from the Northwest Territories for 2019 are now available from the Canadian Housing Statistics Program (CHSP).
These new data show trends specific to these new geographic areas, such as higher proportions of properties owned by firms and governments. Analyses also reveal how mining shaped the geographic distribution of residential properties built in Yukon between 1971 and 1990.
More than 4 in 10 properties in Iqaluit are not owned by individuals
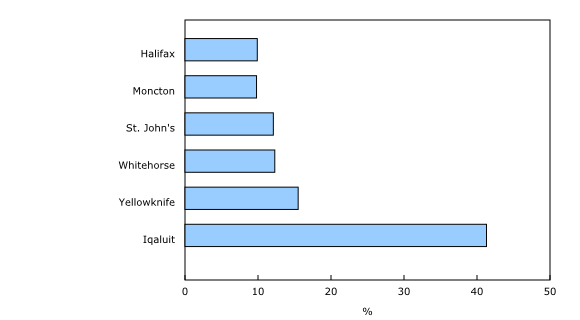
The Iqaluit census subdivision (CSD) stands out on account of a higher proportion (41.3%) of properties held by firms and governments, as compared with the biggest CSDs of the different provinces and territories, such as Yellowknife, Whitehorse, St. John's, Halifax and Moncton. This difference is due in part to the presence of government entities, which own 21.5% of all properties in Iqaluit, a CSD with different socioeconomic and environmental conditions than the others. Their presence is partly explained by higher construction costs in Iqaluit than in the other areas of Canada (1.4 MB, in PDF format only). Among public agencies, there is the Nunavut Housing Corporation, which according to its March 31, 2020 annual report (3.6 MB, in PDF format only), jointly managed 5,668 public housing units with 25 local organizations throughout Nunavut.
The proportion of properties not owned by individuals in Yellowknife (15.5%), Whitehorse (12.3%) and St. John's (12.1%) is lower than in Iqaluit, but higher than in Halifax (9.9%) and Moncton (9.8%). Once again, the strong presence of public entities partially explains this situation, given that they own 8.4% of all properties in Yellowknife, 6.1% in Whitehorse, and 6.0% in St. John's.
In Whitehorse and St. John's, over 1 in 5 residential properties owned by an individual are not owner-occupied
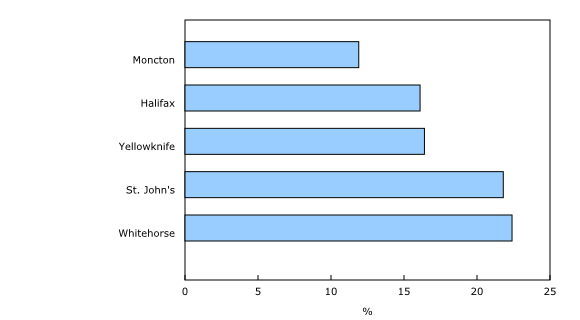
The new data also reveal that properties owned by individuals are more likely to not be owner-occupied in the CSDs of Whitehorse (22.4%) and St. John's (21.8%) than in Yellowknife, Moncton and Halifax. These properties may be rented out, vacant or used as a secondary residence.
The higher proportion of non-owner-occupied properties in St. John's is partly due to the greater share of properties with multiple residential units. Of these, 37.8% were not owner-occupied when owned by individuals.
The mining sector shaped real estate development in Yukon in the second half of the 20th century
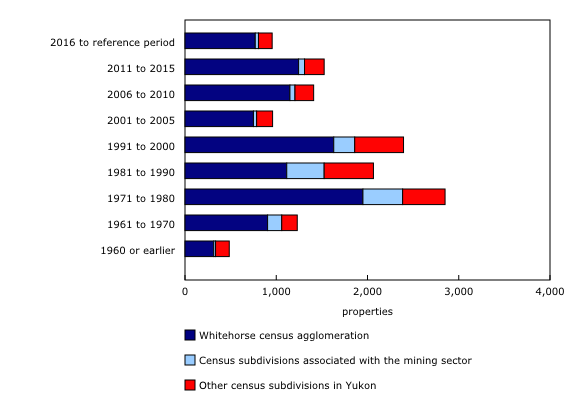
In the Yukon, a larger proportion of properties built between 1971 and 1990 are located in CSDs close to mining sites when compared with other construction periods, partially because of the growth in that industry. From 1968 to 1975, the total value of mining production in constant dollars increased almost sevenfold. In the mid-1970s, the Faro mine is believed to have contributed up to 20% of the territory's gross domestic product (8.2 MB, in PDF format only). The population in this CSD reached 1,652 residents in 1981; in contrast, the area was uninhabited in 1966 (0.3 MB, in PDF format only). During the 1980s, the value of mining production in Yukon remained higher than its historical average, with the exception of a trough recorded mid-decade. Thus, of the properties built between 1971 and 1980, 15.3% are located in six CSDs (Carmacks, Faro, Mayo, Ross River, Tagish and Watson Lake) that were associated with the mining sector at the time. This proportion rose to 19.9% of properties built between 1981 and 1990.
In total, over half (59.3%) of the housing stock in these areas was built between 1971 and 1990. Starting in the 1990s, several mines closed and construction decreased in municipalities associated with mining.
Among the properties built since 2006 in Yukon, 81.4% are in the census agglomeration (CA) of Whitehorse where population growth is higher than in the whole territory.
The Building Permits Survey provides a more detailed view of recent trends in the housing market. From July 2018 to June 2020 inclusively, building permits were issued for the construction of 703 dwellings in the Whitehorse CA. Statistics Canada's preliminary demographic estimates show an increase of 1,408 residents between July 1, 2018, and July 1, 2020, the equivalent of 2.0 new residents per dwelling unit to be built. In comparison, the 2016 Census recorded 2.3 individuals per private dwelling.
In the Yellowknife CA, building permits were issued for 89 dwellings from July 2018 to June 2020 inclusively, or the equivalent of 6.8 new residents per dwelling unit to be built. As a result, the pace at which the housing supply increased was inconsistent with population growth. In the last census, Yellowknife had 2.5 individuals per private dwelling.
Densification is on the rise in Whitehorse
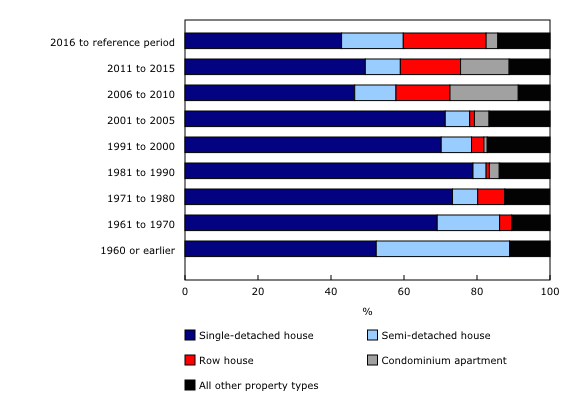
In the Whitehorse CA, the increase in the proportion of row houses and condominiums beginning in 2006 is consistent with the trend toward densification seen in the biggest census metropolitan areas (CMAs) across the country.
While row houses and condominium apartments represented 4.8% of the housing stock built in 2000 or earlier, they represented a larger proportion (33.5%) for the 2006–2010 construction period in the Whitehorse CA. This proportion remained historically high thereafter, reaching 29.7% for properties built between 2011 and 2015 and 26.0% for more recent properties.
Note to readers
Property use is not available for Nunavut or outside of census metropolitan areas (CMAs) and census agglomerations (CAs) for all provinces and territories. For Yukon, property use is available only in the census subdivision (CSD) of Whitehorse.
Data by property type are not available for Nunavut, the Northwest Territories or outside the St. John's CSD in Newfoundland and Labrador.
No data are available regarding the period of construction nor the living area for Nunavut and the Northwest Territories.
The most populated CSDs in each province and territory are used for Charts 1 and 2, based on the 2016 Census of Population.
The following CSDs are designated as having been historically associated with mining: Carmacks, Faro, Mayo, Ross River, Tagish and Watson Lake. This list is not comprehensive and excludes municipalities that are now abandoned.
The increase in the value of mining in constant dollars was calculated using nominal values adjusted for inflation.
Data from the Canadian Housing Statistics Program (CHSP) are for the number of properties, not the number of dwellings, which is higher.
The percentages of non-owner-occupied properties are calculated by excluding properties for which property use is not applicable, such as vacant land.
The number of residents used to calculate the ratio of new residents per dwelling to be built is based on the difference between the preliminary population estimate on July 1, 2020, and the population estimate on July 1, 2018. These estimates may change when the 2020 data are revised.
The number of persons per private dwelling according to the 2016 Census is calculated from the total count of private dwellings, regardless of their occupancy by usual residents.
The counts and distributions of properties are derived using the property classifications established by the CHSP. These may differ from those used by local authorities.
The complete information about the reference years of the property stock and assessment values by province and territory are available.
Geographical boundaries
The CHSP disseminates data based on the geographical boundaries from the Standard Geographical Classification 2016.
The CHSP database does not contain information about residential properties on Indian reserves.
In Newfoundland and Labrador, the provincial data are incomplete. Data are missing for 142 CSDs, which represent about 12.7% of the total population of the province according to the 2016 Census. No statistics are available for the province as a whole or for the category "Outside census metropolitan areas and census agglomerations."
In the Northwest Territories, data are available only for the Yellowknife CA.
Definitions
In Chart 4, the category "All other property types" includes mobile homes, properties with multiple residential units and other property types.
Property use refers to the use of a residential property by its owners. The property can be occupied by the owner, at least one of the owners or none of the owners on the property title.
Property owner refers to an individual or non-individual (such as a corporation, trust, state-owned entity or related group) that has property title transferred to, recorded in, registered in or otherwise carried in their name. A property may have more than one owner and an owner may have more than one property, thus the count of owners and properties can differ.
Housing stock refers to all residential properties in a given geographic region, excluding vacant land.
Products
The latest issue of Housing Statistics in Canada (46280001) is now available. This issue contains the product "Development of a Composite Quality indicator for Statistical Products Derived from Administrative Sources."
Contact information
For more information, contact us (toll-free 1-800-263-1136; 514-283-8300; infostats@statcan.gc.ca).
To enquire about the concepts, methods or data quality of this release, contact Jean-Philippe Deschamps-Laporte (jean-philippe.deschamps-laporte@canada.ca), Investment, Science and Technology Division.
- Date modified:


