Monthly civil aviation statistics, August 2020
Archived Content
Information identified as archived is provided for reference, research or recordkeeping purposes. It is not subject to the Government of Canada Web Standards and has not been altered or updated since it was archived. Please "contact us" to request a format other than those available.
Released: 2020-10-29
Highlights
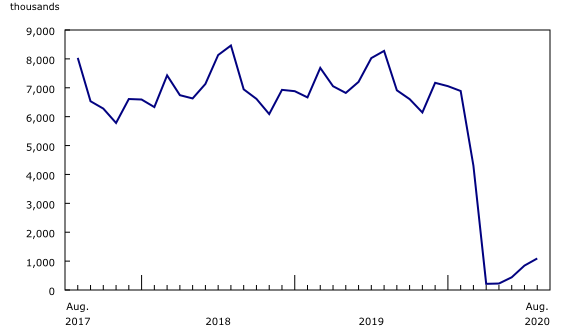
In August, typically the best month for the Canadian airline industry, there were signs of recovery, with the number of passengers surpassing one million for the first time since March.
Major Canadian airlines carried 1.1 million passengers on scheduled and charter services in August. While this was 29.1% more passengers than in July, it was down 86.8% from the same month in 2019.
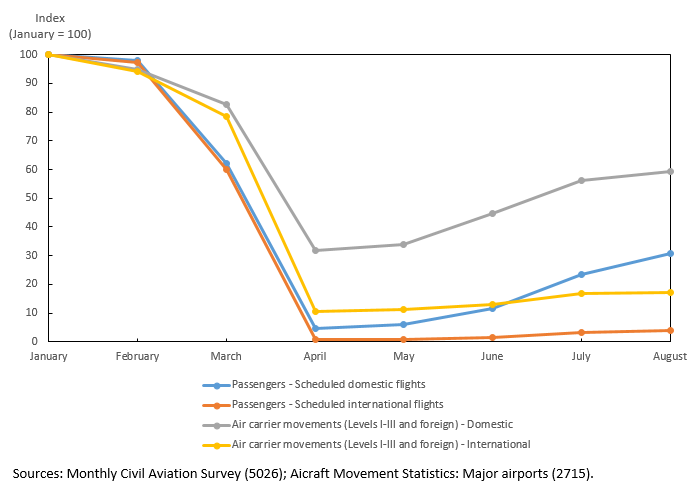
As in previous months, the recovery was largely driven by domestic travel as international demand remained generally weak amid border restrictions and quarantine enforcements.
Compared with August 2019, air traffic fell to 2.3 billion passenger-kilometres, pushing operating revenues down 87.4% to $343.0 million in August.
A disastrous summer travel season
Summer is usually the busiest season for air travel and normally generates revenue that helps airlines get through the winter, when demand is lower and expenses are higher due to additional costs such as aircraft de-icing. This summer, however, the COVID-19 pandemic resulted in lower demand and financial losses. The International Air Transport Association (IATA), which represents major airlines around the world, continues to warn of imminent bankruptcies and more job losses without additional government support.
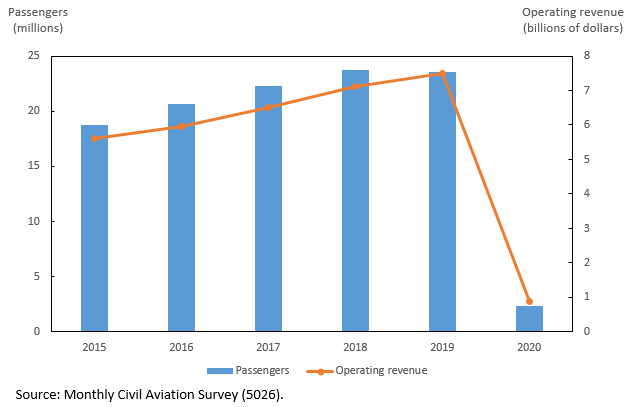
In the summer of 2020 (June to August), Canadian Level I air carriers flew 2.4 million passengers, which was 89.9% lower than in the same period in 2019. As a result, operating revenue generated from June to August totalled $881.1 million, down 88.2% compared with the same period last year. This was the industry's worst ever summer season.
Airlines are not the only ones struggling during the pandemic. For instance, airports and air navigation service providers are also experiencing severely reduced revenues. IATA has warned that rate hikes by airports and air navigation service providers could start a vicious cycle, where higher fees would keep consumers away from travelling, prolonging the crisis.
Passenger demand remains low despite some signs of recovery
Canadian Level I air carriers flew 1.1 million passengers on scheduled and charter services in August, down 86.8% from the same month in 2019. This marked the sixth consecutive year-over-year monthly decline—a period with the sharpest drop on record.
Year over year, the decline in August was less severe than in the previous four months, as the total passenger volume continued to increase gradually. This growth was underpinned by falling fares (the Consumer Price Index for air transportation fell 16.0% over the same period) and by domestic travel, as options for vacations abroad remained limited. Passenger volumes on international flights rose marginally in August, as did international air carrier movements (take-offs and landings) at major Canadian airports.
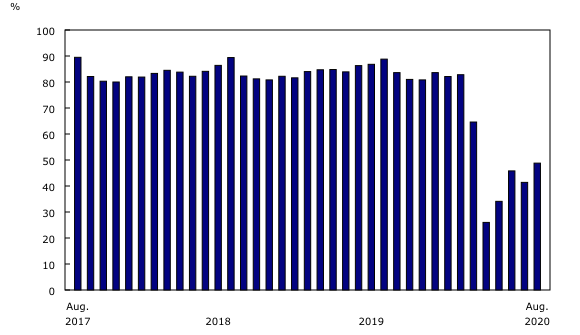
Traffic fell 90.3% year over year to 2.3 billion passenger-kilometres in August, while capacity contracted 82.3% to 4.7 billion available seat-kilometres. As a result, the passenger load factor—the ratio of passenger-kilometres to available seat-kilometres—dropped to 48.8%, down significantly from August 2019 (88.8%), but higher than in the previous four months in 2020.
With far fewer international flights available, each passenger travelled an average of 2,090 kilometres in August, down 26.3% from August 2019.
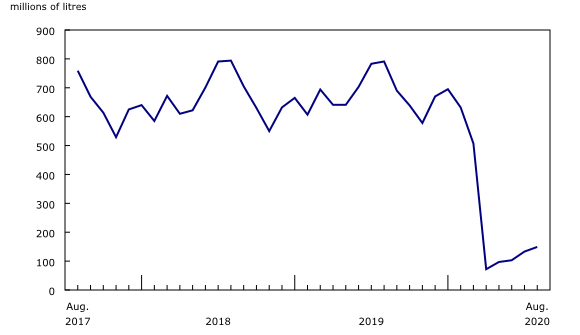
As the number of flying hours fell 81.0% to 40,000 in August, the volume of turbo fuel consumed declined 81.2% to 148.7 million litres.
Operating revenue earned by Level I carriers totalled $343.0 million in August, down 87.4% from $2.7 billion the same month a year earlier.
Note to readers
The Monthly Civil Aviation Survey covers all Canadian Level I air carriers: Air Canada (including Air Canada Rouge), Air Transat, Jazz, Porter, Sky Regional, Sunwing and WestJet (including Swoop, WestJet Encore and WestJet Link).
The number of air carriers increased from six in 2019 to seven in 2020, as one Level II air carrier was reclassified to Level I.
The average passenger trip length is obtained by dividing the number of passenger-kilometres by the number of passengers. Trips across Canada and the world are included in this calculation.
Data in this monthly release are not seasonally adjusted.
An international comparison of the impacts on civil aviation was recently released in StatCan COVID-19: Data to Insights for a Better Canada – "COVID-19 impacts on civil aviation: An international comparison."
Contact information
For more information, or to enquire about the concepts, methods or data quality of this release, contact us (toll-free 1-800-263-1136; 514-283-8300; STATCAN.infostats-infostats.STATCAN@canada.ca) or Media Relations (613-951-4636; STATCAN.mediahotline-ligneinfomedias.STATCAN@canada.ca).
- Date modified:


