Infographic 1
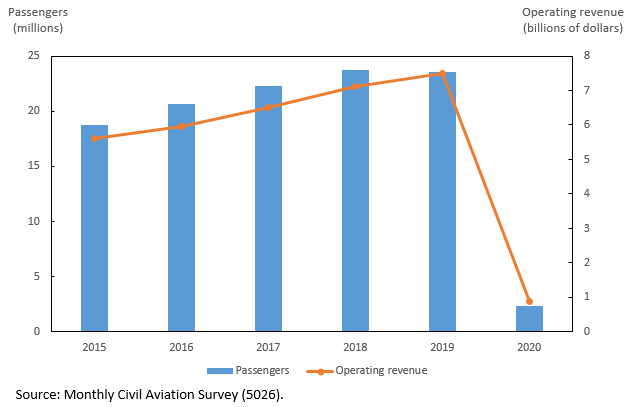
Passengers carried and operating revenue, Canadian Level I air carriers, June to August

Infographic description
The title of the infographic is "Passengers carried and operating revenue, Canadian Level I air carriers, June to August"
This is a combined column chart and line chart.
The primary vertical axis represents the number of passengers in millions. The primary vertical axis starts at zero and goes to 25 million with increments of 5 million.
The secondary vertical axis represents total operating revenue in billions of dollars. The secondary vertical axis starts at zero and goes to 8 billion with increments of 1 billion.
The horizontal axis represents the year and goes from 2015 to 2020 with increments of 1.
There are two time series. The first time series is shown as columns and represents the number of passengers carried by Canadian Level I air carriers in the months of June through August each year. The second time series is shown as a line and represents the total operating revenue of Canadian Level I air carriers in the months of June through August each year.
In 2015, the column (passengers carried by Canadian Level I air carriers in the months of June through August) is at 18.8 million, and the line (total operating revenue of Canadian Level I air carriers in the months of June through August) is at $5.6 billion.
In 2016, the column (passengers carried by Canadian Level I air carriers in the months of June through August) is at 20.7 million, and the line (total operating revenue of Canadian Level I air carriers in the months of June through August) is at $5.9 billion.
In 2017, the column (passengers carried by Canadian Level I air carriers in the months of June through August) is at 22.3 million, and the line (total operating revenue of Canadian Level I air carriers in the months of June through August) is at $6.5 billion.
In 2018, the column (passengers carried by Canadian Level I air carriers in the months of June through August) is at 23.7 million, and the line (total operating revenue of Canadian Level I air carriers in the months of June through August) is at $7.1 billion.
In 2019, the column (passengers carried by Canadian Level I air carriers in the months of June through August) is at 23.5 million, and the line (total operating revenue of Canadian Level I air carriers in the months of June through August) is at $7.5 billion.
In 2020, the column (passengers carried by Canadian Level I air carriers in the months of June through August) is at 2.4 million, and the line (total operating revenue of Canadian Level I air carriers in the months of June through August) is at $0.9 billion.
Source: Monthly Civil Aviation Survey (5026).
- Date modified: