
 StatCan COVID-19: Data to Insights for a Better CanadaCOVID-19 impacts on civil aviation: An international comparison

Archived Content
Information identified as archived is provided for reference, research or recordkeeping purposes. It is not subject to the Government of Canada Web Standards and has not been altered or updated since it was archived. Please "contact us" to request a format other than those available.
by C. Snoddon, V. Mordvinova, F. Doctoroff, L. Di Piétro and L. McKeown
Text begins

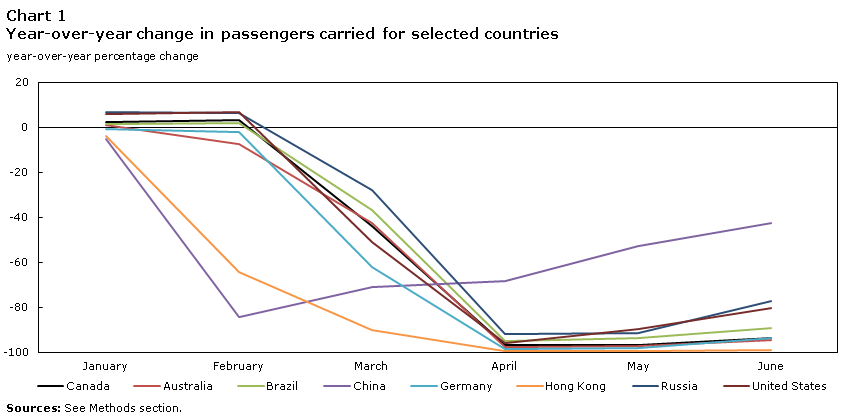
The new coronavirus (COVID-19) first began to affect air passenger volumes in China and Hong Kong during January of 2020. In February, governments around the world were advising against travel to China and, by mid-March, broad based travel restrictions were imposed to contain the virus. The impact of border closures and other restrictions was immediately felt on passenger airlines around the world. While the fallout in Canada has been compared to other disruptions, such as events of September 11th, 2001 and the 2003 SARS outbreak (see, Statistics Canada, 2020)Note 1, this study compares the aviation impacts internationally during the first half of 2020.
Steep decline begins in Asia
Both China and Hong Kong experienced large declines in passenger volumes during February as travel restrictions were imposed earlier in Asia. This was the nadir for China, after which volumes began to gradually climb with June reaching almost 60% of the June 2019 level, largely driven by domestic travel. In contrast, with no internal flights, Hong Kong volumes remained more or less flat over the same period after flirting with a 100% year-over-year drop in April.
With a travel market in close proximity, passenger volumes in Australia were starting to decline in February, but not nearly to the extent as China or Hong Kong. Australia followed a similar path to recovery as did many other countries after reaching a low point in April. Canada and the United States introduced travel restrictions in mid-March and passenger volumes began to fall sharply, also reaching a low during April. Then, a slow recovery began in both countries but the growth was noticeably stronger in the United States.
Data table for Chart 1
| Country | January | February | March | April | May | June |
|---|---|---|---|---|---|---|
| year-over-year percentage change | ||||||
| Canada | 2.5 | 3.3 | -44.1 | -97.0 | -96.7 | -93.9 |
| Australia | 1.1 | -7.6 | -42.5 | -97.5 | -97.3 | -94.6 |
| Brazil | 1.5 | 1.8 | -36.8 | -95.2 | -93.5 | -89.2 |
| China | -5.3 | -84.5 | -71.1 | -68.5 | -52.6 | -42.4 |
| Germany | -0.8 | -2.2 | -62.2 | -98.6 | -98.0 | -93.9 |
| Hong Kong | -3.8 | -64.4 | -90.0 | -99.6 | -99.4 | -99.1 |
| Russia | 6.8 | 6.4 | -28.1 | -92.1 | -91.3 | -77.4 |
| United States | 5.8 | 6.9 | -51.1 | -96.0 | -89.6 | -80.2 |
| Source: See Methods section. | ||||||
Large domestic markets help recovery
Russia introduced travel restrictions a week after North America, resulting in a smaller decline in air travel volumes in March. After having also reached a low point in April, it began to recover in a fashion similar to the United States (U.S). It is evident that countries with larger domestic markets recovered faster from the downturn than those relying more on international traffic.Note 2
During the first wave, the virus hit Europe particularly hard, notably in tourist destinations such as Italy and Spain. Compared to Canada, Germany experienced a larger initial drop in passenger volumes during March. Although a bigger economy, German air travel is integrated with that of Europe and its domestic travel market well served by alternatives such as high speed rail.
Finally in South America, Brazil imposed restrictions after North America. Brazilian passenger volumes were slower to decline but then have followed a similar trajectory to Canada. While it appears that a relatively larger domestic air travel market may have helped Brazil to recover somewhat faster by June, media reports suggest it continues to struggle with the virus.
Load factors plummet with pandemic
As the number of air passengers declined with the pandemic, load factors were falling as well, indicating that demand (revenue passenger-kilometres) was decreasing at a faster rate than supply (available seat-kilometres). The load factor in Canada, for example, had been near or above 80% pre-COVID, averaging over 83% from January 2015 to February 2020 for Canadian air carriers.
When travel restrictions were imposed in March, the load factor in Canada fell to 64.6% in March and then bottomed out at 26.0% in April. In the U.S., it first fell to 51.7% in March and then dropped to just over 14% in April. Since reaching these lows, load factors have improved in May and into June but remained below historical levels. In June, the load factor in Canada bounced back to 45.8% while it recovered faster in the U.S., up to 53.8%.

Data table for Chart 2
| Country | January | February | March | April | May | June |
|---|---|---|---|---|---|---|
| percent | ||||||
| Canada | 82.1 | 82.8 | 64.6 | 26.0 | 34.1 | 45.8 |
| China | 76.7 | 50.3 | 58.6 | 66.3 | 68.5 | 70.3 |
| United States | 79.8 | 79.2 | 51.7 | 14.1 | 37.9 | 53.8 |
| World | 80.3 | 75.9 | 60.6 | 36.6 | 50.7 | 57.6 |
| Source: See Methods section. | ||||||
The load factor in China reflected both an earlier downturn and a faster recovery. Compared to the rest of the world, North American carriers followed a similar trajectory with a small lag, falling in the first quarter and reaching a low in April followed by a gradual recovery. As was the case for most countries outside Asia, the full impact of travel restrictions to contain the spread of COVID-19 was seen in April when the aggregate load factor reached its lowest level. The load factor as a metric however, reflects elements of both demand and supply.
The outlook for a near-term recovery in global commercial air traffic remains uncertain with the International Air Transport Association warning airlines to avoid expanding schedules (i.e. adding seat-kilometres) that outpace demand (passenger-kilometres). Heeding the warning, some Canadian carriers resumed limited operations in the third quarter of 2020 while another is slated to re-start in the fourth quarter. Canada’s two largest airlines have cancelled hundreds of flights in September amid a resurgent health crisis that is prolonging the travel industry’s woes.Note 3
Methods
Data were gathered on the number of air passengers, passenger-kilometres and available seat kilometres (i.e. supply) from selected countries based on availability and comparability as well as geography. The passenger load factor is calculated by dividing the revenue passenger-kilometres by the available seat-kilometres for a given time period. The sources of data for each country included in this study are identified below.
Australia: Bureau of Infrastructure, Transport and Regional Economics (BITRE), Aviation Statistics.
Brazil: National Civil Aviation Agency, Demand and supply of air transport.
Canada: Monthly Civil Aviation Survey (5026).
China: Civil Aviation Administration of China, Statistics of Key Performance Indicators for China’s Civil Aviation Industry in January, February, March, April, May and June 2020.
Germany: Eurostat, Air passenger transport by reporting country.
Hong Kong: Cathay Pacific Group (Cathay Pacific and Cathay Dragon) Combined Traffic Figures for January, February, March, April, May and June 2020.
Russia: Federal State Statistic Service, Main indicators of carrying activity of transport, Passengers carried by mode of transport; Federal Air Transport Agency, Statistical data, Main performance indicators for civil aviation.
U.S: U.S Bureau of Transportation Statistics (BTS), Air Carrier Summary: T1 US Air Carrier Traffic and Capacity. Summary by Service Class.
World: International Air Transport Association (IATA), Air Passenger Market Analysis, January, February, March, April, May and June 2020. March 4, 2020, April 2, 2020, April 29, 2020, June 3, 2020, July 1, 2020 and July 28, 2020.
- Date modified: