Payroll employment, earnings and hours, August 2020
Archived Content
Information identified as archived is provided for reference, research or recordkeeping purposes. It is not subject to the Government of Canada Web Standards and has not been altered or updated since it was archived. Please "contact us" to request a format other than those available.
Released: 2020-10-29
$1,114.37
August 2020
7.9% 
(12-month change)
$1,133.04
August 2020
5.6% 
(12-month change)
$963.96
August 2020
10.4% 
(12-month change)
$962.38
August 2020
6.0% 
(12-month change)
$994.66
August 2020
5.7% 
(12-month change)
$1,055.79
August 2020
9.1% 
(12-month change)
$1,153.36
August 2020
9.0% 
(12-month change)
$988.83
August 2020
4.3% 
(12-month change)
$1,100.32
August 2020
6.9% 
(12-month change)
$1,214.07
August 2020
4.1% 
(12-month change)
$1,094.20
August 2020
9.0% 
(12-month change)
$1,281.67
August 2020
9.7% 
(12-month change)
$1,550.20
August 2020
7.5% 
(12-month change)
$1,450.23
August 2020
1.0% 
(12-month change)
August data are now available from the Survey of Employment, Payrolls and Hours (SEPH), which provides monthly information on payroll employment, earnings and hours worked for Canada, the provinces and territories.
By August—five months following the onset of the COVID-19 economic shutdown—public health restrictions had substantially eased across the country and more businesses and workplaces had re-opened. Some measures remained in place, including physical distancing requirements and restrictions on large gatherings as well as international travel.
Since the beginning of the COVID-19 economic shutdown, Statistics Canada has been committed to capturing the impact of COVID-19 on the labour force. In conjunction with Labour Force Survey (LFS) data, SEPH data contribute to this understanding, in large part by providing detailed subsector and industry statistics.
SEPH provides an account of payroll employment, that is, the number of employees receiving pay or benefits (employment income) during a given month. The survey excludes the self-employed, owners and partners of unincorporated businesses and professional practices, and employees in the agricultural sector.
Payroll employment growth slows down in August
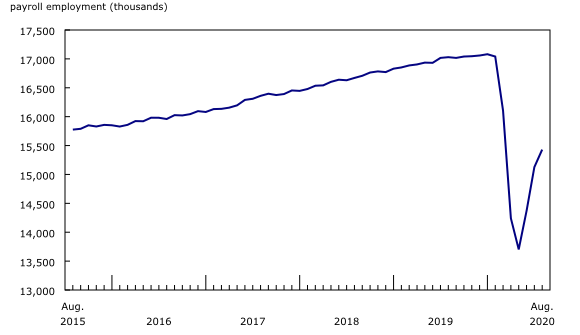
The number of employees receiving pay or benefits from their employer, measured in SEPH as payroll employment, rose by 303,200 (+2.0%) in August. This followed large increases in July (+759,500; +5.3%) and June (+665,500; +4.9%), and brought the total payroll employment change since February to a decrease of 1.6 million (-9.5%).
Total employment—as measured by the LFS—rose by 246,000 (+1.4%) in August, following an increase of 419,000 (+2.4%) in July and 953,000 (+5.8%) in June. This brought the total employment change since February to a decrease of 1.1 million (-5.7%).
Payroll employment closest to pre-COVID level in New Brunswick
In August, payroll employment increased in nearly all provinces, led by Nova Scotia (+2.7%; +10,300), Newfoundland and Labrador (+2.7%; +5,100) and Saskatchewan (+2.6%; +11,300). At the same time, there was little change in New Brunswick and Prince Edward Island. Consistent with August LFS results, among the provinces, payroll employment was closest to its pre-COVID (February) level in New Brunswick (-5.2%).
Hourly paid employees drive payroll employment rebound
While they represented less than 60% of all payroll employees in 2019, hourly paid employees accounted for roughly three-quarters of the decline in payroll employment from February to May 2020. Hourly paid employees tend to earn significantly less than salaried employees; in February 2020, for example, salaried employees earned an average of $1,410 per week, while hourly paid employees earned an average of $800 per week.
In August, for a third consecutive month, payroll employment growth was driven by hourly paid employees (+2.9%; +246,600). Following these gains, the number of hourly paid employees was 10.4% below its pre-COVID level, compared with -7.0% for salaried employees.
Average weekly earnings hold steady
Average weekly earnings held steady at $1,114 in August. On a year-over-over basis, however, they were up 7.9%, as job losses throughout the COVID-19 economic shutdown were more concentrated among lower-paid employees.
Little change in average hours worked
Following increases of 3.8% in June and 5.2% in July, total hours worked rose 1.0% in August. This growth brought total hours worked to 92.0% of the pre-COVID February level.
Month over month, average weekly hours worked were little changed at 33.4 hours. Average weekly hours worked were higher than in February (33.0 hours per week).
Employment continues to rise in both services-producing and goods-producing sectors
In August, payroll employment continued to increase in both the services-producing (+2.0%; +237,300) and the goods-producing (+2.0%; +54,000) sectors. In services, the largest monthly gain was in accommodation and food services (+72,900), while in goods, manufacturing had the largest increase (+28,700).
As the Canadian economy continues to recover and adapt to the impacts of COVID-19, some sectors face a longer path to recovery than others. In August, over 40% of the decline in payroll employment compared with February was in three sectors: accommodation and food services, retail trade, and arts, entertainment and recreation.
Long road to recovery in arts, entertainment and recreation
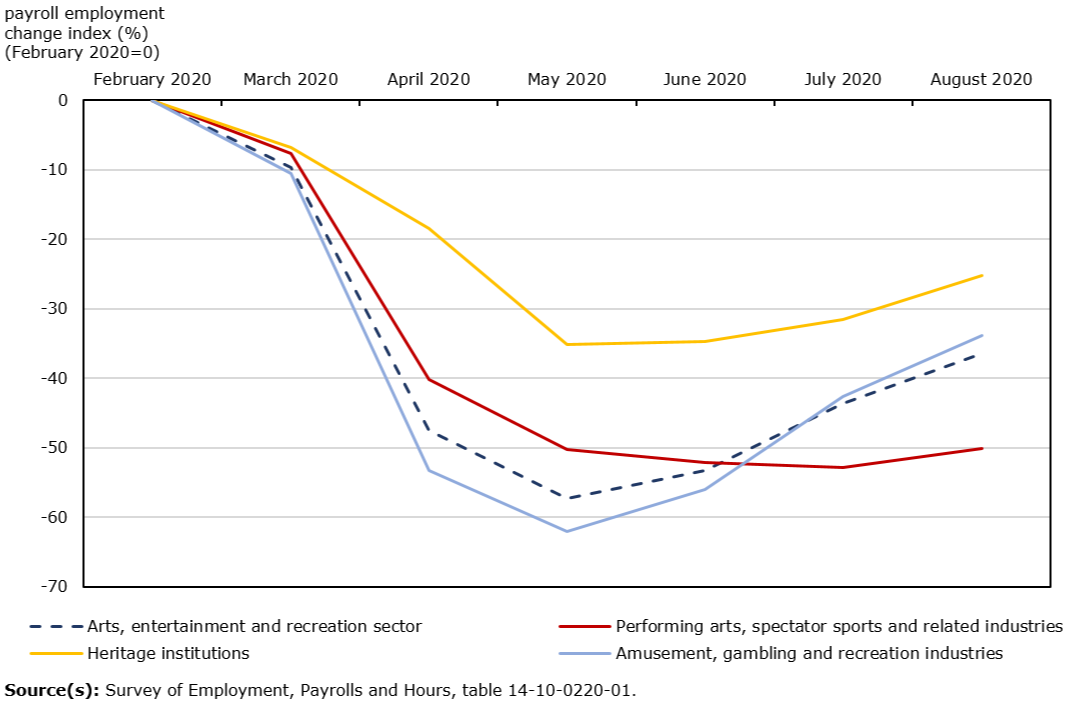
Payroll employment in arts, entertainment and recreation rose for the third consecutive month, up 12.9% (+22,800) in August, the fastest growth of all sectors. This brought the total increase from May to August to 65,500 (+48.7%), with most of the gains coming from the other amusement and recreation industries, which includes golf, fitness and sports clubs.
Arts, entertainment and recreation consists of three subsectors: performing arts, spectator sports and related industries (31,900 payroll employees in August); heritage institutions (21,300 employees); as well as amusement, gambling and recreation industries (146,800 employees).
Despite the recent upward trend, employment in arts, entertainment and recreation was 36.4% (-114,600) below its February level. Payroll employment in the performing arts, spectator sports and related industries subsector has not recovered and has been hovering around 50% of its pre-COVID level since May. Within the subsector, promoters (presenters) of performing arts, sports and similar events (-58.2%; -15,900) as well as performing arts companies (-49.1%; -8,800) were the furthest from their pre-COVID employment levels. Among the three subsectors, heritage institutions was the closest to pre-COVID levels (-25.2%; -7,200). Based on results from the LFS, more than 40% of employees in heritage institutions were union members or covered by a collective agreement in 2019. This compares with less than 20% for the other two subsectors. The vast majority of employees in the heritage institution subsector were full-time employees in 2019.
Average weekly earnings in the arts, entertainment and recreation sector were $716 in August, up 13.1% on a year-over-year basis.
Employment in arts, entertainment and recreation faces a long road to recovery, especially in light of recent data showing that Canadians plan to reduce their spending on culture and recreation(see Expected changes in spending habits during the recovery period).
Continued growth in accommodation and food services in August
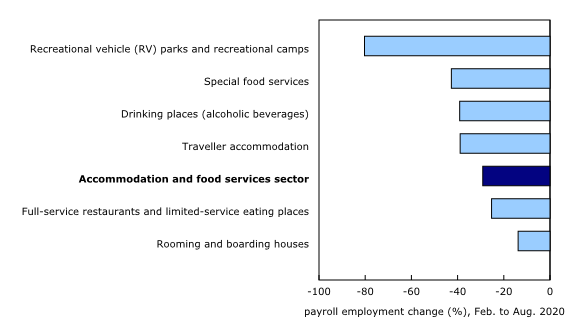
Payroll employment in accommodation and food services rose by 8.3% (+72,900) in August, driven by gains in the full-service restaurants and limited-service eating places as well as the traveller accommodation industries. Provincially, Ontario recorded the largest increase as restrictions continued to ease for all regions of the province in August. Nationally, employment continued to decline in the recreational vehicle parks and recreational camps industry, down by 45.6% (-2,800) in August and by 80.3% (-13,800) since February.
While accommodation and food services recorded the second fastest monthly employment increase among the sectors, the pace slowed notably compared with growth over 20% in both June and July. Employment in accommodation and food services in August was 29.1% (-390,300) below its pre-COVID level, with losses in full-service restaurants and limited-service eating places accounting for two-thirds (-66.7%) of the decline. Sales in the food services and drinking places subsector rose by 6.4% in August, but they were down by almost one-quarter on a year-over-year basis. Average weekly earnings in this sector were up 2.6% year over year to $436 in August.
Payroll employment growth slows markedly in retail trade
Consistent with results from the LFS, employment growth in retail trade slowed notably in August, up 1.1% (+20,400), following increases of 7.5% in July and 9.6% in June. Gains in August were driven by clothing stores and clothing accessories (+2.9%; +5,000), the subsector within retail trade that was the most impacted by the COVID-19 economic shutdown.
Employment in retail trade was 8.0% (-160,400) below February levels in August, while average weekly earnings were $647, up 4.5% compared with 12 months earlier.
Retail sales increased for a fourth consecutive month in August, up 0.4%, with the advance estimate suggesting that sales will be relatively unchanged in September.
Payroll employment recovery stalls in transportation and warehousing
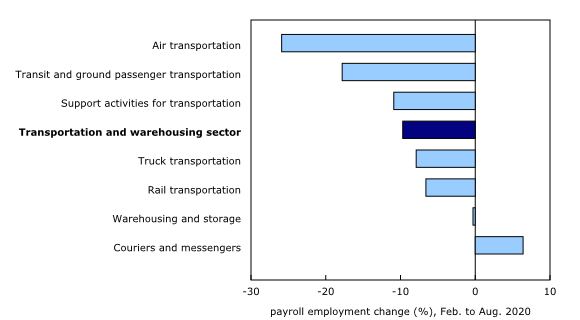
Following two months of increases, payroll employment in transportation and warehousing was little changed in August, as gains in truck transportation were offset by declines in warehousing and storage. Compared with February, employment in transportation and warehousing was down 9.7% (-76,600), with the air transportation and the transit and ground passenger transportation subsectors recording substantially larger declines than the average for the entire sector.
From February to August, employment fell by just over one-quarter (-25.9%; -20,500) in air transportation, and by 17.8% (-23,000) in transit and ground passenger transportation. The agency's monthly civil aviation survey reports that major Canadian airlines continue to face low demand, with an 86.8% drop in passengers from August 2019 to August 2020. Similarly, data from urban public operators show that, despite a steady increase in each month since April, the number of transit passengers fell by almost 60% year over year in August.
In contrast, the number of payroll jobs increased notably in the couriers and messengers subsector compared with February, up by 6.4% (+3,600), possibly tied to increasing e-commerce sales. On a year-over-year basis, average weekly earnings in the transportation and warehousing sector grew 7.2% to $1,200.
Payroll employment of industries related to tourism
As the border remained closed to non-essential foreign travellers throughout the summer, the recovery in tourism-related industries has been challenging. Results from the National tourism indicators showed that tourism spending by international visitors to Canada virtually ground to a halt (-96.2%) in the second quarter and that tourism spending in Canada by Canadians also fell, down by 58.6% over that period.
Payroll employment in tourism-related industries—a list of 27 industries mostly in transportation, in arts, entertainment and recreation, and in accommodation and food services—declined at a rapid pace from February to May, down by a little more than half (-51.6%; -1.0 million). In comparison, total payroll employment fell by 19.6% (-3.3 million) over the same period.
Despite rising 46.5% (+452,900) from May to August, employment in tourism-related industries was far from its pre-pandemic level, down by 29.1% (-586,100) compared with February. Employment declines in full-service restaurants and limited-service eating places, in traveller accommodation, in other amusement and recreation industries, and in special food services accounted for more than two-thirds (70%) of the decrease over that period.
Manufacturing continues to recover in August, with gains driven by food manufacturing
In manufacturing, payroll employment increased by 28,700 (+2.0%) in August, with the biggest gains in food manufacturing (+6,800; +2.9%) and plastics and rubber products (+4,600; +5.1%).
After a third consecutive month of growth, employment in manufacturing was 6.0% below the pre-COVID level. The increase in August coincided with an increase in the capacity utilization rate (not seasonally adjusted)—that is, the intensity with which industries use their production capacity—for the manufacturing sector, which rose from 74.0% in July to 75.8% in August due to higher manufacturing production. The rate was 79.6% in August 2019.
Average weekly earnings in the manufacturing sector were $1,159 in August, up 1.5% compared with 12 months earlier.
Employment gains in construction continue for fourth consecutive month; strong gains in residential building construction
In construction, payroll employment rose for a fourth consecutive month, up 24,500 (+2.6%) in August, with the highest increase in Quebec (+16,200; +8.4%). At the national level, most of the employment gain was among specialty trade contractors and construction of buildings. Within the construction of buildings, most of the employment gains were specifically in residential building construction (+5,700; +4.6%).
According to the August release on building permits, the total value of building permits rose 1.7% to $8.1 billion in August, driven by an increase in the residential sector in Ontario and Quebec. The value of permits issued for single family homes rose 9.9% in August, continuing the upward trend observed since May.
Employment in oil and gas remains at lowest level in over three years
In mining, quarrying, and oil and gas extraction, payroll employment was unchanged in August, and was 9.0% below the pre-COVID level in February. Employment in oil and gas extraction was 4.4% lower than the February level, and was at its lowest level since March 2017.
Year over year, employment in mining, quarrying, and oil and gas extraction was down by 20,100 (-10.0%), with most of the decline in Alberta.
Looking ahead
September LFS results—reflecting labour market conditions as of the week of September 13 to 19—showed further employment recovery as many businesses and workplaces had re-opened and families adapted to new back-to-school routines.
Some provinces have re-imposed restrictions in response to increases in the number of COVID-19 cases beginning in September. In British Columbia, new rules and guidelines related to bars and restaurants were implemented on September 8. In Ontario, limits on social gatherings were tightened for the hot spots of Toronto, Peel and Ottawa on September 17, and for the rest of the province on September 19. September SEPH results—to be released on November 26—will shed light on the labour market through the early days of restrictions being re-imposed. While some impact may be observed on sectors hardest-hit by these restrictions—such as accommodation and food services—in September, effects are likely to be more pronounced in the October data.
Sustainable Development Goals
On January 1, 2016, the world officially began implementing the 2030 Agenda for Sustainable Development—the United Nations' transformative plan of action that addresses urgent global challenges over the next 15 years. The plan is based on 17 specific sustainable development goals.
The Survey of Employment, Payrolls and Hours is an example of how Statistics Canada supports the reporting on the global sustainable development goals. This release will be used to measure the following goals:


Note to readers
The key objective of the Survey of Employment, Payrolls and Hours (SEPH) is to provide a monthly portrait of the level of earnings, employment and hours worked, by detailed industry, at the national, provincial and territorial levels.
SEPH estimates are produced by integrating information from three sources: a census of approximately 1 million payroll deduction records provided by the Canada Revenue Agency; the Business Payrolls Survey, which collects data from a sample of 15,000 establishments; and administrative records of federal, provincial and territorial public administration employment, provided by these levels of government.
Estimates of average weekly earnings and hours worked are based on a sample and are therefore subject to sampling variability. This analysis focuses on differences between estimates that are statistically significant at the 68% confidence level. Payroll employment estimates are based on a census of administrative records and are not subject to sampling variability.
With each release of SEPH data, data for the preceding month are revised. Users are encouraged to use the most up-to-date data available for each month.
Statistics Canada also produces employment estimates from its Labour Force Survey (LFS). The LFS is a monthly household survey, the main objective of which is to divide the working-age population into three mutually exclusive groups: the employed (including the self-employed), the unemployed and those not in the labour force. This survey is the official source for the unemployment rate, and it collects data on the sociodemographic characteristics of all those in the labour market.
As a result of conceptual and methodological differences, estimates of changes from the SEPH and LFS differ occasionally. However, the trends in the data are similar. For a more in-depth discussion of the conceptual differences between employment measures from the LFS and SEPH, refer to Section 8 of the Guide to the Survey of Employment, Payrolls and Hours (72-203-G).
Unless otherwise stated, this release presents seasonally adjusted data, which facilitate comparisons because the effects of seasonal variations are removed. For more information on seasonal adjustment, see Seasonally adjusted data – Frequently asked questions.
Non-farm payroll employment data are for all hourly and salaried employees, and for the "other employees" category, which includes piece-rate and commission-only employees.
Unless otherwise specified, average weekly hours data are for hourly and salaried employees only, and exclude businesses that could not be classified to a North American Industry Classification System (NAICS) code.
All earnings data include overtime and exclude businesses that could not be classified to a NAICS code. Earnings data are based on gross taxable payroll before source deductions. Average weekly earnings are derived by dividing total weekly earnings by the number of employees.
Real-time data tables
Real-time tables 14-10-0357-01, 14-10-0358-01, 14-10-0331-01 and 14-10-0332-01 will be updated on November 9.
Next release
Data on payroll employment, earnings and hours for September will be released on November 26.
Products
More information about the concepts and use of the Survey of Employment, Payrolls and Hours is available in the Guide to the Survey of Employment, Payrolls and Hours (72-203-G).
The product "Earnings and payroll employment in brief: Interactive app" (14200001) is now available. This interactive data visualization application provides a comprehensive picture of the Canadian labour market using the most recent data from the Survey of Employment, Payrolls and Hours. The estimates are seasonally adjusted and available by province and largest industrial sector. Historical estimates going back 10 years are also included. The interactive application allows users to quickly and easily explore and personalize the information presented. Combine multiple provinces and industrial sectors to create your own labour market domains of interest.
Contact information
For more information, or to enquire about the concepts, methods or data quality of this release, contact us (toll-free 1-800-263-1136; 514-283-8300; STATCAN.infostats-infostats.STATCAN@canada.ca) or Media Relations (613-951-4636; STATCAN.mediahotline-ligneinfomedias.STATCAN@canada.ca).
- Date modified:


