Police-reported hate crime, 2018
Archived Content
Information identified as archived is provided for reference, research or recordkeeping purposes. It is not subject to the Government of Canada Web Standards and has not been altered or updated since it was archived. Please "contact us" to request a format other than those available.
Released: 2020-02-26
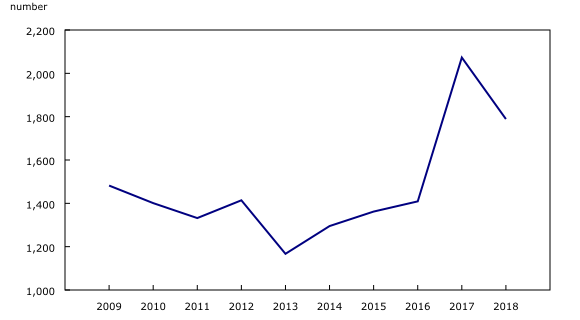
In 2018, there were 1,798 police-reported hate crimes in Canada, down 13% from the record-high of 2,073 incidents reported in 2017. Despite the decline, the number of hate incidents reported in 2018 was the second highest since 2009.
Hate crimes can have a devastating effect on victims and the wider community. A hate crime incident may be carried out against a person or property and may target race, colour, national or ethnic origin, religion, sexual orientation, gender identity or expression, language, sex, age, mental or physical disability, or any other similar factor. Additionally, there are four specific offences listed as hate propaganda or hate crimes in the Criminal Code of Canada: advocating genocide, public incitement of hatred, willful promotion of hatred, and mischief motivated by hate in relation to property used by an identifiable group.
Statistics Canada monitors the number and nature of hate crimes reported to police in any given year and monitors trends over time. A detailed analysis is provided in the Juristat article released today, "Police-reported hate crime in Canada, 2018" and the accompanying infographic, "Infographic: Police-reported hate crime in Canada, 2018."
Number of hate crimes reported to police is down from 2017, but is the second highest number since 2009
The 1,798 hate crimes reported by police in 2018 was 13% lower than the record-high of 2,073 incidents reported in 2017. Despite the decline, police-reported hate crimes had been increasing since 2014 and the number reported in 2018 was the second highest since 2009.
As with other crimes, self-reported data provide further insight into hate-motivated crimes. According to the 2014 General Social Survey on Canadians' Safety (Victimization), Canadians reported being the victim of over 330,000 criminal incidents that they perceived as being motivated by hate in the 12 months preceding the survey (5% of the total self-reported incidents). Two-thirds of these incidents were not reported to the police, a rate similar to criminal victimization overall.
Hate-motivated crime accounts for a small proportion of all police-reported crime (around 0.1% of all non-traffic related offences). Police data on hate crimes, however, reflect only those incidents that come to the attention of police and are classified as hate crimes. As a result, fluctuations in the number of reported incidents may be due to a true change in the volume of hate crimes, but they might also reflect changes in reporting by the public due to increased community outreach by police or heightened sensitivity after high-profile events.
Decrease in hate crimes primarily due to fewer police-reported incidents in Ontario
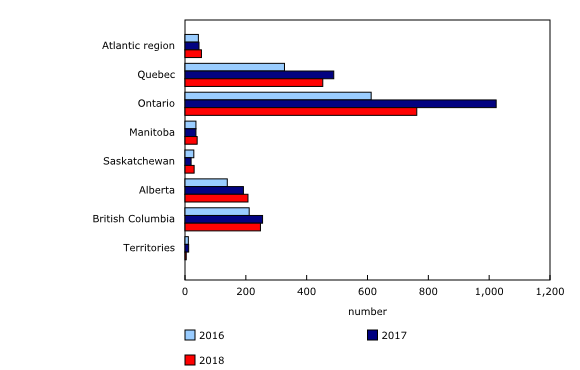
In 2018, most types of police-reported hate crimes were down from the previous year. Declines in incidents targeting the Muslim, Black, and Arab or West Asian populations accounted for most of the national decrease. These declines were driven by fewer hate-related property crimes, such as graffiti and vandalism, with large decreases in Ontario and Quebec.
Ontario, Canada's most populous province, reported a 26% decrease in hate crimes, from 1,023 incidents in 2017 to 762 incidents in 2018. This decline was attributable to fewer crimes targeting the Muslim (-104 incidents), Black (-48 incidents) and Jewish (-28 incidents) populations, as well as those targeting sexual orientation (-35 incidents).
Quebec was the second-largest contributor to the decrease in hate crimes, with 57 fewer police-reported hate crimes against the Muslim population, down from 117 in 2017 to 60 in 2018. In contrast to the national trend, more hate crimes were reported in the Prairie and Atlantic provinces (excluding New Brunswick).
Accounting for population size, hate crime rates were highest in Quebec (5.4 incidents per 100,000 population), Ontario (5.3 incidents), British Columbia (5.0 incidents) and Alberta (4.8 incidents).
Non-violent hate crimes down by about one-fifth
Non-violent hate crime accounted for over half (57%) of all hate crimes in 2018, but the number of incidents decreased by 21% from a year earlier, with general mischief (-26%) and public incitement of hatred (-40%) driving the decline.
Violent hate crime, which accounted for 43% of all hate crime in 2018, decreased 2% as a result of fewer incidents of uttering threats (-11%) and criminal harassment (-21%).
In contrast to the overall downward trend in hate crimes, there were more incidents of assault (+6%) and mischief towards property used primarily for worship or by an identifiable group (+43%).
Hate crimes targeting religion down by nearly one-quarter, with fewer anti-Islamic hate crimes
Hate crimes targeting religious groups accounted for over one-third (36%) of all hate crime in Canada in 2018, down from 41% in 2017. There were 639 hate crimes against religious groups in 2018, 24% less than a year earlier.
Following a large increase in hate crimes against the Muslim population in 2017, police reported 176 or 50% fewer incidents in 2018. The decline was attributable to large decreases in Ontario (104 fewer incidents) and Quebec (57 fewer incidents), following spikes in both provinces in 2017. Hate crimes targeting the Muslim population accounted for 10% of all hate crimes in Canada in 2018.
Violent incidents targeting the Muslim population were more likely than other types of hate crimes to involve female victims. From 2010 to 2018, 45% of victims of violent hate crimes targeting the Muslim population were female, compared with 32% of all hate crime victims.
In contrast, following a marked increase of 63% in 2017, the number of incidents targeting the Jewish population decreased by 4% in 2018 to 347. Hate crimes targeting the Jewish population accounted for nearly one-fifth (19%) of all police-reported hate crimes in Canada in 2018, marking the third consecutive year in which the Jewish population was the most commonly targeted group. Ontario reported 28 fewer incidents, while British Columbia reported 17 fewer. In contrast, the number of hate crimes targeting the Jewish population in Alberta more than doubled—from 16 incidents in 2017 to 42 in 2018.
Police-reported crimes motivated by hatred of a race or ethnicity decrease
In 2018, 44% of all police-reported hate crime was motivated by hatred of a race or ethnicity. Police reported 780 crimes motivated by hatred of a race or ethnicity, down 11% from 2017. The decline was largely attributable to 38 fewer hate crimes targeting the Black population (-12%) and 31 fewer incidents targeting the Arab and West Asian populations (-22%).
Hate crimes targeting the Black population accounted for 16% of all hate crimes in Canada and remained the most common type of hate crime targeting a race or ethnicity. Ontario (-48 incidents) reported the largest decrease in crimes against the Black population in 2018, while Quebec (+18 incidents) recorded the largest increase.
The number of police-reported hate crimes against the Arab and West Asian populations declined for the first time since 2013. These crimes accounted for 14% of hate crimes targeting a race or ethnicity and 6% of all hate crimes in 2018.
Hate crimes targeting the Indigenous population account for very few police-reported hate crimes
Incidents against Indigenous peoples—those who are First Nations, Métis or Inuit—continued to account for a relatively small proportion of police-reported hate crimes (2%), up slightly from 31 incidents in 2017 to 35 in 2018.
Police-reported violent hate crimes against Indigenous peoples are more likely than other hate crimes to involve female victims. From 2010 to 2018, 45% of victims of violent hate crimes against Indigenous peoples were female, compared with 32% of all violent hate crime victims.
According to the most recent data on victimization, Indigenous victims of non-spousal violence were less likely to report the crime to police than their non-Indigenous counterparts. It is therefore unclear if the number of reported hate crimes among the Indigenous population reflects low levels of hate crime, low levels of reporting hate crime to police, or both.
Police-reported hate crimes targeting sexual orientation are down, but continue to be violent in nature
Police reported 173 hate crimes targeting sexual orientation in 2018, down 15% from a year earlier. Eight in ten of these crimes specifically targeted the gay and lesbian community, while two in ten comprised incidents targeting bisexual orientation (3%), other sexual orientations such as asexual, pansexual or other non-heterosexual orientations (12%), and where sexual orientation was unknown (6%).
As was the case in previous years, violent crimes accounted for a larger share of crimes targeting sexual orientation compared with other types of hate crimes. In 2018, almost two-thirds (62%) of hate crimes motivated by hatred of a sexual orientation were violent crimes. In comparison, about one-quarter (24%) of hate crimes targeting religion and about one-half (53%) targeting race or ethnicity were violent.
Note to readers
Police-reported hate crime data have been collected on an annual basis since 2006 and, since 2010, data on motivations have been reported by police services that cover 99.95% of the population of Canada.
Detailed information about the incidents, such as the type of offence, as well as the characteristics of victims (in violent offences) and the accused (in all types of offences), were not available from the municipal police services of Calgary in 2018 and of Saint John in 2017. As such, characteristics of hate crime incidents were reported by police services covering 96.2% of the Canadian population in 2018, and 99.4% of the Canadian population in 2017. When comparing characteristic counts for data from 2017 to 2018, the municipal police services of Calgary and Saint John were excluded from the analysis. Included, however, were any counts investigated by the Royal Canadian Mounted Police within either jurisdiction.
Police determine whether or not a crime was motivated by hatred. They indicate the type of motivation based on information gathered during the investigation and common national guidelines for record classification. Fluctuations in the annual number of incidents can be influenced by changes in local police service practices, their engagement with various communities, and the willingness of victims to report incidents to police. The number of hate crimes presented in this release likely undercounts the true extent of hate crime in Canada, as not all crimes are reported to police.
Reference tables: 35-10-0066-01, 35-10-0067-01 and 35-10-0191-01.
Products
The article "Police-reported hate crime in Canada, 2018" is now available as part of the publication Juristat (85-002-X). The infographic "Infographic: Police-reported hate crime in Canada, 2018," which is part of the series Statistics Canada — Infographics (11-627-M), is now available.
Contact information
For more information, or to enquire about the concepts, methods or data quality of this release, contact us (toll-free 1-800-263-1136; 514-283-8300; STATCAN.infostats-infostats.STATCAN@canada.ca) or Media Relations (613-951-4636; STATCAN.mediahotline-ligneinfomedias.STATCAN@canada.ca).
- Date modified:


