Study: Trade in goods by exporter and importer characteristics, by census metropolitan area
Archived Content
Information identified as archived is provided for reference, research or recordkeeping purposes. It is not subject to the Government of Canada Web Standards and has not been altered or updated since it was archived. Please "contact us" to request a format other than those available.
Released: 2019-12-09
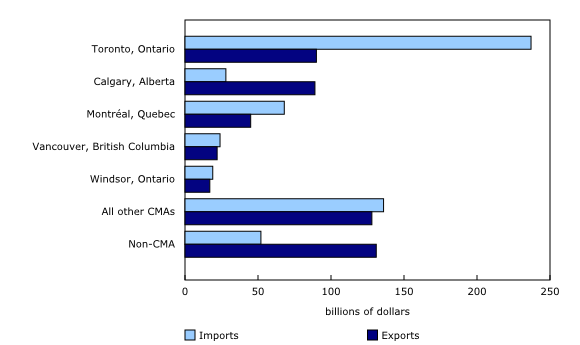
In 2018, the five major census metropolitan areas (CMAs) in terms of trade—Toronto, Calgary, Montréal, Vancouver and Windsor—contributed to nearly 60% of Canada's total international merchandise trade. Calgary posted the highest net exports, while Toronto had the highest net imports.
Overall, Canada's 35 CMAs accounted for 75% of total merchandise exports and for more than 90% of total imports in 2018.
Out of all the exporting (50,247) and importing (168,028) establishments, more than three-quarters were located in CMAs in 2018, and their numbers have been relatively stable since 2010. An establishment is a statistical unit that represents the location of an exporter or importer.
The Toronto census metropolitan area contributes heavily to Canada's imports
In 2018, the Toronto CMA (Toronto) represented more than 40% of Canada's total import value, and 17.2% of the total export value, the largest shares among all CMAs in the country.
The value of exports from Toronto establishments rose 54.4% from 2010 to 2018, reaching $89.9 billion in 2018. This growth was faster than that of all other CMAs combined (+36.1%). Over three-quarters of exporting establishments in Toronto exported goods to the United States.
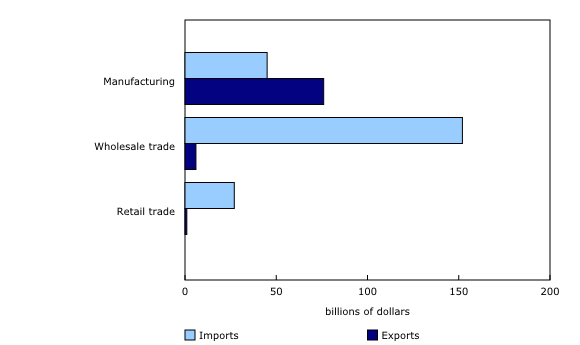
The manufacturing sector contributed the most to exports from Toronto establishments, with exports totalling $75.8 billion in 2018. Unwrought gold, mainly sold to the United Kingdom, and motor vehicles, mostly sold to the United States, were the main products exported.
Similar to export value, the value of imports by Toronto establishments grew by 53.9% from 2010 to 2018 to reach $236.7 billion. Imports of vehicles and mobile telephones contributed the most to this growth. Establishments with fewer than 500 employees were responsible for the bulk of the imports.
The marked increase in international trade in Toronto coincided with strong growth in its population. Among all CMAs in Canada, Toronto posted the largest population increase (+660,809) from 2010 to 2018.
The Calgary census metropolitan area posts the highest net exports, led mainly by the energy sector
In 2018, exports from the Calgary CMA (Calgary) reached $88.6 billion, while imports amounted to $28.3 billion. As a result, its net export value stood at $60.3 billion, the highest level among all CMAs in Canada.
The mining, quarrying, and oil and gas extraction sector represented 65% of Calgary's export value in 2018, up from 49% in 2010. This increase was primarily led by exports of crude petroleum to the United States and by establishments with fewer than 500 employees.
Despite the increased value of exports, the number of establishments exporting and importing energy products declined by 7.4% from 2010 to 2018.
Conversely, the number of establishments trading non-energy products rose by 4.1% from 2010 to 2018. These establishments were operating in various industrial sectors, such as manufacturing, wholesale trade, retail trade, construction, and professional, scientific and technical services.
Manufacturing and wholesale trade foster international trade in major census metropolitan areas
Overall, the manufacturing and wholesale trade sectors contributed the most to international merchandise trade in major CMAs in the country in 2018. Calgary was the exception, with its mining, quarrying, and oil and gas extraction sector generating the bulk of the international trade.
In the Montréal CMA, wholesale trade represented 44% of imports in 2018. Meanwhile, manufacturing was responsible for over three-quarters of exports, led by the transportation equipment manufacturing and the primary metal manufacturing subsectors.
In the Vancouver CMA, wholesale trade accounted for more than 40% of exports and nearly half of imports in 2018. The farm product merchant wholesaler subsector posted the highest value of exports, led by products exported to China and Japan. Meanwhile, the building material and supplies merchant wholesalers subsector posted the strongest imports.
In the Windsor CMA, the manufacturing sector—particularly transportation equipment manufacturing—accounted for nearly all exports and over 60% of imports, in terms of value. This trade activity occurred mainly with one partner country, the United States.
An interactive tool—Trade in goods by exporter and importer characteristics—is available
An interactive tool is available that allows users to quickly, easily and efficiently browse the wide variety of information available on trade in goods by exporter and importer characteristics. This tool provides information on the number of exporters and importers, and on trade value by trader location (such as province and census metropolitan area), trader's industry sector, and partner countries with whom products are exchanged.
Note to readers
This release contains data on the location of exporters and importers of goods by census metropolitan area (CMA). Data are taken from the following related tables:
- Trade in goods by exporter characteristics, by CMA and number of partner countries (12-10-0137-01),
- Trade in goods by exporter characteristics, by CMA and industry of establishment (12-10-0138-01),
- Trade in goods by importer characteristics, by CMA and number of partner countries (12-10-0131-01), and
- Trade in goods by importer characteristics, by CMA and industry of establishment (12-10-0139-01).
The Trade by Exporter Characteristics — Goods and the Trade by Importer Characteristics — Goods programs are initiatives undertaken at Statistics Canada to analyze the characteristics of exporters and importers of goods in Canada. These estimates are formed by linking customs trade data records to business entities in Statistics Canada's Business Register.
Data on exports to the United States are collected by the United States Census Bureau and are transmitted to Statistics Canada as part of the Canada–U.S. data exchange. Data on exports to the rest of the world are collected jointly by Statistics Canada and the Canada Border Services Agency.
Customs import data are collected jointly by Statistics Canada and the Canada Border Services Agency.
The Business Register contains the complete operating and legal structure of enterprises operating in Canada, as well as their key characteristics such as employment and sector activity, based on the North American Industry Classification System code.
Survey definitions
This release contains information at the establishment level. An establishment is defined as the statistical unit where the accounting data required to measure production are available.
A census metropolitan area (CMA) is formed by one or more adjacent municipalities clustered around a population centre (known as the core). A CMA must have a total population of at least 100,000, of which 50,000 or more must live in the core, based on adjusted data from the Census of Population Program. There are 35 CMAs in Canada.
A non-CMA is an area that is not part of the 35 CMAs. The sum of CMA and non-CMA data represents Canada. Therefore, adding the trade values of CMAs and non-CMAs produces the national total. The same concept applies for the number of traders.
Detailed information on the concepts and methodology related to this release is available on the Trade by Exporter Characteristics — Goods survey page and the Trade by Importer Characteristics — Goods survey page.
Survey coverage
In this release, the total value of exports and imports refers to the part of the annual domestic export and import value (customs basis) that can be linked to specific entities in the Business Register each year. Annual domestic export and import values (customs basis) can be obtained from the Canadian International Merchandise Trade Database and Table 12-10-0119-01. Additional information is available on the survey page for Canadian International Merchandise Trade (Customs Basis).
Every year, from 2010 to 2018, the total number of identified exporting and importing enterprises accounted for 96% to 98% of the total domestic export and import value, respectively. Throughout this release, the percentage share of export sales and import purchases corresponds to the share of the annual domestic export and import value for which there was an identified exporter and importer. The number of exporters and importers corresponds to the number of exporters and importers identified in the Business Register by the Trade by Exporter Characteristics — Goods and the Trade by Importer Characteristics — Goods programs.
Products
The product "Trade in Goods by Exporter and Importer Characteristics: Interactive Tool" (71-607-X) is now available.
The Methodological Guide: Canadian System of Macroeconomic Accounts (13-607-X) is available.
The User Guide: Canadian System of Macroeconomic Accounts (13-606-G) is also available. This publication will be regularly updated to maintain its relevance.
The updated Canada and the World Statistics Hub (13-609-X) is available online. This product illustrates the nature and extent of Canada's economic and financial relationship with the world through interactive graphs and tables. This product provides easy access to information on trade, investment, employment and travel between Canada and a number of countries, including the United States, the United Kingdom, Mexico, China and Japan.
Contact information
For more information, contact us (toll-free 1-800-263-1136; 514-283-8300; STATCAN.infostats-infostats.STATCAN@canada.ca).
To enquire about the concepts, methods or data quality of this release, contact Angela Yuan-Wu at 613-240-2871 (angela.yuanwu@canada.ca) or Ying Di at 613-867-2736 (ying.di@canada.ca), International Accounts and Trade Division.
- Date modified:


