Pandemic benefits cushion losses for low income earners and narrow income inequality – after-tax income grows across Canada except in Alberta and Newfoundland and Labrador
Archived Content
Information identified as archived is provided for reference, research or recordkeeping purposes. It is not subject to the Government of Canada Web Standards and has not been altered or updated since it was archived. Please "contact us" to request a format other than those available.
Released: 2022-07-13
When the World Health Organization declared the outbreak of COVID-19 a pandemic on March 11, 2020, governments across Canada and around the world adopted a series of measures to slow its spread. Programs were also put in place to help Canadian businesses and households weather the impact of the pandemic.
The Canadian economy had been performing well in the years before the pandemic. The unemployment rate reached 5.7% in 2019, its lowest annual level on record at the time. Household income was trending up in most provinces and territories, and low income, poverty and income inequality had been on a downward trend.
On the other hand, lower oil prices were impacting the economies of resource-rich provinces, and many Canadians, such as those living alone or in one-parent families, remained at higher risk of having low incomes.
In 2020, the outbreak of COVID-19 and the corresponding public health measures and pandemic relief programs brought significant changes to the Canadian labour market and income landscape.
Today's release presents a comprehensive income portrait of the Canadian population, based on data from the 2021 Census of Population. It highlights disaggregated income statistics and trends for the 2020 reference year at the national, provincial and territorial levels. It also showcases regional and local data for communities ranging from Canada's largest urban centres to smaller population centres and rural areas.
For the majority of households, the most important source of income is employment income. It consists of wages, salaries and commissions from paid employment and net self-employment income. This release therefore begins by examining the lost employment income experienced by millions of Canadians during the first year of the pandemic.
Pandemic relief benefits were an important component of income in 2020. This release highlights the extent to which income from government transfers, including federal emergency and recovery benefits, offset lost employment income for many Canadians.
This release also highlights the increase in after-tax income among Canadian households and families since the previous census. This, in turn, reflects the combined effects of slow employment income growth and higher government transfers in 2020 compared with 2015.
After-tax household income is the measure of income that most closely captures the overall economic well-being of Canadians, reflecting how much money families have to support their consumption, investment and savings needs.
The release concludes by examining trends in income inequality and low-income rates for population groups living across Canada.
All income figures in this release are adjusted for inflation and are expressed in 2020 constant dollars.
Highlights
Fewer Canadians received employment income in 2020, particularly women, lower-income earners and older workers.
The proportion of Canadians receiving employment income fell in most provinces and territories. Some provinces and territories reported higher median employment income in 2020, as lower-earning jobs disappeared.
Over two-thirds of Canadian adults received income from one or more pandemic relief programs.
Benefits from COVID-19 income supports offset losses in employment income among low-wage earners.
Household after-tax income growth accelerated from 2015 to 2020, particularly among families with children, driven by increases in government transfers.
After-tax income growth was faster for households with lower incomes, reflecting greater contributions of the Canada Child Benefit and pandemic relief benefits to the incomes of lower-income families.
After-tax incomes declined in Alberta and Newfoundland and Labrador, reflecting lower oil prices on top of COVID-19 slowdowns.
Income growth was faster in large urban centres—particularly downtown cores—compared with smaller population centres and rural areas, mirroring trends in population growth.
From 2015 to 2020, income inequality fell in all provinces and territories, with Alberta recording the largest decline.
The low-income rate fell in 2020, especially for families with children, but less for seniors and people living alone.
Fewer Canadians receive employment income in 2020, as many lower-paid jobs disappear
The pandemic has had a profound effect on the labour market and on the employment income of Canadians, mostly on workers with income below the median. The median is the level of income where half the population had higher income and the other half had lower income.
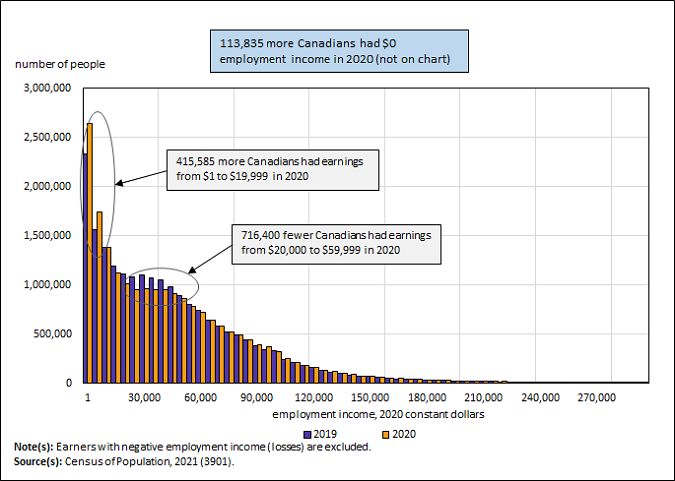
There were 113,835 fewer Canadian adults who received employment income in 2020 than in 2019. Among those who received employment income, many earned less than they had earned before. Compared with 2019, 716,400 fewer Canadians had earnings ranging from $20,000 to $59,999 in 2020, while 415,585 more Canadians earned less than $20,000.
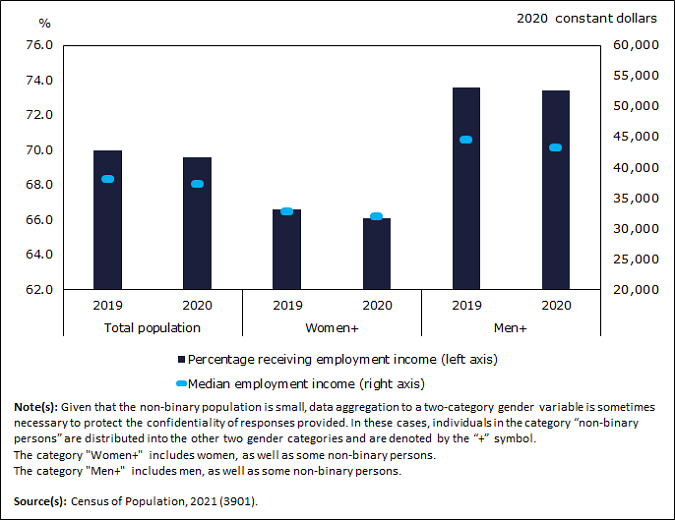
Overall, 69.6% of Canadians received employment income in 2020, down 0.4 percentage points from a year earlier. The median employment income was $37,200, down 2.1% from 2019.
The pandemic impacted the labour market and the income of workers in economies around the world. For example, in the United States, the number of people with earnings fell by about 3 million from 2019 to 2020, while the median earnings of workers decreased 1.2%.
In this release, median employment income is calculated based only on workers with employment income. Therefore, both the change in the percentage of the population with employment income and the change in median employment income among workers should be considered to see the impact of the pandemic on the earnings of Canadians.
The share of Canadians receiving employment income falls, particularly among women and older workers
Just under two-thirds (66.1%) of Canadian women received employment income in 2020, down 0.5 percentage points from a year earlier, while their median employment income fell 2.4% to $32,000.
In comparison, just under three-quarters (73.4%) of Canadian men received employment income, down 0.2 percentage points from a year earlier, while their median employment income fell 2.7% to $43,200. Men's median employment income remained over one-third (+35.0%) higher than women's median employment income in 2020.
In April 2022, Statistics Canada reported new data from the 2021 Census that highlighted the aging of Canada's workforce. In 2021, more than one in five (21.8%) Canadians of working age were aged 55 to 64, the highest share ever recorded in a Canadian census.
Retirement age workers and those approaching retirement age were disproportionately impacted during the pandemic. The share of Canadians aged 65 and older receiving employment income fell 4.4 points for both men and women, while the median employment income fell 32.2% for men and 23.8% for women of the same age group.
The share of Canadians aged 55 to 64 receiving employment income fell 2.9 points among women and 2.0 points among men from 2019 to 2020. Meanwhile, the median employment income fell 5.2% among women and 6.6% among men of the same age group over the same period.
The proportion of Canadians receiving employment income falls in most provinces and territories—in some provinces and territories, losses of lower-paying jobs drive median employment income up
From 2019 to 2020, the share of adults receiving employment income fell in seven provinces and in the three territories. Slight increases were recorded in Quebec and Saskatchewan, while the share of adults receiving employment income in Ontario remained unchanged.
Meanwhile, median employment income decreased the most in the resource-rich provinces of Alberta (-6.3%), Newfoundland and Labrador (-6.0%) and Saskatchewan (-4.2%), as record low oil prices in 2020 compounded the effect of pandemic restrictions.
Higher median employment income in British Columbia (+3.3%) and Prince Edward Island (+2.0%) as well as in Nunavut (+11.8%), Yukon (+5.7%) and the Northwest Territories (+5.6%) partly reflected the disproportionate impacts of the pandemic on lower-income workers, many of whom did not earn any employment income following the onset of the pandemic in 2020 and are therefore not included in the calculation of the median.
Across Canada's large urban centres, median employment income rose in Victoria (+6.3%), Chilliwack (+5.7%), and Nanaimo (+3.6%) but declined in St. Catharines–Niagara (-10.4%), Windsor (-7.9%), and Red Deer (-7.6%).
There was significant variation in how the earnings profile of smaller urban centres changed from 2019 to 2020. For example, in Orillia, the share of residents receiving employment income decreased 1.1 percentage points to 64.7%, while the median employment income decreased 11.0% to $29,200. In Parksville, the share of residents receiving employment income decreased 7.3 percentage points to 49.2%, but their median employment income increased 13.0% to $26,000.
During the pandemic, earnings fell in some sectors, but increased in others
Measures introduced to slow the spread of COVID-19 in 2020 limited economic activity in many sectors, while other sectors saw growing demand for workers. Public health restrictions had a greater impact on lower-paying service sectors such as accommodation and food services; arts, entertainment and recreation; and retail trade. Other sectors, such as those that transitioned more easily to remote work, saw increased activity.
According to tax data, median earnings were down by approximately one-quarter in both the accommodation and food services, and in the arts, entertainment and recreation sectors from 2019 to 2020—the largest declines among all sectors. Median earnings in these sectors were down sharply in all provinces and territories.
At the same time, median earnings rose sharply in higher-paid sectors, such as finance and insurance; public administration; and information and cultural industries.
More than two-thirds of Canadian adults receive income from one or more pandemic relief programs
While fewer Canadians received employment income and median employment income fell in 2020, many received payments from government income-support programs.
These included new programs, such as the Canada Emergency Response Benefit (CERB), the Canada Recovery Benefit (CRB), and the Canada Emergency Student Benefit (CESB). These also included additional support within programs such as the Canada Child Benefit, Old Age Security, the Guaranteed Income Supplement, and the harmonized sales tax and goods and services tax credit at the federal level, as well as supports from provincial and territorial governments.
Of the 30.3 million Canadian adults aged 15 and older, more than two-thirds (68.4%), or 20.7 million people, received payments from one or more of the federal, provincial or territorial pandemic-relief benefits.
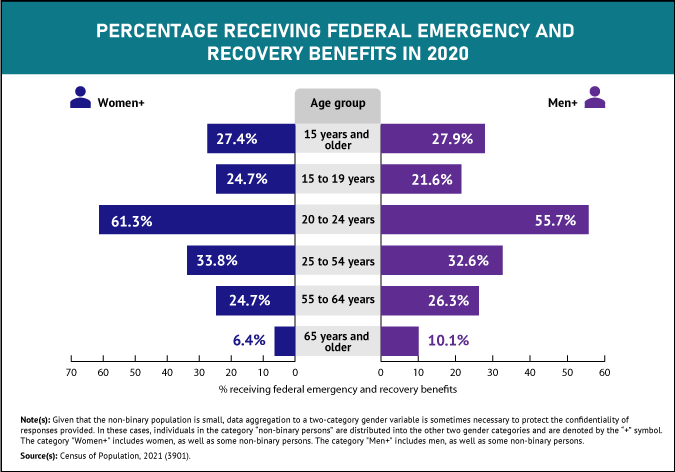
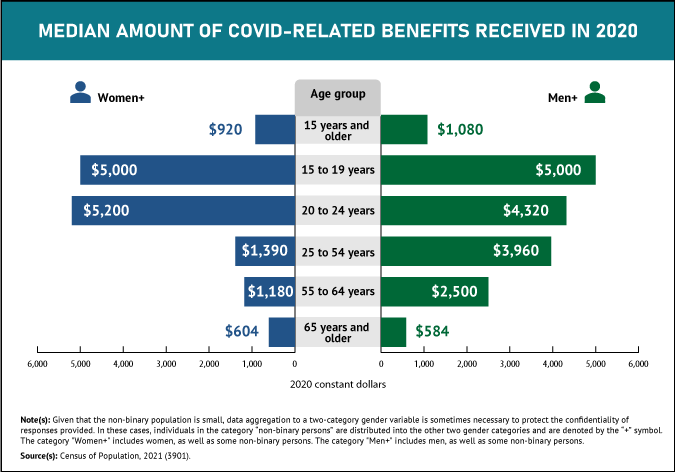
Over one-quarter (27.6%) of Canadian adults received federal emergency and recovery benefits, most often through CERB, designed to support workers who had lost their jobs or worked fewer hours because of the pandemic. Among those who received emergency and recovery benefits, the median amount received in 2020 was $8,000, and this was similar for women and men.
Over half (55.9%) of Canadian adults received top-ups to existing federal programs, but the amounts they received were lower compared with the federal emergency and recovery benefits. Seniors were most likely to receive these top-up payments. More than 9 in 10 (90.5%) seniors aged 65 and older received top-ups to existing federal programs, and the median amount received was $500.
Nearly 4.2 million Canadian adults also received support from their provincial or territorial government through various pandemic relief programs.
Losses in employment income among low-wage earners are offset by benefits from COVID-19 income supports
Lockdowns and lower economic activity during the pandemic had a profound effect on the earnings profile of Canadians in 2020.
However, when employment-related benefits from 2019 and 2020, including payments from emergency and recovery benefits and Employment Insurance benefits, are added to employment income, a different picture emerges.
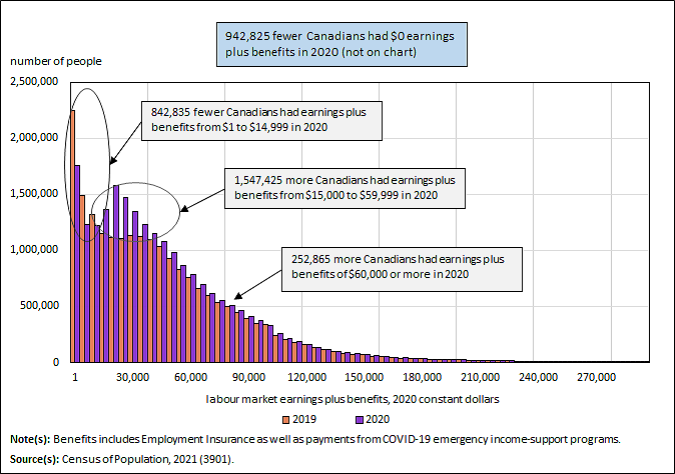
For many, benefits from COVID-19 income support programs offset losses in employment income. Compared with 2019, 942,825 fewer Canadians had no income from employment or employment-related benefits in 2020, and 842,835 fewer Canadians had employment income plus benefits between $1 and $14,999.
Compared with 2019, 1.5 million more Canadians had employment income plus benefits ranging from $15,000 to $59,999 in 2020, and 252,865 more had employment income plus benefits of $60,000 or more.
A detailed Census in Brief article on the distribution of benefits across different groups of Canadians and different geographic areas (provinces, territories, census metropolitan areas, and census agglomerations) will be released in the coming weeks.
Household after-tax income growth accelerates, particularly among families with children, driven by increases in government transfers
While employment income is the main source of income for Canadian households, many also receive investment income and government transfers and pay income taxes. This section focuses on household after-tax income, which combines income from all sources and subtracts income taxes paid by all household members.
After-tax income is seen to better represent the income Canadians have to support their consumption, investment and savings needs.
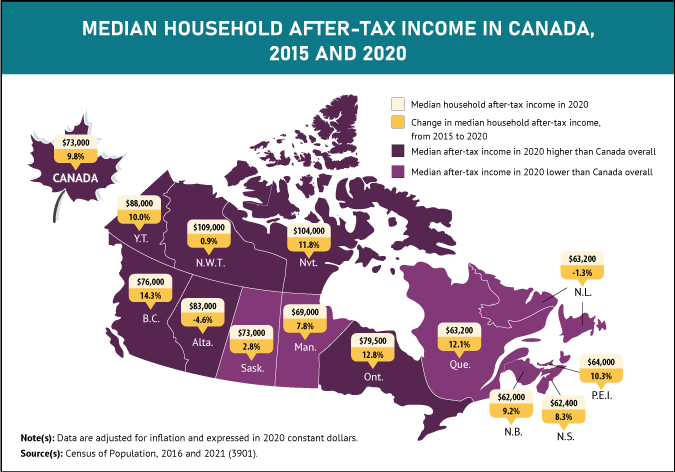
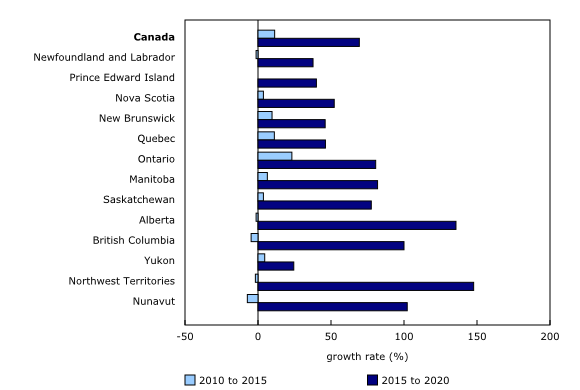
Median household after-tax income grew 9.8% to $73,000 from 2015 to 2020. Growth during this period far outpaced that of the previous intercensal period. In comparison, median household after-tax income grew 4.5% from 2010 to 2015, when the Canadian economy was rebounding from the 2008/2009 recession.
The faster growth from 2015 to 2020 reflects a combination of the effects of the pandemic on the labour market that reduced household earnings in 2020, the pandemic relief programs that offset this reduction in earnings and the successive increases in child benefits during this period.
In 2020, median family employment income was $63,200. According to annual survey data, earnings grew from 2015 to 2019, but this growth was wiped out during the COVID-19 shutdowns, leaving 2020 family employment income practically unchanged from 2015. However, the median federal emergency and recovery benefits received by families reached $10,000, while the median Canada Child Benefit received by families was $5,880, up from $4,160 in 2015.
From 2015 to 2020, families with children saw faster growth in their after-tax income than other types of families. For couples with children, median after-tax income grew 10.5%, compared with 6.8% for couples without children.
For one-parent families headed by a woman, which account for four-fifths of all one-parent families, median after-tax income grew 22.8% from 2015 to 2020. Over this period, after-tax income for families with children was boosted by the Canada Child Benefit and its 2020 enhancements.
After-tax incomes decline in Alberta and Newfoundland and Labrador, reflecting lower oil prices on top of COVID-19 slowdowns
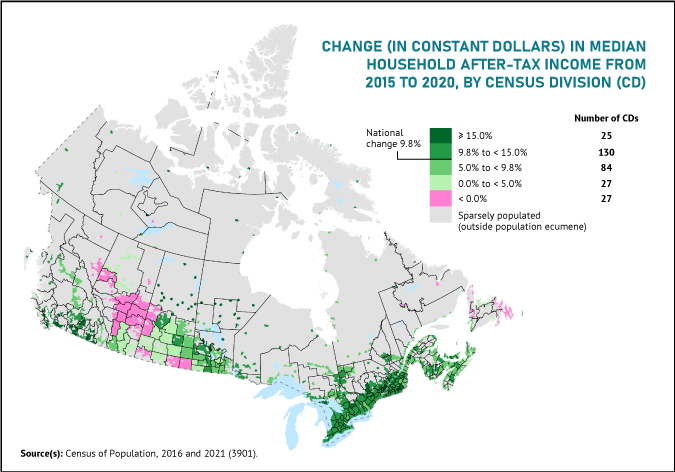
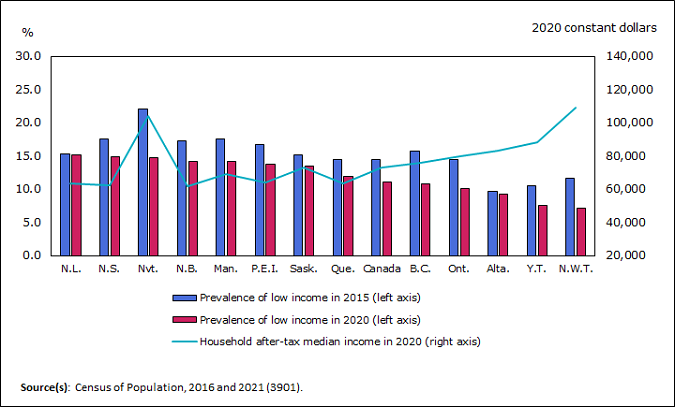
Median after-tax household income rose in eight provinces and in the three territories from 2015 to 2020, with British Columbia, Ontario, Nunavut, Quebec, Prince Edward Island, and Yukon all recording increases above the national average (+9.8%). In these provinces and territories, higher government transfers offset declines or boosted small or moderate increases in household employment income.
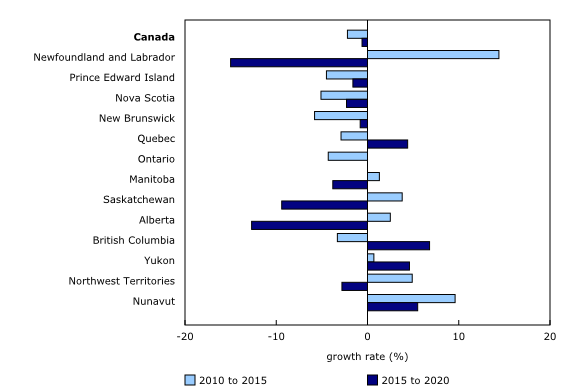
Meanwhile, Alberta (-4.6%) and Newfoundland and Labrador (-1.3%) recorded declines in their median after-tax income from 2015 to 2020, while Saskatchewan (+2.8%) recorded the smallest increase among the provinces. This is a reversal of trends highlighted in the 2016 Census, in which the three resource-rich provinces had posted the highest income growth rates among the provinces.
The natural resources sector and oil prices have far-reaching impacts on the economies of these provinces. From 2015 to 2020, the price of Western Canadian Select (WCS) oil averaged US$36 per barrel, less than half of its average from 2010 to 2014 (US$73). The price of WCS oil began trending up in 2021 and in the first quarter of 2022, it approached levels last seen in 2008.
Despite these movements, in 2020, as in 2015, households in Alberta continued to have the highest median after-tax income among the provinces. In the three territories, higher median incomes compared with the provinces reflect the presence of highly paid public services and resources industries, but they need to be interpreted in the context of much higher costs of living compared with the rest of the country.
Income growth is faster in large urban centres—particularly downtown cores
An increasingly larger share of Canadians resides in large urban centres, with population growth concentrated in downtown cores and in more distant suburbs.
Overall, median after-tax income in 2020 was higher, and growth from 2015 to 2020 was faster in large urban centres than in the rest of the country.
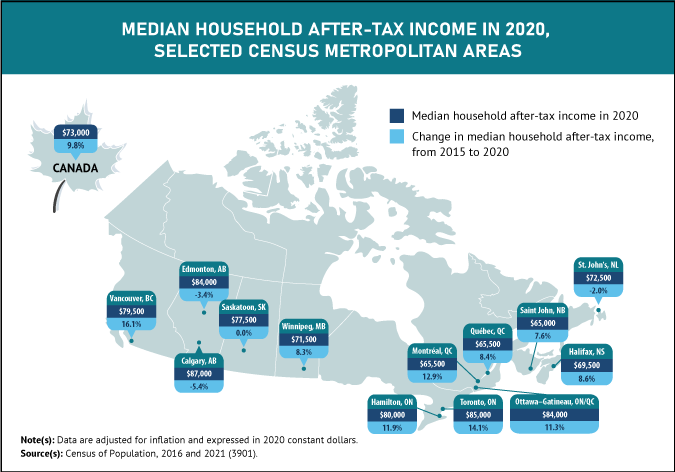
Median after-tax income was highest in Oshawa in 2020, up 11.3% from five years earlier to $89,000. Median after-tax income grew the fastest in Chilliwack, rising 17.8% from $62,800 in 2015 to $74,000 in 2020.
In Toronto, median after-tax income was $85,000 in 2020, up 14.1% from 2015, while in Vancouver it was $79,500, up 16.1% from five years earlier. In Montréal, median after-tax income grew 12.9% from 2015 to 2020, to reach $65,500.
Median after-tax income in the downtown cores of large urban centres was generally lower, reflecting the presence of populations with generally lower levels of income, such as students and recent immigrants. In these downtown cores, median after-tax income was $53,600 in 2020, compared with $75,000 in large urban centres overall.
Median after-tax income varied markedly across smaller urban centres. Households in Elliot Lake had the lowest median after tax income ($47,600) among CAs, while those in Wood Buffalo had the highest ($143,000).
Despite slower population growth compared with urban areas, 6.6 million Canadians lived in a rural area in 2021, representing 17.8% of the population. The median after-tax income for households in rural Canada ($72,000) remained lower than for households in large population centres ($75,000) in 2020. However, it exceeded that for households in small and medium population centres ($69,000 for both).
Median after-tax income for rural households grew 8.3% from 2015 to 2020, slower than for households living in medium (+12.0%) and large (+10.3%) population centres, but similar to households in small population centres (+8.5%).
Income inequality falls in all provinces and territories, especially in Alberta
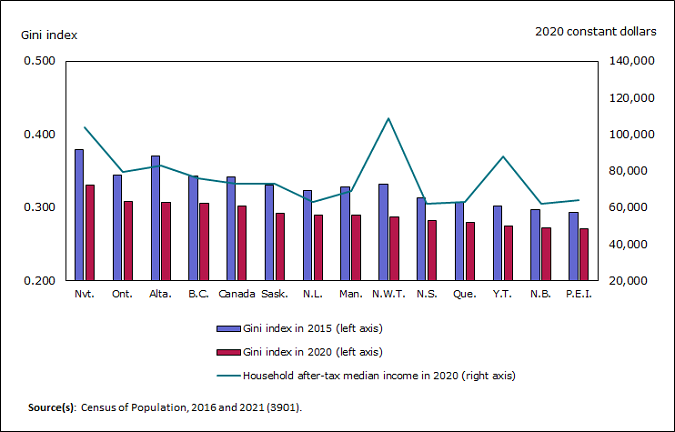
There was less income inequality in Canada in 2020 than in 2015. The Gini index of household after-tax income, a measure of income inequality, fell from 0.342 in 2015 to 0.302 in 2020, the largest decline of any five-year period since 1976, according to data from previous censuses and income surveys.
The Gini index can take values between 0 and 1. A larger value means more inequality.
Income inequality decreased in all provinces and territories, but Alberta recorded the largest decline. In that province, the Gini index of household after-tax income fell from 0.371 in 2015 to 0.307 in 2020. The reductions in income inequality across provinces and territories were largely driven by increases in government transfers.
In 2020, income inequality was highest among households in Nunavut, Ontario, Alberta, and British Columbia. It was lowest among households in Prince Edward Island, New Brunswick, Yukon, and Quebec. Generally, regions with higher median household incomes also had higher income inequality.
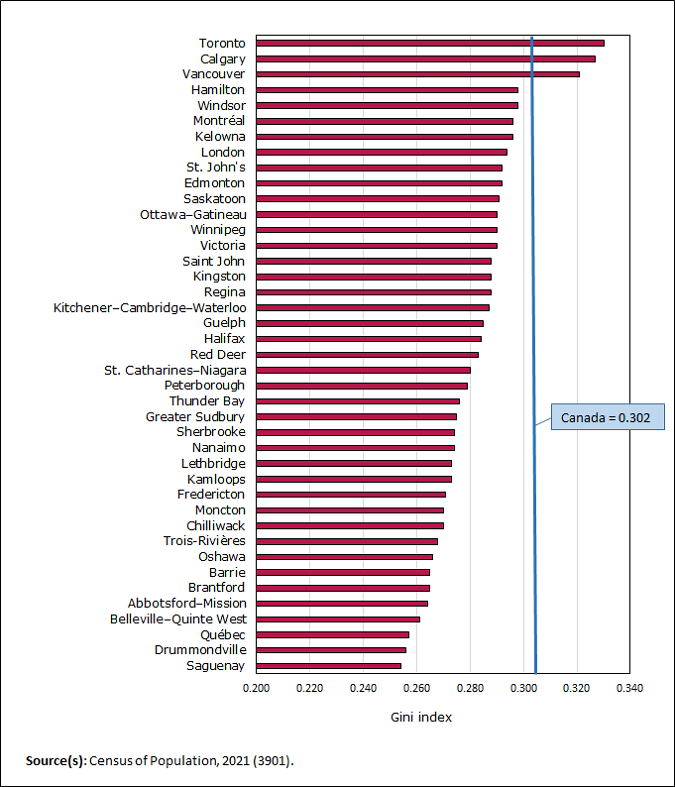
There was more income inequality in Canada's larger urban centres compared with smaller cities and rural areas in 2020. For instance, the Gini index for household after-tax income was 0.330 in Toronto, 0.327 in Calgary, and 0.321 in Vancouver. In contrast, it was 0.254 in Saguenay, 0.256 in Drummondville, and 0.257 in Québec. In Canada's rural areas, the Gini index for household after-tax income was 0.294.
Although income inequality was generally lower in smaller population centres compared with larger ones, there were notable exceptions. At 0.350, Canmore, a CA in Alberta with a population just under 16,000 in 2021, had the highest Gini index among all urban centres in Canada.
The low-income rate records its largest decline from 2015 to 2020
The reduction in income inequality from 2015 to 2020 was accompanied by a reduction in the percentage of Canadians living with low income. Overall, 11.1% of Canadians were in a low-income situation in 2020, down from 14.4% in 2015.
This was the largest decline of any five-year period since 1976. It was largely driven by higher government transfers, especially pandemic-related benefits, which mostly benefitted the working-age population, and the Canada Child Benefit, which benefitted parents and children.
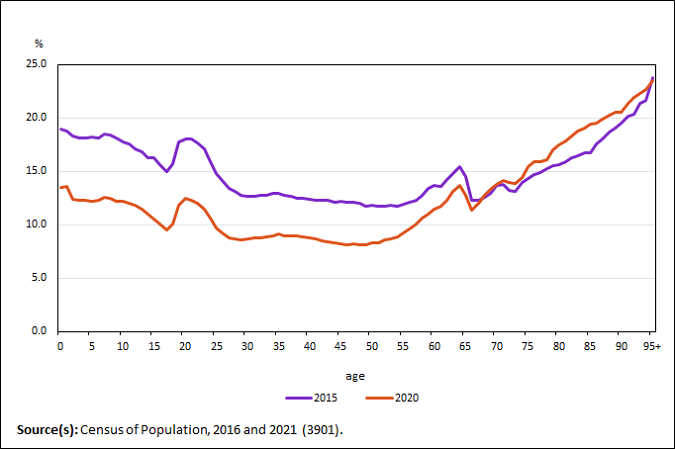
Changes in low-income rates from 2015 to 2020 by single years of age help to illustrate the impacts of these benefits and transfers over this period. While the low-income rate was lower in 2020 than in 2015 for children, youth and the working-age population, there was little change over the same period for seniors. For Canadians aged 65 and older, the low-income rate in 2020 was 15.0%, up from 14.4% in 2015.
The census counted 1.7 million Canadians aged 80 and older in 2021, up from 1.5 million in 2016. Among seniors in this age group, the low-income rate increased from 17.3% in 2015 to 19.3% in 2020.
Data from surveys show the market basket measure fell from 2015 to 2020 for most groups, including seniors
Data from the census on the market basket measure (MBM), Canada's official poverty line, will be released in the coming months. It is important to note that trends in the market basket measure and low income measure (LIM) rates sometimes differ. This is due to differences in the way the two measures calculate low income.
The MBM is based on the concept of an individual or family not having enough income to afford the cost of a basket of goods and services. Therefore, when the incomes of lower-income people rise, the MBM rate tends to fall, because more people can afford this basket of goods and services.
The LIM is based on the concept of an individual or family having a low income relative to the Canada-wide median. In general, for the LIM rate to fall, the income gap between lower-income people and other people has to narrow.
It is important to consider both indicators for a more complete picture of low-income trends in Canada. For example, according to survey data, the MBM rate for seniors declined steadily, from 7.1% in 2015 to 3.1% in 2020, while the LIM rate changed little. A decline in the MBM rate for seniors shows that the income levels of lower-income seniors have improved, but stability in their LIM rate shows that the income gap between lower-income seniors and other Canadians is steady.
Fewer families with children are in low income in 2020, but one-parent families and people living alone, remain more vulnerable
The low-income rates for Canadians and their children living in couple-parent and lone-parent families reached historical lows in 2020. However, one-parent families, the majority of which are headed by women, remained more vulnerable to low income.
In 2020, 26.2% of those living in lone-parent families with children under 18 were in low income, compared with 6.8% among couple-parent families with children under 18.
One-person households are now the most common type of household in Canada, having surpassed couples with children for the first time in 2016. The low-income rate for Canadians living alone declined more modestly, from 31.9% in 2015 to 30.2% in 2020. This was the smallest decline among the different household types, and people living alone remained the most likely to be in low income.
Declines in the low-income rate from 2015 to 2020 were observed in all provinces and territories. In 2020, the low-income rate was highest in Newfoundland and Labrador, Nova Scotia, and Nunavut. It was lowest in the Northwest Territories, Yukon, and Alberta.
Regions with higher median after-tax incomes tended to have lower rates of low income. There were exceptions, however. For example, Nunavut had the second-highest median after-tax income of all provinces and territories, but also the third-highest low-income rate, reflecting higher income inequality.
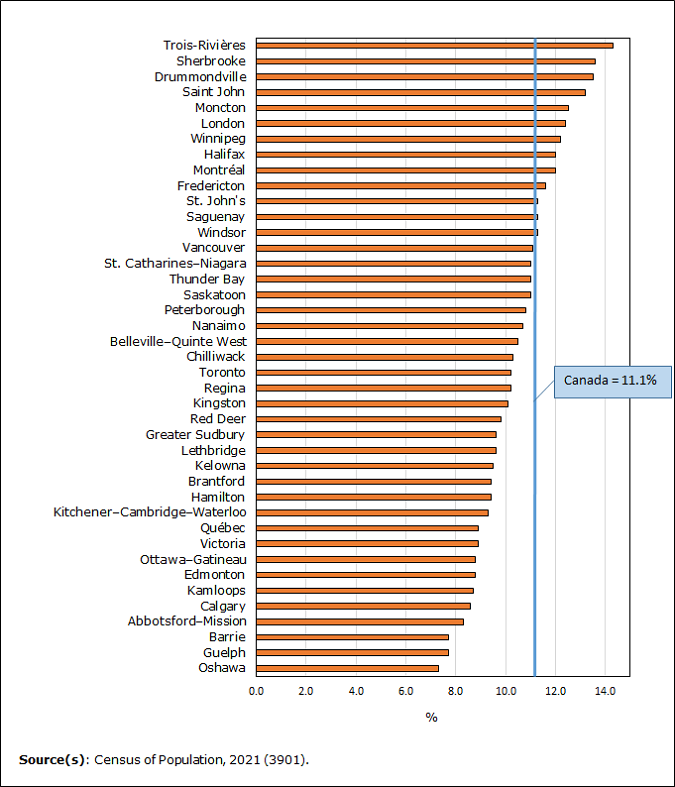
There were significant variations in the low-income rates of urban centres across Canada. For example, in Trois-Rivières, the low-income rate (14.3%) was nearly twice as high as the rate in Oshawa (7.3%). The low-income rate in Montréal (12.0%) was above the national average of 11.1%, while the rate in Toronto (10.2%) was below the national average.
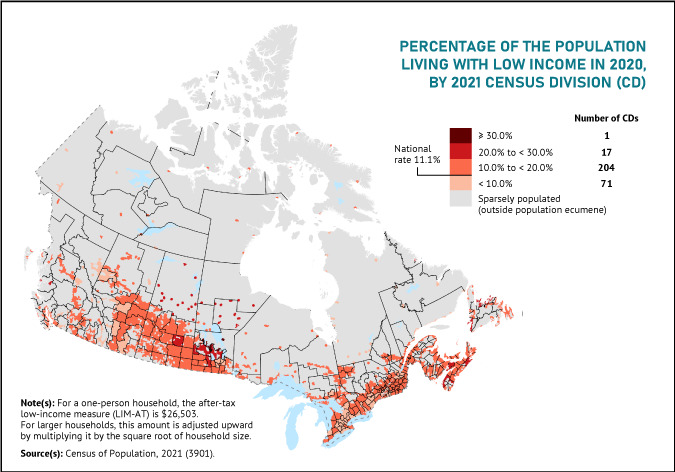
Among large urban centres, downtown areas have been fast growing, but income levels tend to be lower there than in other neighbourhoods and in the suburbs. In 2020, the low-income rate within downtown areas (21.4%) was almost twice as high as the average for Canada as a whole (11.1%).
There was little difference between the low-income rates of rural areas and those of small, medium, or large population centres. In 2020, the low-income rate was 11.6% in rural areas, compared with 11.1% in small population centres, 11.0% in medium population centres and 10.9% in large population centres.
The official poverty rate also fell from 2015 to 2020
The market basket measure (MBM) was adopted as Canada's Official Poverty Line in June 2019. According to the MBM, a family lives in poverty if it does not have enough income to purchase a specific basket of goods and services in its community.
According to the Canadian Income Survey, 6.4% of the population lived below Canada's Official Poverty Line in 2020, down from 10.3% in 2019. Although the national poverty rate before 2020 was generally trending downward, the large decrease observed from 2019 to 2020 was mostly because of increases in government transfers.
The same survey source shows that the low-income measure fell to 9.3% in 2020, the lowest rate since the beginning of the series in 1976.
Low income and inequality, as measured through the census, may be larger than those measurements derived through surveys. This is the result of the census having better coverage of Canadians who are at each end of the income distribution. Likewise, inequality measured through the census tends to be greater. Inequality measured by the Gini index was 0.281 in the Canadian Income Survey for 2020, compared with 0.302 in the census.
A separate Census in Brief article will be released in the coming months and will examine poverty trends in Canada, based on results from the 2021 Census of Population long-form questionnaire. The release will complement previously released findings from the Canadian Income Survey, allowing for a much finer level of data disaggregation.
Looking ahead
The pandemic and the income support programs introduced by governments across Canada profoundly impacted the income profile of Canadians in 2020. The census data released today reflect these impacts.
Reliance on income support benefits and larger transfer receipt through the Employment Insurance system continued well into 2021. However, employment returned to its pre-pandemic level in September 2021, as did economic activity in November 2021. Furthermore, most of the major COVID-19 income support programs had ended by the fall of 2021, as the CERB ended in September 2020 and the CRB ended in October 2021.
Income trends could therefore remain unsettled into 2021 and 2022. Some of the most striking developments for 2020, specifically the strong growth in household after-tax income and the drop in income inequality and in the low income rate, are not expected to continue in 2021 and 2022 because the driving force behind the recent movements was temporary in nature.
This release presented an income portrait of Canadians, based on data from the short-form census questionnaire. Over the coming months, Statistics Canada will release additional data based on the more detailed long-form census questionnaire, such as income statistics for First Nations, Métis and Inuit and for racialized groups. Upcoming releases will also allow for income statistics to be analyzed in conjunction with statistics from other themes covered in the long-form census questionnaire, such as the education, labour, and work activity characteristics of Canadians.
Note to readers
Canadians are invited to download the StatsCAN app to view the census results.
Definitions, concepts and geography
This is the first release of income data from the 2021 Census. It is based on annual income information for the 2020 reference year for the entire population. As in the 2016 Census, Statistics Canada used income data from the Canada Revenue Agency for all census respondents to allow for a very comprehensive estimate of income and low income. This approach reduces respondent burden and allows for a much larger number of observations and therefore more accurate estimates for low levels of geography or small populations.
Information on the characteristics of Canadians, such as education, occupation, Indigenous identity and ethnocultural composition, will be available, along with income, from the long-form census questionnaire in subsequent census releases.
This release largely analyzes income based on medians. The median is the level of income where half the population had higher income and the other half had lower income.
The low-income measure, after tax (LIM-AT) is an internationally recognized measure of low income. The concept underlying the LIM-AT is that a household has low income if its income is less than half of the median income of all households.
The term "urban centres" in this release includes census metropolitan areas (CMAs) and census agglomerations (CAs). "Large urban centres" refers to CMAs.
In this release, the term "adults" refers to those aged 15 and older.
Beginning in 2021, the census asked questions about both the sex at birth and the gender of individuals. While data about sex at birth are needed to measure certain indicators, for the purposes of this release, gender (as opposed to sex) is the standard variable used in concepts and classifications. For more details on the new gender concept, see Age, Sex at Birth and Gender Reference Guide, Census of Population, 2021.
In this analysis, the sex variable in census years prior to 2021 and the two-category gender variable in the 2021 Census are used when making comparisons over time. Although sex and gender refer to two different concepts, the introduction of gender is not expected to have a significant impact on data analysis and historical comparability, given the small size of the transgender and non-binary populations. For additional information on changes of concepts over time, please consult Age, Sex at Birth and Gender Reference Guide, Census of Population, 2021.
Given that the non-binary population is small, data aggregation to a two-category gender variable is sometimes necessary to protect the confidentiality of responses provided. In these cases, individuals in the category "non-binary persons" are distributed into the other two gender categories. Unless otherwise indicated in the text, the category "men" includes men, as well as some non-binary persons. The category "women" includes women, as well as some non-binary persons.
A fact sheet on gender concepts, Filling the gaps: Information on gender in the 2021 Census, is also available.
2021 Census of Population products and releases
Today, Statistics Canada is releasing a third set of results from the 2021 Census of Population.
Several 2021 Census products are also available today on the 2021 Census Program web module. This web module has been designed to provide easy access to census data, free of charge.
Analytical products include this article in The Daily. Additional Census in Brief articles will be released in the coming months.
Data products include the income results for a wide range of standard geographic areas, available through the Census Profile and data tables.
Focus on Geography provides data and highlights on key topics found in this Daily release at various levels of geography.
Reference materials are designed to help users make the most of census data. They include the Guide to the Census of Population, 2021, the Dictionary, Census of Population, 2021; and the 2021 Census of Population questionnaires. The Income Reference Guide is also available.
Geography-related 2021 Census products and services can be found under Census Geography. These include thematic maps, which show data for various standard geographic areas, along with Focus on Geography and the Census Program Data Viewer, which are data visualization tools.
Videos on census concepts can be found in the Census learning centre.
The Income explorer is an interactive chart that shows specific percentile lines of several income concepts by various categories and geographies.
An infographic, Income in Canada, 2020, is also available.
Over the coming months, Statistics Canada will continue to release results from the 2021 Census of Population and provide an even more comprehensive picture of the Canadian population. Please see the 2021 Census release schedule to find out when data and analysis on the different topics will be released throughout 2022.
Contact information
For more information, or to enquire about the concepts, methods or data quality of this release, contact us (toll-free 1-800-263-1136; 514-283-8300; infostats@statcan.gc.ca) or Media Relations (statcan.mediahotline-ligneinfomedias.statcan@statcan.gc.ca).
- Date modified:


